Predicting Smoking Status Using Machine Learning Algorithms and Statistical Analysis

Adv. Sci. Technol. Eng. Syst. J. 3(2), 184–189 (2018);
 DOI: 10.25046/aj030221
Smoking has been proven to negatively affect health in a multitude of ways. As of 2009, smoking has been considered the leading cause of preventable morbidity and mortality in the United States, continuing to plague the country’s overall health. This study aims to investigate the viability and effectiveness of some machine learning algorithms for predicting the smoking status of patients based on their blood tests and vital readings results. The analysis of this study is divided into two parts: In part 1, we use One-way ANOVA analysis with SAS tool to show the statistically significant difference in blood test readings between smokers and non-smokers. The results show that the difference in INR, which measures the effectiveness of anticoagulants, was significant in favor of non-smokers which further confirms the health risks associated with smoking. In part 2, we use five machine learning algorithms: Naïve Bayes, MLP, Logistic regression classifier, J48 and Decision Table to predict the smoking status of patients. To compare the effectiveness of these algorithms we use: Precision, Recall, F-measure and Accuracy measures. The results show that the Logistic algorithm outperformed the four other algorithms with Precision, Recall, F-Measure, and Accuracy of 83%, 83.4%, 83.2%, 83.44%, respectively.
1. Introduction
As of 2009, smoking has been considered the leading cause of preventable morbidity and mortality in the United States, continuing to plague the country’s overall health [1]. Patients admitted to a hospital are often asked their smoking status upon admission, but a simple yes/no answer can be misleading. Patients who answer no can previously be smokers, or have recently quit smoking. The ‘no’ responses also do not consider their household member’s smoking status, which can lead to continued exposure to secondhand smoke. Lastly, a ‘no’ response could still experience tobacco exposure through other forms, such as chewing tobacco. This study aims to use machine learning algorithms to predict a patient’s smoking status based on medical data collected during their stay at a medical center. In the future, these predictive models may be useful for evaluating a patient’s smoking status who is unable to speak.
Smoking has been proven to negatively affect your health in a multitude of ways. Smoking and secondhand smoke can magnify current harmful health conditions, and has been linked as the cause for others. Smoking and secondhand smoke often trigger asthma attacks for persons suffering from Asthma, and almost every case of Buerger’s disease has been linked to some form of tobacco exposure. Various forms of cancer are caused by smoking, secondhand smoke, and other tobacco products [2]. In addition to being deemed the cause of certain cancers, most commonly known for causing lung and gum cancer, smoking and secondhand smoke also prevents the human body from fighting against cancer. Gum disease is often caused by chewing tobacco products, but continuing to smoke after gum damage can inhibit the body from repairing itself, including the gums. Smoking, secondhand smoke, and tobacco products are included in creating and preventing the recovery of the following additional diseases or health conditions: chronic obstructive pulmonary disease (COPD), diabetes, heart disease, stroke, HIV, mental health conditions such as depression and anxiety, pregnancy, and vision loss or blindness [3].
smokers population, which in turn can help better treat and handle patients with previous or current tobacco use more effectively.
Machine learning techniques are being applied to a growing number of domains including the healthcare industry. The fields of machine learning and statistics are closely related, but different in terms a number of terminologies, emphasis, and focus. In this work, machine learning is used to predict the smoking status of patients using several classification algorithms. Such algorithms include Multilayer Perceptron, Bayes Naïve, Logistic Regression, J48, and Decision Tree. The algorithms are used with the objective of predicting a patient’s smoking status based on vitals. To determine if smoking has negative effects on vitals, One-way ANOVA analysis with SAS tool will be used repeatedly to determine whether different blood test readings from the patients are statistically different between smokers and non-smokers. The dataset used in this study was obtained from a community hospital in the Greater Pittsburgh Area [4]. The data set consists of 40,000 patients as well as 33 attributes.
The remainder of this paper is structured as follows: Section 2 discusses related work and the used dataset. Section 3 presents analytic methods and results. Section 4 discussed the results provides further recommendations; and Section 5 concludes the study.
2. Related Work
The I2b2 is a national center for Biomedical Computing based at Partners HealthCare System in Boston Massachusetts [5]. I2b2 announced an open smoking classification task using discharge summaries. Data was obtained from a hospital (covered outpatient, emergency room, inpatient domains). The smoking status of each discharge summary was evaluated based on a number of criteria. Every patient was classified as “smoker”, “non-smoker”, or “unknown”. If a patient is a smoker, and temporal hints are presented, then smokers can be classified as “past smoker” or “current smoker.” Summaries without temporal hints remained classified as “smoker”.
Uzuner et. al. utilized the i2b2 NLP challenge smoking classification task to determine the smoking status of patients based on their discharge records [6]. Micro-average and macro-averaged precision, recall, and F-measure were metrics used to evaluate performance in the study. A total of 11 teams with 23 different submissions used a variety of predictive models to identify smoking status through the challenge with 12 submissions scoring F-measures above 0.84. Results showed that when a decision is made on the patent smoking status based on the explicitly stated information in medical discharge summaries, human annotators agreed with each other more than 80% of the time. In addition, the results showed that the discharge summaries express smoking status using a limited number of key textual features, and that many of the effective smoking status identifiers benefit from these features.
McCormick et. al., also utilized the i2b2 NLP challenge smoking classification task using several predictive models on patient’s data to classify a patient’s smoker status [7]. A classifier relying on semantic features from an unmodified version of MedLEE (a clinical NLP engine) was compared to another classifier which relied on lexical features. The classifiers were compared to the performance of rule based symbolic classifiers. The supervised classifier trained by MedLEE stacked up with the top performing classifier in the i2b2 NLP Challenge with micro-averaged precision of 0.90, recall of 0.89, and F-measure of 0.89.
Dumortier et. al. studied a number of machine learning approaches to use situational features associated urges to smoke during a quit attempt in order to accurately classify high-urge states. The authors used a number of classifiers including Bayes, discriminant analysis, and decision tree learning methods. Data was collected from over 300 participants. Sensitivity, specificity, accuracy and precision measures were used to evaluate the performance of the selected classifiers. Results showed that algorithms based on feature selection achieved high classification rates with only few features. The classification tree method (accuracy = 86%) outperformed the naive Bayes and discriminant analysis methods. Results also suggest that machine learning can be helpful for dealing with smoking cessation matters and to predict smoking urges [8].
3. Data Analysis and Results
The analysis is divided into two parts. In part 1, we use One-way ANOVA analysis with SAS tool to show the statistically significant difference in blood test readings between smokers and non-smokers. In part 2, we use five machine learning algorithms – Naïve Bayes, MLP, Logistic regression classifier, J48 and Decision Table – to predict the smoking status of patients. To compare the effectiveness of these algorithms we use four metrics, namely Precision, Recall, F-measure and Accuracy measures.
3.1. Statistical Analysis using ANOVA Test
In this work, One-way ANOVA analysis with SAS tool [9] was used repeatedly to determine whether different blood test readings from the patients are statistically different between smokers and non-smokers. So, our hypothesis are as follows.
Null Hypothesis (H0): There is no statistical difference in blood test readings between smokers and non-smokers.
Alternative Hypothesis (H1): There is a statistical difference in blood test readings between smokers and non-smokers.
The One-way ANOVA test, based on a 0.05 significance level, and the decision rule will be based on the p-value from the SAS outputs. If the p-value is less than 0.05, the null hypothesis is rejected and the alternative hypothesis is accepted. On the other hand, if the p-value is greater than 0.05, the null hypothesis is accepted. The analysis will be repeated for all blood tests, each of which is listed in Table 1 along with a brief description of its significance.
The results in Table 2 show that there is a significant statistical difference between smokers and non-smokers when it comes to three blood tests: INR, HB, and HCT. To investigate whether these differences were in favor of smokers or non-smokers, descriptive analysis was used (Figures 1, 2, and 3) to show the distribution of each blood test between smokers and non-smokers.
Figure 1 shows that non-smokers have higher values of INR than smokers. According to Mayo Clinic [10], an INR range of 2.0 to 3.0 is generally an effectiveness of anticoagulants. This shows that non-smokers have a more effective therapeutic range than smokers.
Table 1: Lab value definitions
| Blood Test | Significance |
| INR | Measures the effectiveness of the anticoagulants |
| Platelets | Involved in clotting |
| Glucose | Main source of energy and sugar |
| RBC | Red blood cells: carry oxygen and waste products |
| HB | Hemoglobin: Important enzyme in the RBCs |
| HCT | Hematocrit: measures the %RBC in the blood |
| RDW | Red blood cell distribution width |
Table 2: Consolidated statistical results
| Vital Reading | P-Value | Decision |
| INR | <0.0001 | Reject the Null Hypothesis |
| Platelets | 0.2935 | Accept the Null Hypothesis |
| Glucose | 0.1559 | Accept the Null Hypothesis |
| RBC | 0.0882 | Accept the Null Hypothesis |
| HB | 0.0005 | Reject the Null Hypothesis |
| HCT | 0.0022 | Reject the Null Hypothesis |
| RDW | 03509 | Accept the Null Hypothesis |
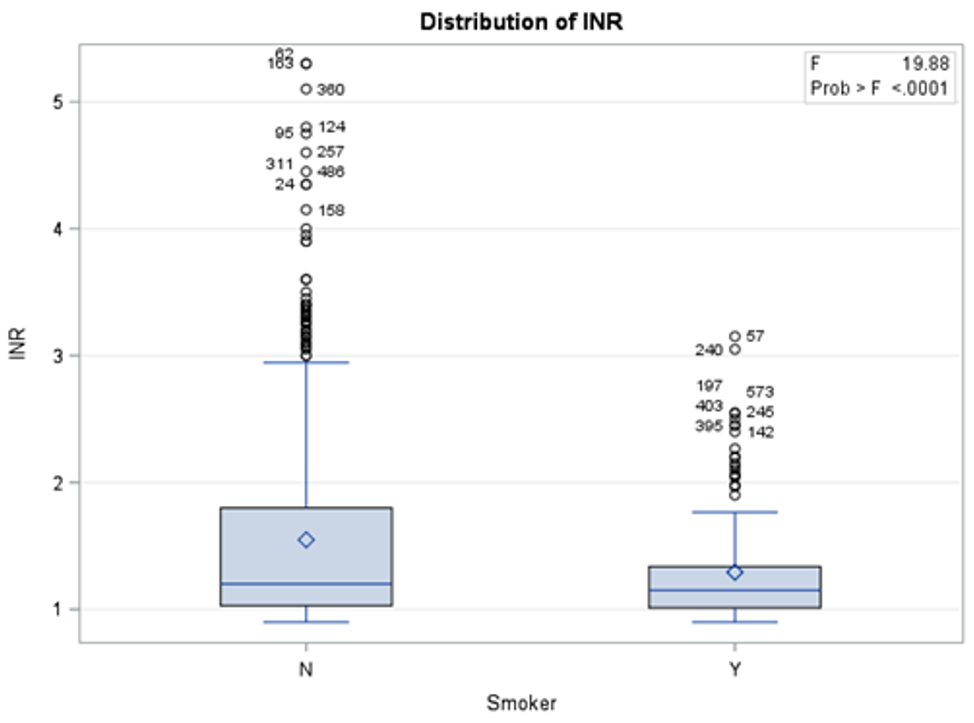 Figure 1: Distribution of INR blood test results between smokers and non-smokers
Figure 2 shows that non-smokers have lower values of HB than smokers. According to Mayo Clinic, an HB range between 12.0 and 17.5 is considered normal. This shows that although the readings of HB blood tests were statistically different between non-smokers and smokers, the difference was in general within the normal range.
Figure 3 shows that non-smokers have lower values of HCT than smokers. According to Mayo Clinic, an HB range between 37.0 and 52.0 is considered normal. This shows that although the readings of HCT blood tests were statistically different between non-smokers and smokers, the difference was in general within the normal range.
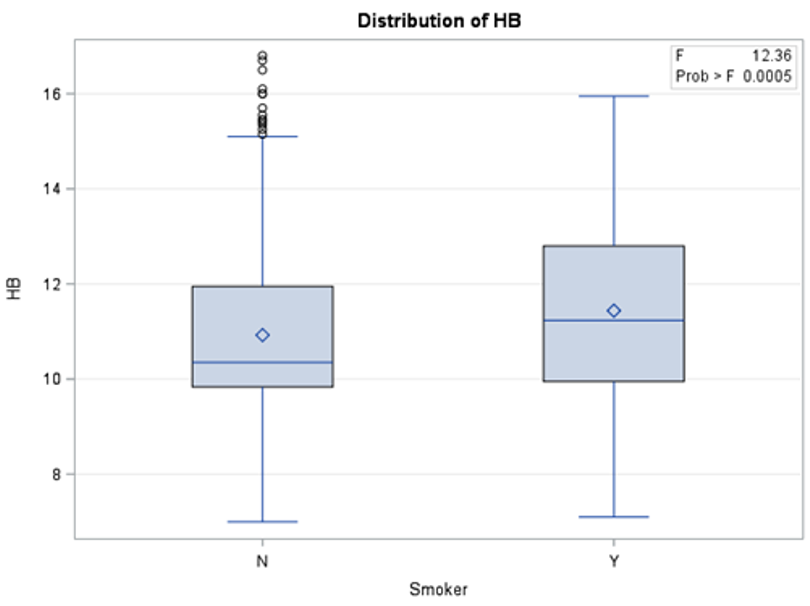 Figure 2: Distribution of HB blood test results between smokers and non-smokers
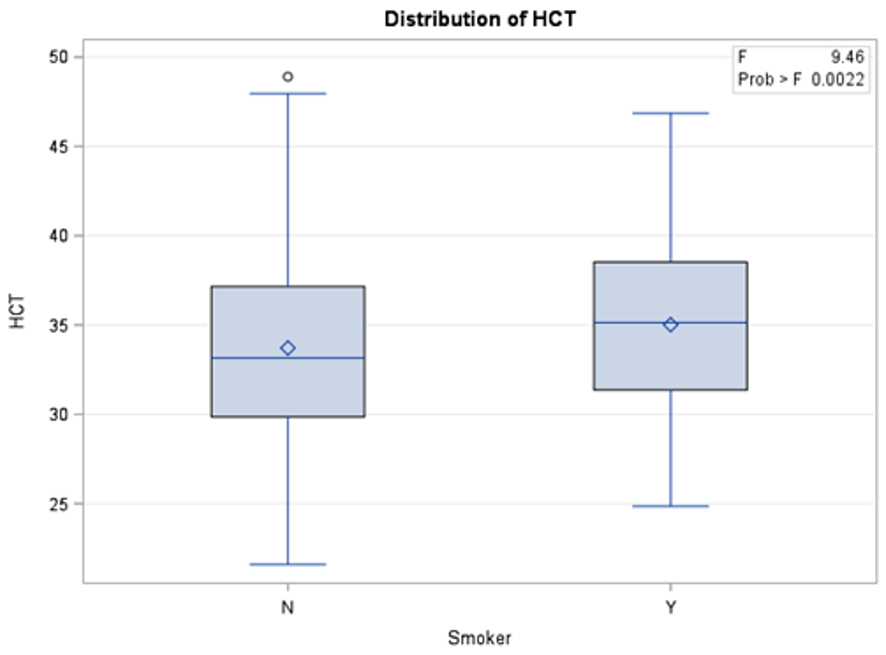 Figure 3: Distribution of HCT blood test results between smokers and non-smokers
3.2. Classification Analysis using Machine Learning
In this work, the Waikato Environment for Knowledge Analysis (Weka) (https://www.cs.waikato.ac.nz/ml/weka/) will be utilized to analyze the dataset [11]. The machine learning models utilized in this study include five classification algorithms, namely, Naïve Bayes, Multilayer Perceptron, Logistic, J48, and Decision Table.
3.2.1. Classifiers Description
Table 3 provides a summary about the classification algorithms characteristics and features. Naive Bayes is a popular versatile algorithm based on Bayes’ Theorem, from the English mathematician Thomas Bayes. Bayes’ Theorem provides the relationship between the probability of two events and the conditional probabilities of those events. The Naïve Bayes Classifier assumes that the presence of one feature of a class is not related to the presence or absence of another. Naïve Bayes classifier is a well-known algorithm because of its reputation for computational efficiency and overall predicative performance [12].
Table 3: Summary of classifiers characteristics and feature
| Algorithm | Characteristics and Feature |
| Naïve Bayes | Computationally efficient, independence assumptions between the features, needs less training data, works with continuous and discrete data. |
| MLP | Many perceptrons organized into layers, ANN models are trained but not programmed, consist of three layers: input layer, hidden layer, and output layer. |
| Logistic | Multinomial logistic regression model with a ridge estimator |
| J48 | Creates a binary tree, selects the most discriminatory features, and comprehensibility |
| Decision Table | Groups class instances based on rules, easy to understand, provides good performance |
Multilayer Perceptron (MLP) is an Artificial Neural Network (ANN) model that maps sets of input data onto sets of suitable output data. ANN models are trained, not programmed. This means that the model takes a training set of data and applies what it has learned to a new set of data (the test data). The MLP ANN model is similar to a logistic regression classifier, with three layers: input layer, hidden layer, and output layer. The hidden layer exits to create space where the input data can be linearly separated. More hidden layers may be used for added benefit and performance, but MLP is used because of its overall performance [13].
The Logistic algorithm is a classifier for building and using multinomial logistic regression model with a ridge estimator to classify data. The version implemented using Weka states that it is slightly modified from the normal Logistic regression model, mainly to handle instance weights [14].
The J48 algorithm is a popular implementation of the C4.5 decision tree algorithm. Decision tree models are predictive machine learning models that determine the output value based on the attributes of input data. Each node of a decision tree signifies each attribute of the input data. The J48 model creates a decision tree that identifies the attribute of the training set that discriminates instances most clearly. Instances that have no ambiguity are terminated and assigned an obtained value, while other cases look for an attribute with the most information gain. When the decision tree is complete, and values are assigned to their respective attributes, target values of a new instance are predictively assigned [15].
Lastly, the Decision Table algorithm utilizes a simple decision table to classify data. Decision tables are best described to programmers as an if-then-else statement, and less complicated as a flow chart. A decision table groups class instances based on rules. These rules sort through instances and their attributes and classify each instance based on those rules. Decision tables are often easier to understand than other algorithm models while providing necessary performance [16].
Each model was run with a 66% split, using 66% of input as the training data and 34% as the test data. All algorithms are implemented through Weka after preprocessing, Table 4.
Table 4: Weka Schema
| Algorithm | Weka Schema Attribute |
| Naïve Bayes | weka.classifiers.bayes.NaiveBayes |
| MLP | weka.classifiers.functions.MultilayerPerceptron -L 0.3 -M 0.2 -N 500 -V 0 -S 5 -E 20 -H a |
| Logistic | weka.classifiers.functions.Logistic -R 1.0E-8 -M -1 -num-decimal-places 4 |
| J48 | weka.classifiers.trees.J48 -C 0.25 -M 2 |
| Decision Table | weka.classifiers.rules.DecisionTable -X 1 -S “weka.attributeSelection.BestFirst -D 1 -N 5” |
3.2.2. Preprocessing
A sample of the large dataset was used for analysis due to available resources. A few samples were created prior to this study for previous work. The sample contains 534 total patients, with 311 non-smokers and 87 smokers. This remains relatively consistent with the overall ratio of smokers to non-smokers in the full dataset. The smoker attribute contained 136 missing values, accounting for 25% of the patients in the sample. To account for missing values, we utilized a Weka filter called “ReplaceMissingValues”. This filter replaces missing values through the selected attribute with modes and means of the values in the training set.
After addressing missing values for the class attribute, oversampling was applied to add additional data for analysis. Oversampling was added to try and alter the ratio of smokers to non-smokers closer to the original dataset. The SMOTE algorithm was used through Weka and applied three times, bringing the total instances to about 1000 patients. All preprocessing is done using Weka as listed in Table 5.
Table 5: Weka Filters
| Algorithm | Type | Weka Attribute |
| SMOTE | Filter | weka.filters.supervised.instance.SMOTE |
| ReplaceMissingValue | Filter | weka.fliters.unsupervised.attribute.-ReplaceMissingValue |
3.2.3. Means of Analysis
To evaluate the performance of the machine learning model’s, four different measures are used, namely: Precision, Recall, F-measure, and Accuracy, shown in equations 1-4. Precision shows the percent of positive marked instances that truly are positive. Recall is the percentage of positive instances that are correctly identified. Recall is also referred to as sensitivity. F-measure or F-score is a measure of accuracy, that considers the harmonic mean of precision and recall. Accuracy is simply the amount of correctly classified instances from an algorithm.
Figures 4 shows the performance of the five algorithms using the Precision measure. Results show that the J48 and Logistic achieved the highest precision with 83%, followed by MLP, Decision Tree, and Naïve Bayes with Precision values of 81%, 80.5%, and 77.8% respectively.
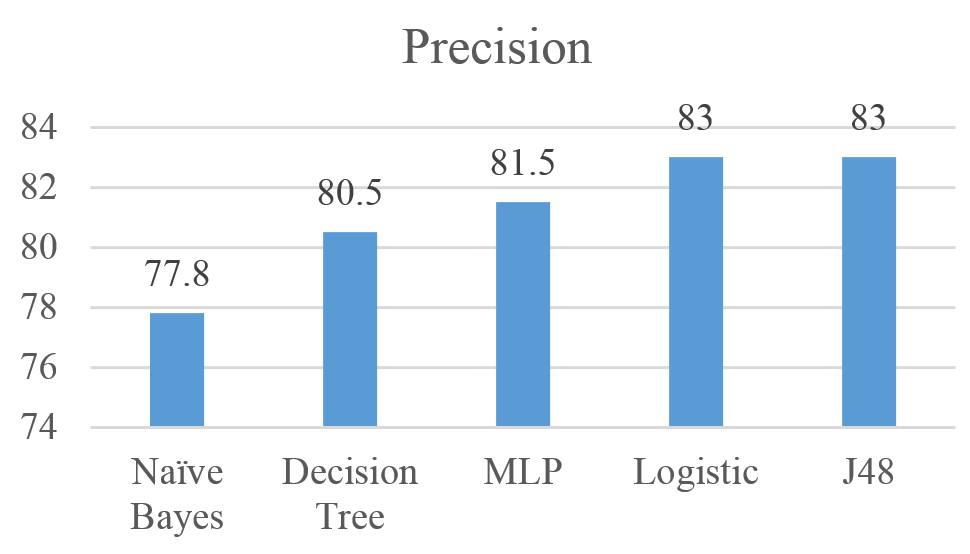 Figure 4: Precision for Naïve Bayes, MLP, Logistic, J48, and Decision Tree results
Figures 5 shows the performance of the five algorithms using the Recall measure. Results show that the J48 achieved the highest Recall with 83.4%, followed by Logistic, MLP, Decision Tree, and Naïve Bayes with Recall values of 83.1%, 81.8%, 81.1% and 77.8% respectively.
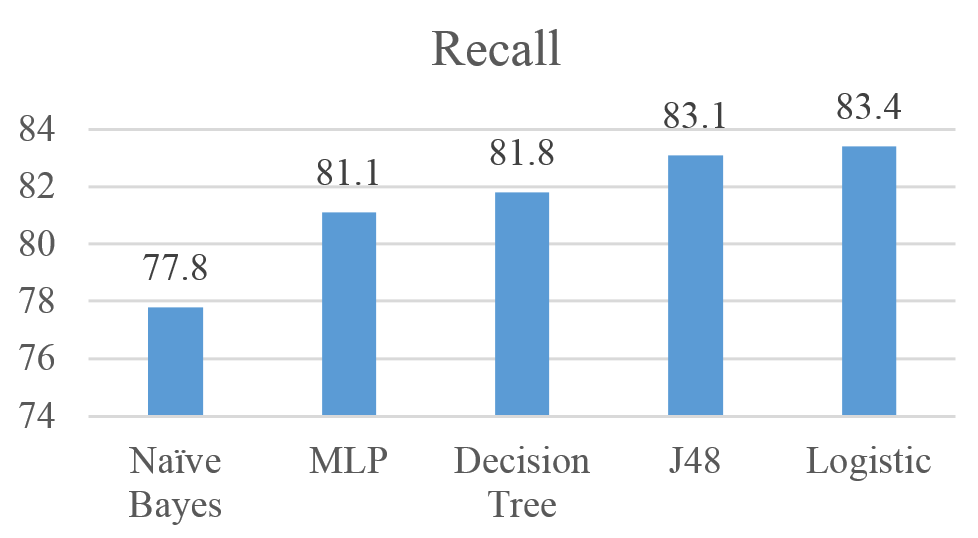 Figure 5: Recall for Naïve Bayes, MLP, Logistic, J48, and Decision Tree results
Figures 6 shows the performance of the five algorithms using the F-Measure. Results show that the Logistic achieved the highest F-Measure with 83.2%, followed by J48, MLP, Decision Tree, and Naïve Bayes with Recall values of 83.1%, 81.3%, 81% and 78.8% respectively.
Figures 7 shows the performance of the five algorithms using the Accuracy measure. Results show that the Logistic achieved the highest F-Measure with 83.44%, followed by J48, Decision Tree, MLP, and Naïve Bayes with Accuracy values of 83.11%, 81.78%, 81.25% and 77.81% respectively.
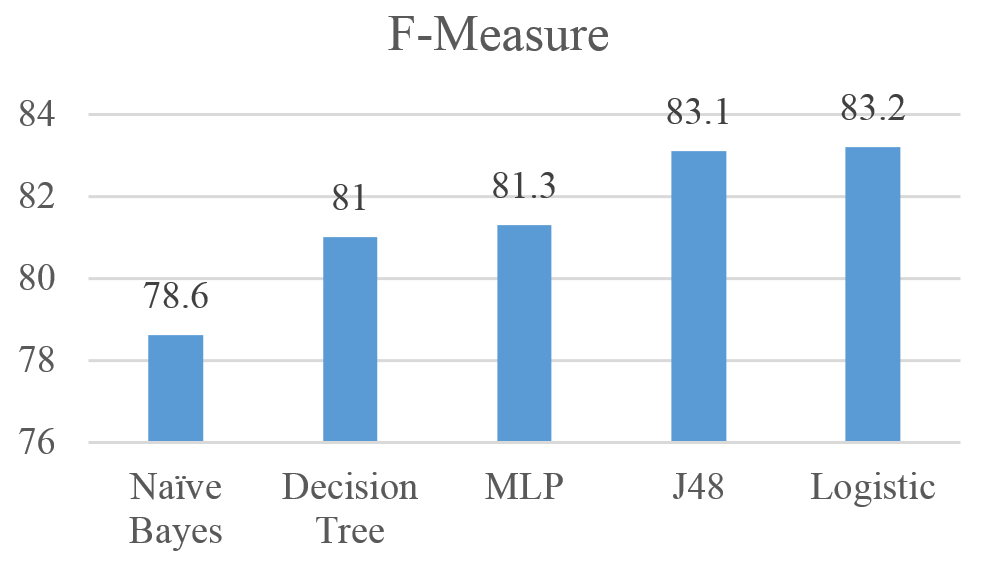 Figure 6: F-measure for Naïve Bayes, MLP, Logistic, J48, and Decision Tree results
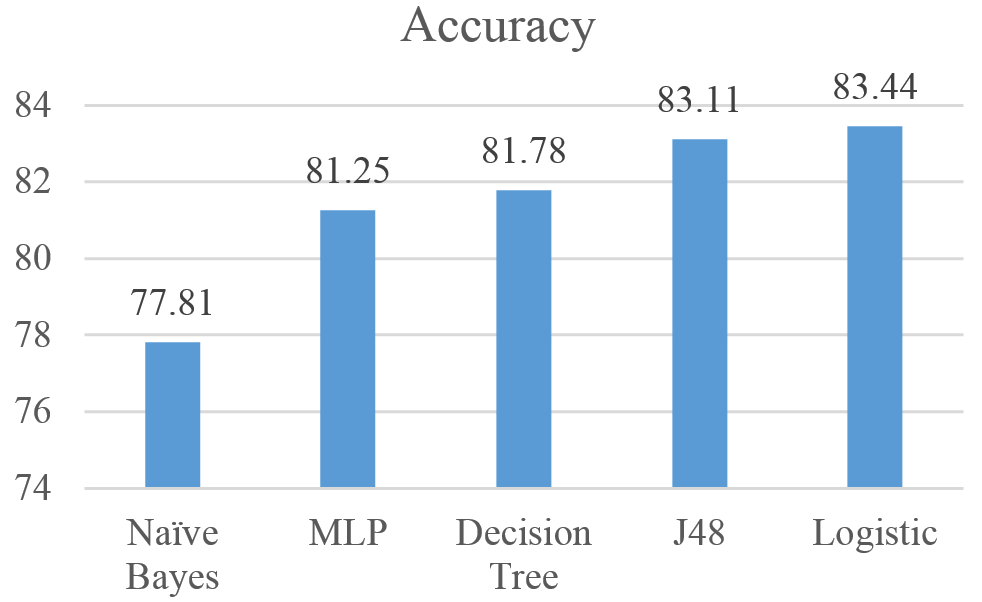 Figure 7: Accuracy for Naïve Bayes, MLP, Logistic, J48, and Decision Tree results
Overall, the results show an indication that the five algorithms are relatively reliable when it comes to predicting the smoking status of patients. Logistic algorithm outperformed the four other algorithms with Precision (83%), Recall (83.4%), F-Measure 83.2%, and Accuracy (83.44%).
4. Recommendations & Further Study
The study addressed the potential of machine learning algorithms to predict the status of smoking among a smoker population. Results showed the potential of such algorithms to predict the smoking states with accuracy level of 83.44%. However, this study has few limitations. There are several items that could be addressed to further this study and improve outcomes, beginning with data preprocessing. Several other methods are available to handle missing values in the dataset. In this study, the ReplaceMissingValues filter was applied in Weka to handle missing values. The Weka Filter replaces null values with means and modes from the training set. Using a method such as replacing null values with moving averages could produce results that are more realistic to the actual smoking status of patients. Other methods of handling missing values could also be explored.
Another improvement could be to increase the size of the sample dataset. In this study, a sample of 534 patients was used and the SMOTE model was applied in preprocessing. Using a larger sample set could also bring the results closer to what would be expected when applying these tests to larger sets of patients. In most cases, there will be more than 534 patient entries to analyze. So, learning the results of these tests on larger real-world sets could further prove the value of these tests.
Lastly, other models may outperform those tested in this study. While five algorithms were tested, and showed wholesome results, others may provide better marks. Clustering models may be a point of interest as those tested in this study are all classifier models. There is an abundant amount of classifier models out there and their results are worth testing.
5. Conclusion
This study showed that five machine learning models can be used reliably to determine the smoking status of patients given blood tests and vital readings attributes. These algorithms are Naïve Bayes, MLP, Logistic, J46 and Decision Tree. Logistic algorithm outperformed the other four algorithms with precision, recall, F-Measure, and accuracy of 83%, 83.4%, 83.2%, 83.44%, respectively.
Using One-way ANOVA analysis with SAS tool, the study also confirmed that there is a significant statistical difference between smokers and non-smokers when it comes to three blood tests: INR, HB, and HCT. The difference was within the normal range with HB and HCT, but it was in favor of non-smokers with INR which measures the effectiveness of anticoagulants. In the future, the models could be implemented in hospital systems to identify patients who do not specify smoking status. Also, the findings from SAS confirms the negative health effects of being a smoker.
- Centers for Disease Control and Prevention: https://www.cdc.gov/tobacco/campaign/tips/diseases/?gclid=CjwKEAjw5_vHBRCBtt2NqqCDjiESJABD5rCJcbOfOo7pywRlcabSxkzh0VIifcvYI05u-hQ9SsI9RRoCDZfw_wcB
- The Mayo Clinic (2017). Retrieved May 01, 2017, from http://www.mayoclinic.org/
- , Dube, A., McClave, C., James, R., Caraballo, , R., Kaufmann, & T., Pechacek, (2010, September 10). Vital Signs: Current Cigarette Smoking Among Adults Aged =18 Years United States, 2009. Retrieved from Centers for Disease Control and Prevention: https://www.cdc.gov/mmwr/preview/mmwrhtml/mm5935a3.htm
- , Keyes, C., Frank, A., Habach and R. Seetan. Artificial Neural Network Predictability: Patients’ Susceptibility to Hospital Acquired Venous Thromboembolism. The 32th Annual Conference of the Pennsylvania Association of Computer and Information Science Educators (PACISE), At Edinboro University of Pennsylvania. March 31st and April 1st, 2017.
- Partners Healthcare. (2017). Informatics for Integrating Biology & the Bedside. Retrieved May 23, 2017, from i2b2: https://www.i2b2.org/NLP/DataSets/Main.php
- , Uzuner, I., Goldstein, Y., Luo, & I., Kohane, (2008). Identifying Patient Smoking Status from Medical Discharge Records. J Am Med Inform Assoc, 15(1), 14-24. doi:10.1197/jamia.m2408
- , McCormick, N., Elhadad & P., Stetson (2008). Use of Semantic Features to Classify Patient Smoking Status. Retrieved March 5, 2017, from Columbia.edu: http://people.dbmi.columbia.edu/noemie/papers/amia08_patrick.pdf
- , Dumortier, E., Beckjord, S., Shiffman,, & E., Sejdic (2016). Classifying smoking urges via machine learning. Computer methods and programs in biomedicine, 137, 203-213.
- SAS Institute Inc., SAS 9.4 Help and Documentation, Cary, NC: SAS Institute Inc., 2017.
- The Mayo Clinic (2017). Retrieved May 01, 2017, from http://www.mayoclinic.org/
- , Frank, M., Hall, and I., Witten (2016). The Weka Workbench. Online Appendix for “Data Mining: Practical Machine Learning Tools and Techniques”, Morgan Kaufmann, Fourth Edition, 2016.
- , Frank, & R., Bouckaert, (2006, September). Naive bayes for text classification with unbalanced classes. In European Conference on Principles of Data Mining and Knowledge Discovery (pp. 503-510). Springer, Berlin, Heidelberg.
- , Gardner, and S. Dorling. “Artificial neural networks (the multilayer perceptron) – a review of applications in the atmospheric sciences.” Atmos. Environ. 32, no. 14-15 (1998): 2627-2636.
- , Hosmer, S., Lemeshow, and R., Sturdivant. Applied logistic regression. Vol. 398. John Wiley & Sons, 2013.
- , Dietrich, B., Heller, and B., Yang. Data Science and Big Data Analytics: Discovering, Analyzing, Visualizing and Presenting Data. (2015). Wiley.
- , Lu, & H., Liu, (2000). Decision tables: Scalable classification exploring RDBMS capabilities. In Proceedings of the 26th International Conference on Very Large Data Bases, VLDB’00 (p. 373).