An Advanced Algorithm Combining SVM and ANN Classifiers to Categorize Tumor with Position from Brain MRI Images

Adv. Sci. Technol. Eng. Syst. J. 3(2), 40–48 (2018);
 DOI: 10.25046/aj030205
Brain tumor is such an abnormality of brain tissue that causes brain hemorrhage. Therefore, apposite detections of brain tumor, its size, and position are the foremost condition for the remedy. To obtain better performance in brain tumor and its stages detection as well as its position in MRI images, this research work proposes an advanced hybrid algorithm combining statistical procedures and machine learning based system Support Vector Machine (SVM) and Artificial Neural Network (ANN). This proposal is initiated with the enhancement of the brain MRI images which are obtained from oncology department of University of Maryland Medical Center. An improved version of conventional K-means with Fuzzy C-means algorithm and temper based K-means & modified Fuzzy C-means (TKFCM) clustering are used to segment the MRI images. The value of K in the proposed method is more than the conventional K-means. Automatically updated membership of FCM eradicates the contouring problem in detection of tumor region. The set of statistical features obtained from the segmented images are used to detect and isolate tumor from normal brain MRI images by SVM. There is a second set of region based features extracted from segmented images those are used to classify the tumors into benign and four stages of the malignant tumor by ANN. Besides, the classified tumor images provide a feature like orientation that ensures exact tumor position in brain lobe. The classifying accuracy of the proposed method is up to 97.37% with Bit Error Rate (BER) of 0.0294 within 2 minutes which proves the proposal better than the others.
1. Introduction
The brain controls all psychological and physiological activities of human body. These functional activities can be disrupted or damaged due to the abnormal cell division or growing tumor in our brain that causes miscellaneous problems to the malfunction of our body. A human brain is divided into several major areas and these major areas (see Fig. 1) are related to different functional part of our body. Especially, these major areas are known as frontal lobe (marked with 1), central lobe (marked by 2, 3, & 4), parietal lobe (marked by 5 & 6), occipital lobe (marked with 7), and temporal lobe (marked with 8). Frontal lobe functions to control our thinking, emotion, innovation, and other cognitive works. Central lobe is a part of the frontal lobe and this part controls our movement related functions. The temporal lobe is responsible for listening and it helps to avoid the uncertainty principle. Occipital lobe helps us to see or observe anything. Another major part that controls the speech processing through reading compression area, sensory speech area and motor speech area of Broca is parietal lobe. These major areas can be affected by tumors which are definitely threat to our normal living. Therefore, the proper detection is the first priority for the remedy. This paper presents an efficient method for the detection of the tumor size as well as the position with classified tumor stages from MRI images and this work is an extension of our conference paper [1] that was presented in ECCE-2017.
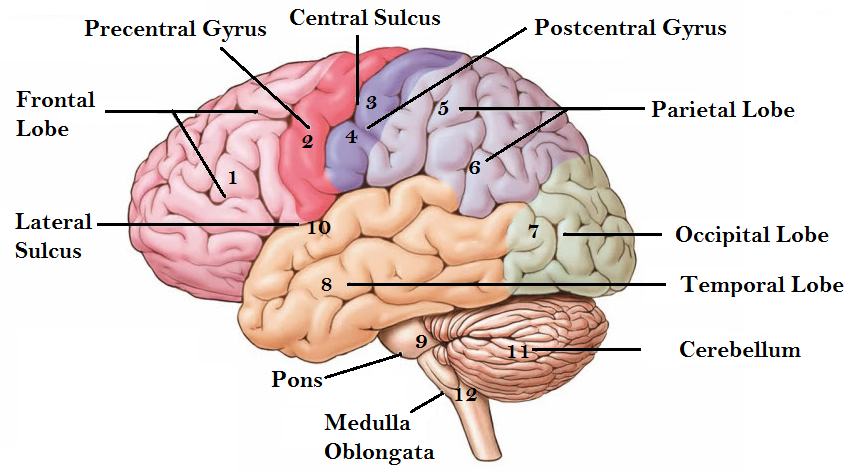 Figure 1: Major functional areas of human brain
In the recent era, there is a radical change in the field of medical science because it has experienced a great invention to the brain imaging. Previously it was predicted by the experts about brain hemorrhage on the basis of symptoms of a patient. But in recent decades the imaging techniques ease the way to detect any abnormality in the brain. There are several techniques of brain imaging like Magnetic Resonance Imaging (MRI), Computed Tomography (CT), Ultrasound Imaging, Positron Emission Tomography (PET), and so on. Among the aforementioned imaging techniques, MRI is a gold accepted modality by which the brain can properly be imaged avoiding any harm.
In case of imaging by MRI, water density in soft tissue is considered and we know that water density in brain tissue is comparatively high than other tissue like bone. Due to the inhomogeneity of brain structure, their contrast values differ randomly in MRI and that is why the proper detection of tumor or tumor size becomes often difficult for the general observer [2]. Recently, proficient brain detection has been a remarkable challenge for medical engineering science. In this case, MRI gets more attention because of its grayscale images. Though MRI provides good contrast value than the other techniques, a suitable segmentation of brain MRI image is ostensible for abnormality detecting from the brain. Since the brain structure is quite complicated, MRI image segmentation needs the sophisticated method and precise results [3]. The segmentation of an MRI image describes notable image regions to attain region(s) of interest (ROI’s) like as tumors, edema, legions, necrotic tissues, etc. from brain MRI images [4].
In medical diagnosis, most of the doctors rely on MRI images due to its robustness and that is why the accuracy of the prediction algorithms is very important because the result is crucial for patient treatment. Region growing algorithm [3] is used to categorize brain tumor through statistical feature based brain MRI image classification. The results are attained through some predefined criteria such as intensity information and/or edges. Consequently, the connected regions of an image are being extracted. The primary limitation of this method is finding seed points through manual interaction. The principal component analysis (PCA) algorithm with K-means discussed in [4] can be used to define the tumor class on the basis of some correlated pixel of the MRI images. The increased number of features and samples cause more time to consume and increase inaccuracy in results of PCA based K-means algorithm [5].
The classification with K-means clustering is claimed for CT-Liver image. Along with experimental application in brain MRI explained that proper segmentation can be possible with exact thresholding [6]. Again the K-value does not exceed greater than 3 if there is any gray level intensity more than that. The research work presented in [7], has introduced a masking algorithm for the classification with the aid of any classifier algorithm. It is effective in finding automatic seed point and neighbors but the dimension of the mask is to change manually for different brain MRI images [7]. In [8]-[10], the Fuzzy C-means algorithm (FCM) was proposed for segmentation. After that, an expert system was introduced with predefined membership and clustered centroid to trace a landmark tissue comparing with a prior model. On the other hand, FCM is described in [8] has limitation due to its noise sensitivity and inadequacy in the detection of abnormality in brain MRI images like a tumor, edema, and cyst. One of the most acceptable and used techniques for brain MRI image classification is Artificial Neural Network (ANN). An ANN technique is discussed in [11] with convincing results. Nonetheless, the procedure of ANN actually requires a perfect pixel classifier, high dimensional training data, and long time to attain the results those are susceptible conditions for the acute patients.
Most of the methods mentioned above are good in some specific point of view like better accuracy but time-consuming or low accuracy with less time consumption. To enhance the overall performance there be requisite of hybridization of those methods in a way that can be able to overcome these limitations.
An advanced algorithm combining SVM and ANN for tumor classification is introduced in this research work. Brain MRI images with normal and abnormal behavior are firstly enhanced through some filter and preprocessing steps. Thereafter, for the detection and classification of the tumor in the brain, proposed segmentation processes namely temper based K-means and modified Fuzzy C-means (TKFCM) clustering algorithm is used. In this technique, the K-values vary from 1 to 8 those are limited to only 1 to 3 in conventional K-means and the automatically updated membership function eradicates limitation of FCM. Then, two kinds of features are extracted from these segmented images. One is used to classify the tumor with SVM as it is easy to classify two kinds of dataset in this method and another is used to classify tumor with ANN into five categories along with four malignant stages. Again, the extracted features provide the classification through ANN and the orientation of tumor define the exact position of the tumor in the lobe (i.e. right, left ¢er) of the brain.
This paper is structured to present that in section 2 conventional K-means and Fuzzy C-means algorithm is presented, the proposed algorithm is described step by step in section 3, the results and discussions are in section 4 and finally, total work is concluded with a few words in section 5.
2. State of the Arts
2.1. K-means clustering
The conventional K-means is discussed with proper explanation in [6] and based on that idea, in this section this method is represented with a slight modification concerning the proposed work. Suppose, a data set {x1, …, xN} contains N number of observations where x is D-dimensional Euclidian variable. The basic intention of K-means is to divide the data set into N numbers of clusters, where the value of K is given. Naturally, this can be considered that a cluster including a group of data points and their inner side distances are small compared to the outer sided distances of the cluster. This concept can be formulated by familiarizing a set of D-dimensional vectors ck, where k=1, …, K, in which ck is an example related to the kth cluster. Therefore, it is considered that ck is representing the center of the cluster. Now it is consequence of the previous technique to find an assignment of those data points of clusters and a set of vectors {ck}, in such an approach that the summation of the squares of each data point distance to its closest vector ck could be minimum.
Now, it is suitable to define some symbolization to designate the assignment of data points to the clusters. For each data point xn, a set of binary indicator variables bnkÎ{0,1} can be introduced, where, k= 1, …, K represents the K clusters. The data point xn is assigned to cluster k then bnk=1 for j≠k. This is recognized as the 1-of-k coding scheme. Consequently, definition of an objective function for distortion measurement [6] can be written as,
![]() The relation (1) represents the summation of the squares of each data point distance to its allotted vector ck. The objective is to determine the values of {bnk} and {ck} so that the system can minimize J. It is usually determined through an iterative procedure in which each iteration comprises two successive steps related to successive optimizations regarding of the values of {bnk} and ck. At first, some preliminary values of ck are chosen and then the first phase J is being minimized with respect to the {bnk}, maintaining the values of ck, fixed. In second phase, J is to minimize in regard to the ck, maintaining the values of {bnk}, fixed. This two-stage optimization process is repeated until convergence. These two stages of updating {bnk} and ck correspond respectively to the E (expectation) and M (maximization) steps of the EM algorithm in [12], and to emphasize this and EM is used the terms E step and M step in the context of the K-means algorithm.
The relation (1) represents the summation of the squares of each data point distance to its allotted vector ck. The objective is to determine the values of {bnk} and {ck} so that the system can minimize J. It is usually determined through an iterative procedure in which each iteration comprises two successive steps related to successive optimizations regarding of the values of {bnk} and ck. At first, some preliminary values of ck are chosen and then the first phase J is being minimized with respect to the {bnk}, maintaining the values of ck, fixed. In second phase, J is to minimize in regard to the ck, maintaining the values of {bnk}, fixed. This two-stage optimization process is repeated until convergence. These two stages of updating {bnk} and ck correspond respectively to the E (expectation) and M (maximization) steps of the EM algorithm in [12], and to emphasize this and EM is used the terms E step and M step in the context of the K-means algorithm.
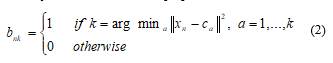
Here, {bnk} is considered as first determination because J in (1) is a linear function of {bnk}. This optimization is generally evaluated to offer a closed form solution. The values of n are independent and that is why this can be optimized for each n, separately. By selecting {bnk} as 1 gives the minimum value of for whatever the value of k. In other words, it can be merely allotted the nth data point to the neighboring cluster center. More strictly, this can be stated as [12],
 Consequently in this situation, it is to consider that the optimization procedure of the ck with the values of {bnk} is occurred immovable. Here, J is the objective function which is actually quadratic function of ck, and it is commonly minimized through setting its derivative regarding the values of ck to be zero and this consideration gives the following mathematical relation given in (3).
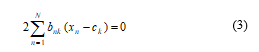 From (3), the values of ck can be easily evaluated as,
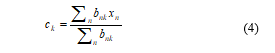 The denominator of (4) is equal to the number of points allotted to the cluster k and subsequently this outcome has a simple explanation, explicitly set ck equal to the mean of all the data points, xn those are being assigned to the cluster k. Hence, this technique is recognized as the K-means algorithm.
2.2. Fuzzy c-means
The Fuzzy c-means (FCM) algorithm for image clustering with FORTAN code was first introduced in [14]. In this paper, we have presented FCM algorithm with an improvement of earlier clustering methods which actually followed by the explanation given in [13]. According the approach of this paper, suppose R is the set of real number where RP and R+ are the set of p tuples of real number and set of nonnegative real number, respectively. Here, Wcn is a matrix of order c × n which is called feature space where feature element, xÎRP & feature vector x=(x1, x2, … , xp) is consists of p real numbers.
Delineation 1: If X is a subset of RP and every function is considered to be assigned to each xÎX, its grade of membership should be in the Fuzzy set u. The function is termed a Fuzzy subset of . It can be noted that there could be infinite Fuzzy sets related to the set . It is anticipated to make “partition” by the means of Fuzzy sets. Normally, it is executed by defining a number of Fuzzy sets on such that for each xÎX. The summation of the Fuzzy memberships of in the previously considered Fuzzy subsets is one.
Delineation 2: It is given that, a finite set XÍRP, , and an integer c (2 ≤ c ≤ n) originate a Fuzzy c partition of X that can be represented by a matrix UÎWcn whose entries satisfy the following conditions:
- i) The number of row of U or exhibits the ith membership function of X.
- ii) The number of column j of U or revelations the values of the c membership functions of the jth data in X.
iii) The term, uik will be construed as ui (xk) which actually represents the value of the membership function of the ith Fuzzy subset for the kth data.
- iv) The summation of the membership values for each will be always one.
- v) No Fuzzy subset will be empty.
- vi) No Fuzzy subset will contain all elements of X .
Mfc denotes the set of the partitions of X in case of Fuzzy c. Here, the distinctive subset Mc Í Mfc of X in every uik is 0 or 1. In addition, the subset is the discrete set of non-Fuzzy c partitions of X. The solution space, M is for the conventional clustering algorithms. The Fuzzy c-means algorithm followed by this proposed work uses the iterative optimization method in order to approximating an objective function minimization which measures similarity on RP×RP.
Delineation 3: Suppose that, UÎWfc is a Fuzzy c partition of X, and consider that v is the c tuple (v1, v2, …,vc), viÎRP. Therefore, Jm : Mfcd Î RP®R+ is described by the following relation:
![]() Additionally, viÎRP is considered to be the cluster center or prototype of class i, 1≤ i ≤ c, and consequently,
Additionally, viÎRP is considered to be the cluster center or prototype of class i, 1≤ i ≤ c, and consequently,
Here, represents any inner product norm metric that defines the Euclidian distance [6], and mÎ [1, ¥]. This distance calculates the distance from cluster centroid to each object. If we take the Euclidean distance with the distance matrix at null iteration, we get following relationship:
 Each column in D symbolizes the object. The first row of D relates to the distance of the each object to the 1st centroid and similarly, the second row of D is the distance of the each object to the 2nd centroid. As for example, distance from cluster center c= (x, y) to the first centroid c1= (α1, α2) is (x– α1)2+ (y– α2)2, and its distance to the second centroid c2 = (β1, β2) is (x– β1)2+ (y– β2)2, and so on.
The FCM algorithm by the iterative optimization method produces a Jm Fuzzy C-partition of the data set X={x1, . . . , xn}. The basic steps to implement the algorithm can be represented by the following consecutive mathematical phases (followed the explanation given in [13]).
1) Fix the cluster numbers c, 2≤ c ≤n where, n is the number of data items. Besides, it is to fix, m (1< m <¥). Choose any inner product induced norm metric e.g., AÎWpp.
2) Initialize the Fuzzy c partition U(0),
3) At step b, b=0, 1, 2, . . . . .
4) Compute the c cluster for the centers {vi(b)} with U(b) and the formula for the ith cluster center is usually consider as the following relation:
 5) Bring up-to-date, U(b): determine the memberships in U(b+1) as the following steps a) & b). For k = 1, 2, 3, …, n.
- a) Evaluate, and :
 b) For data item k, determine the new membership values so that,
- i) if Ik = 1
 ii) else, uik = 0 for all iÎIk and , next k.
6) Compare U(b) and U(b+1) in a convenient matrix norm; if stop; otherwise, set b=b+1, and go to step 4.
The use of FCM algorithm necessitates the determination of several parameters, i.e., cÎm, the inner product norm ||.||, and a matrix norm. In addition to that, the set U(0) of initial cluster centers should have to be defined for sure. Although no necessary rules for choosing a good value of m are available in the literature. In most of the cases, the value of m is typically reported as the useful range of values as 1 ≤ m ≤ 5. The objective of the algorithm mentioned above is to reduce the computational burden imposed by iterative looping between (9) and (10) when c, p, and n are large.
3. Methodology
3.1. MRI image collection
The data of brain MRI images are collected from internet public repository. The images of normal and tumorous brain with Lower Grade Glioma or Glioblastoma Multiforme are collected from the sources [15]-[17]. The number of the used data for each MRI image for classification of normal and tumor brain through SVM is of 39 images. There are 37 images for the classification of benign and malignant tumor stages.
3.2. Image processing
The enhanced images are achieved from the raw MRI images through some steps described as follow.
- Image conversion and orientation setting: The images MRI images are converted from .mha format and .dicom format into .jpg by using MATLAB conversion tools application. On the consequence of the conversion, the sizes and directions are reset. This step is conducted in order to have the same size and direction for all the MRI images. This process is performed automatically by using MATLAB with pixels for the betterment of image usage.
- Image enhancement: The transformed images from the previous step, at first they are converted to L*a*b* images for the comparatively better view and quality. That is why the values of the luminosity of the images can be spanned with a range from 0 to 100 which should be scaled to [0 1] range (appropriate for MATLAB intensity images of class double) before applying the three contrast enhancement techniques like adjusted, adaptive thresholded, and histogram imaging. In this method, for smoothing the images hybridization of both weiner2 (image, [40, 40]) and median2 filter is assured and acquired good results.
3.3. Proposed TKFCM algorithm for tumor detection
In this segmentation process, K-means algorithm is used to segment MRI images on the basis of gray level. This gray level is selected depending on the temper of the image. Then the modified Fuzzy c-means algorithm which depends on the updated membership is applied to segment the temper based K-means segmented image. The membership of modified Fuzzy c-means is updated with the cluster distances from centroid defined by the features of the tumor MRI image. The TKFCM algorithm is the combination of the K-means algorithm and Fuzzy c-means algorithm with some important modifications. The temper is added in the proposed approach along with the conventional K-means algorithm which is identified by the temper or gray level intensity in the brain MRI images. Besides, the Fuzzy c-means membership and Euclidian distance are also modified by the image features.
Here, the coarse image B(xi, yi) which is marked and describing the desired tempers for the K-means could be found through convolution of gray level based temper and image given as,
![]() Temper based window is selected by TMN that is calculated as,
Temper based window is selected by TMN that is calculated as,
 In (12), there is presented a temper based matrix of image with a number of gray level intensities, G and number of bins, S those are used to detect the temper of the images P(xi, yj). Where n is defined as n= (window Size-1)/2. With exact value of the temper, row and column, the desired temper is obtained.
Separately temper based K-means and modified Fuzzy c-means clustering algorithm for segmentation can be written in equation as below:
 Here, M and N are the row and column of the binary coarse image matrix B(xi, yj). The number of data points in clusters, centroid of the cluster, and number of clusters are defined by C, N, and K, respectively.
Then, from (13) and (14) the contour through which the exact location of tumor portion in any image can be find is
![]() The relation given in (15) shows a contour integral of temper based K-means image and updated membership based FCM image, where c is the contour value. The whole method that has been proposed for tumor detection from brain MRI image using Temper based K-means and modified fuzzy C-means is described by the flow chart given in Figure 2.
The relation given in (15) shows a contour integral of temper based K-means image and updated membership based FCM image, where c is the contour value. The whole method that has been proposed for tumor detection from brain MRI image using Temper based K-means and modified fuzzy C-means is described by the flow chart given in Figure 2.
3.4. Feature extraction
The system extracts the first and second order statistical features as in [18]. The first order statistical features like contrast, correlation, entropy, energy, and Homogeneity are used to detect exact tumor and its position in the brain MRI image through SVM. On the other hand, second order region based statistical features provide area, eccentricity, and the perimeter is required for distinguishing the malignant and benign tumor. These second order feature values are used as the input of the ANN and provide desired tumor categories. The feature extraction procedure is mentioned step by step in Figure 2.
3.5. Methodology of combining SVM and ANN
In this proposed work, the combination of SVM and ANN is used to classify the tumor and its stages. The hybridization of the method is used firstly to classify normal and tumor dataset using Linear SVM Kernel and then classify the tumor data into different stages through ANN. In SVM there will be a hyperplane between the set of data points as the decision boundary. In this case, there are two classified data of normal and abnormal (Tumor) brain images and the hyper planes of SVMs are used to separate these classified data as normal data and tumor data. The input towards the ANN is the information of feature extraction; the first and second order statistic features. Then, the ANN will generate the output results as of benign and malignant I-IV tumors. The process of using ANN to attain the proposed goal of this research work is explained by the flow diagram presented in Figure 3.
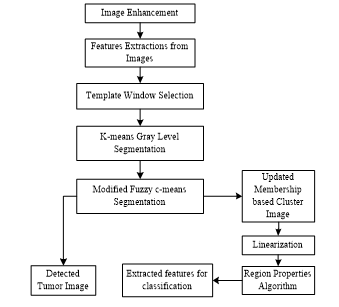 Figure 2: Methodology steps for proposed TKFCM algorithm in tumor detection
4.Results and Discussions
To implement the proposed methodology, first of all, a database of 46 multifaceted brain tumor images is created. It is aforementioned that, the images are collected from the sources of [15]-[17]. To make the quality of the images acceptable for the proposed methodology, some necessary steps were to do and the database was set for the network. To do so for the previous consequence, a thresholding method is applied with threshold level 0.8 and the morphological operation was performed. In addition to that median and hybrid filters were used to remove the primary noises from the MRI images. The filtered MRI images are presented in Figure 4 (a) & 4(d).
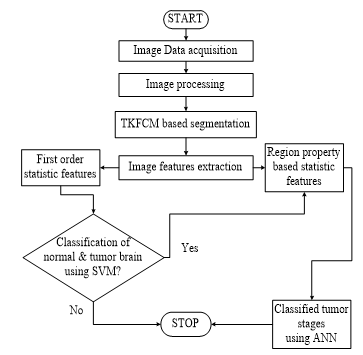 Figure 3: The methodology with their step by step description to implement the proposed hybridization of SVM & ANN algorithms in the filed tumor classification.
The preprocessing steps include filtration, increase of luminosity, and adjust of contrast. After the previous processing, all the images are segmented by the proposed TKFCM based segmentation process. The effects of this segmentation process on images are shown in Figure 4(b) & 4(e) and 4(c) & (f). Temper based K-means (TK) segmentation method shows 8-gray level intensity-based images in Figure 4(b) & 4(e). These figures describe that the input image is segmented by the combined effects of TK-segmentation and the modified approach of FCM algorithm.
The updated membership function with proper Euclidian distance for modified FCM represents the detected tumors in Figure 4(c) & 4(f). These are some examples of the optimum result that can differ this modified and hybrid TKFCM method from the conventional methods. The extracted tumors according to the proposed technique are marked with red color in Figure 4(c) & 4(f). Therefore, these segmented areas can be used to determine the region property based statistical features from the images.
In Figure 5, we presented ten images (given in Figure 5 (a) & (d)) as the input of classification by the proposed TKFCM scheme. These ten images are taken from the created database and used for the classification of the tumor and its area. The enhanced input images for TKFCM (shown in Figure 5(a) & 5(d)) are preprocessed by the steps described by the visual explanation in Figure 4. In Figure 5 (b) & 5(e), the detected brain tumor images marked as the red color those are the outcomes of the previous images by the application of the TKFCM method. Classified brain tumors through linearization of TKFCM are presented in Figure 5 (c) & 5(f). From which the region based features are obtained by the level thresholding, updated membership function, and region properties algorithm.
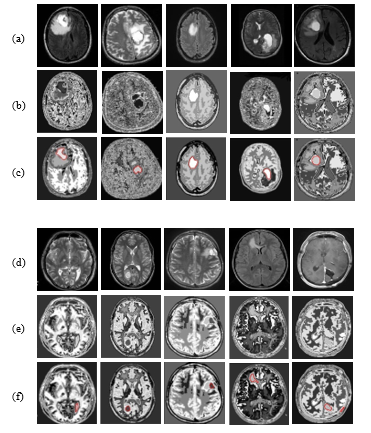 Figure 4: (a) & (d): Filtered images for TKFCM, 4(b & e): Temper based segmented images, 4(c & f): TKFCM based detected tumor images.
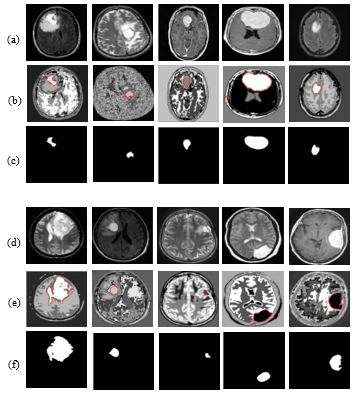 Figure 5: Enhanced Input images for TKFCM in 5(a & d), TKFCM based red marked tumor images in 5(b & e), and classified brain tumor through linearization of TKFCM in 5(c & f).
From the segmented image, two kinds of features are extracted: one is statistical features and other is region property based features. The first kind of statistical features i.e., contrast, correlation, entropy, homogeneity, energy are used to classify whether there is any normal brain or tumorous brain using SVM. Therefore, SVM classifies the images into two categories- tumorous and normal. For this significance, two major kinds of MRI image data of normal and abnormal brain are fed to SVM network and the corresponding results of classification property of the SVM are presented in Figure 6(a). There are 46 images used to classify whether the system classified 37 tumor images, 8 normal images and rest 1 is misclassified. As a result, the accuracy of SVM method is 97.44% which is very convincing to move to the next step c.
According to the previous approach the tumorous brains have to be classified into 5 defined categories. Due to implementing this classifying network, an ANN-based network was designed as the configuration given in Figure 6(b). The network consists of four input vector layers, one hidden layer with 129 neurons, and five output vector layers. The input feature vectors are evaluated as the second kind of features of MRI images which are acknowledged in this article by the region property based features.
The performances of training, validation, and testing of the proposed network are shown in Figure 6(c). The specifications of the achieved performances were 60 iterations with 0.05 increment order. Additionally, the minimum error was considered up to 0.5e-02, the gradient minima were approximately 1e-10, and the maximum validation check failure was taken 6. From the Figure 6(c), it is found that the desired performances are achieved between 8 and 9 iterations which indicate the less required time for the network compared to the 60 iterations. Best validation performance is 0.17479 at iteration 2 mentioned in Figure 6(c).
The second kind of features i.e., area, eccentricity, perimeter, orientation are used to differentiate the tumor and different malignant stages of I to IV. The obtained features are denoted as input vectors of the proposed network. On this contrary, we acknowledged in this article that we have five categories of brain tumor those are I-IV malignant groups along with benign. Therefore, the results are given by the confusion matrix in Figure 6(d) are the output vectors or classified 5 groups. The network achieved 97.3% classifying accuracy given in Figure 6(d). This result is very convincing where it is found that there are 9 benign, 17 malignant I, 6 malignant II, 3 malignant III, and 1 malignant IV stages. The network misclassified 1 tumorous brain MRI images.
In Table 1, there are some feature values for classifying tumor categories as well as detecting exact tumor position in our brain lobe. The region-based features are used as input vector of ANN to classify the malignant and benign tumors. Beside one of the features mentioned as ‘orientation’ of the tumor defines the exact lobe position of the tumor in brain MRI images. These results of orientation by the proposed method provide the information about the position of the tumor either in left or right or center part of the brain.
Since the classification accuracy is not the only performance metric, some other performances of the classifier are necessary to be evaluated. Based on the value of true positive (TP), false positive (FP), true negative (TN), and false negative (FN) of the proposed network, some other performances like sensitivity, specificity, beat error rate (BER) can be calculated. In this step,

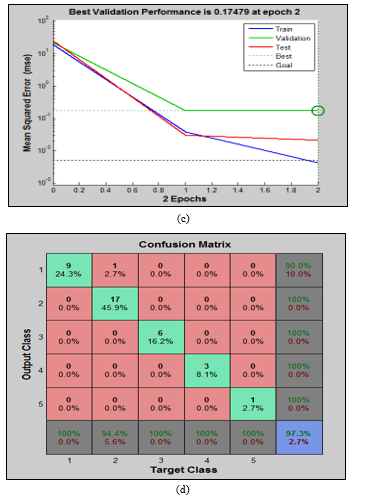 Figure 6: The relevant simulated results of proposed hybridized SVM and ANN algorithm for classifying tumor categories. 6(a): 2D plot of classified normal and tumor brain data for proposed SVM classifier, 6(b): The network architecture of proposed ANN method, 6(c): The performance curves for the proposed ANN method, and 6(d): The confusion matrix for benign and malignant stages I-IV using proposed ANN classifier for second order region based features.
Table 1: Some examples of classified tumor and identification tumor position using ANN approach
| Area in mm2 | Eccentricity in mm | Perimeter in mm | Orientation in degree | Tumor type | Tumor position in lobe |
| 9.9167 | 0.9754 | 60.275424 | -84.1794 | Malignant II | Left |
| 6.472 | 0.9213 | 33.55836 | -100.0502 | Malignant I | Left |
| 8.2561 | 0.8402 | 40.736784 | -54.547 | Malignant I | Left |
| 9.5952 | 0.9414 | 36.863376 | -57.7349 | Malignant I | Left |
| 8.6719 | 0.7084 | 31.913904 | 0.404 | Malignant II | Centered |
| 10.2451 | 0.6974 | 41.258448 | -32.196 | Malignant II | Left |
| 21.5625 | 0.793 | 82.645728 | 0.6467 | Malignant III | Centered |
| 9.7787 | 0.6381 | 37.249872 | -88.0731 | Malignant II | Left |
| 8.1541 | 0.8617 | 32.143056 | 69.189 | Malignant I | Right |
| 7.0295 | 0.7793 | 25.955424 | 14.0189 | Malignant I | Right |
| 7.9814 | 0.9886 | 18.599592 | 85.0421 | Malignant I | Right |
| 22.4633 | 0.6164 | 135.3689 | 60.2044 | Malignant III | Right |
| 8.0379 | 0.4214 | 28.77864 | -59.6895 | Malignant II | Left |
| 8.7599 | 0.8547 | 36.848064 | 1.3184 | Malignant I | Right |
| 24.4937 | 0.8675 | 135.78576 | -77.2517 | Malignant III | Left |
| 7.7914 | 0.7926 | 36.24984 | -49.5862 | Malignant I | Left |
| 13.3835 | 0.8289 | 49.570752 | 12.2018 | Malignant I | Right |
| 15.8158 | 0.8813 | 75.392592 | 44.3799 | Malignant II | Right |
| 11.0597 | 0.625 | 89.080464 | -55.4867 | Malignant II | Left |
| 36.9817 | 0.4032 | 141.77 | -82.9364 | Malignant IV | Left |
| 15.7074 | 0.671 | 58.995552 | 89.6919 | Malignant III | Right |
| 12.3489 | 0.8206 | 58.698816 | -82.3899 | Malignant II | Left |
Table 2: Comparison between proposed algorithm and conventional methods
| Algorithms | Sensitivity (%) | Specificity (%) | Accuracy (%) | BER | Computational Time |
| Thresholding | 85 | 80 | 81.3 | 0.175 | ~3 min |
| Region Growing | 88.46 | 75 | 86.47 | 0.182 | ~6 min |
| ANN | 95.42 | 100 | 95.07 | 0.022 | ~8 min |
| FCM | 86.95 | 85.7 | 86.4 | 0.136 | ~5 min |
| SVM | 96.2 | 66.67 | 90.44 | 0.0234 | ~4 min |
| K-means | 75 | 92.85 | 83.7 | 0.160 | ~160-170 sec |
| TKFCM | 88.9 | 100 | 91.89 | 0.055 | ~100 sec |
| Fuzzy Logic Method | 96.3 | 100 | 96.667 | 0.018 | ~ 120 sec |
| Proposed SVM+ANN Method | 98 | 100 | 97.37 | 0.0294 | ~ 2 min |
*Image size=256×256, Software=MATLAB2014a, Processor= Core2duo, RAM=2GB, windows=7
these important estimations are performed by the following relations (16)-(19) and used for comparison purposed with other conventional methods [19].
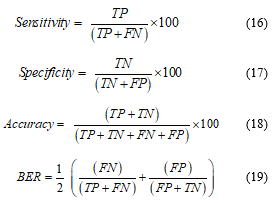 Comparisons of the proposed method with predictable techniques whose algorithms are coded to cope up with the same dataset are mentioned in Table 2. In this proposed technique, 37 brain tumor images are taken for the simulation. The sensitivity of 98%, specificity of 100%, the accuracy of 97.37%, and BER 0.0294, which are obtained by combining ANN and SVM. The results show that the proposed method is better than the conventional methods like thresholding, region growing, SVM, ANN, FCM, TKFCM, and K-means. The proposed algorithm that is actually combinations of several suitable techniques proves more effective than any other single method. Though the conventional ANN comprehends the value of accuracy of 95.07%, the computational time is so high. But the proposed technique shows less computational time with better accuracy than conventional ANN. So, it can be useful for both detecting tumors and be classifying tumor stages of brain MRI images for experts.
5. Conclusion
This work classified the images as normal and tumorous. In addition, the size of the tumor and its position in brain lobe were also identified by the proposed method from MRI image. To implement such an efficient and intelligent algorithm, a number of statistical and machine learning based algorithms like temper based K-means and modified Fuzzy c-means clustering, SVM, and ANN are combined. As a result, it is found that the previous limitations like less classifying accuracy, computational time requirement, unsatisfactory of BER, sensitivity, and specificity of conventional ideas has been overcome by this proposed algorithm. Other existing methods have some tradeoff among the performances. This method provides sensitivity 98%, specificity 100%, classifying accuracy 97.37%, BER=0.0294, and required less than 2 minutes to give the result. These results are too convincing to identify the brain tumor and its size, as well. In addition, this algorithm has provided the tumor position accurately. Considering all the performances, it can be concluded that the proposed algorithm is better than others like region growing, thresholding, and FCM compared to every parameter. On the other hand, in point of accuracy and computational time the proposed method is better than ANN, SVM, and TKFCM. Eventually, we hope that this method can be very helpful for diagnosis of brain tumor.
Conflict of Interest
So far the knowledge, the authors declare no conflict of interest regarding this article.
Acknowledgment
Authors would like to thank Prof. Dr. Md. Abdur Rafiq, Dean, Faculty of Electrical and Electronic Engineering, Khulna University of Engineering & Technology (KUET), Khulna, Bangladesh, for his beautiful lectures on neural network- fuzzy logic and guidelines to implement it in this research work.
- Ahmmed, A. S. Swakshar, M. F. Hossain, and M. A. Rafiq, “Classification of tumors and it stages in brain MRI using support vector machine and artificial neural network,” International Conference on Electrical, Computer and Communication Engineering (ECCE-2017), 229-234, February 16-18, Cox’s Bazar, Bangladesh. http://doi.org/ 10.1109/ECACE.2017.7912909.
- Rana, H. S. Bhadauria, and A. Singh, “Study of various methods for brain tumor segmentation from MRI images,” International Journal of Emerging Technology and Advanced Engineering, 3(2), 338-342, 2013.
- Joshi and A. Padhke, “Feature Extraction and Texture Classification in MRI,” International Journal of Computer & Communication Technology (IJCCT), 2, 130-136, 2010.
- Ahirwar, “Study of techniques used for medical image segmentation and computation of statistical test for region classification of brain MRI,” International Journal on Information Technology and Computer Science, 5, 44-53, April 2013. doi:10.5815/ijitcs.2013.05.06
- E. Kaya, A. Ç. Pehlivanli, E. G. Sekizkardes and T. Ibrikci, “PCA based clustering for brain tumor segmentation of T1W MRI Images” Computer Methods and Program in Biomedicines in Elsivier, 140, 19-28, March, 2017. http://doi.org/ 10.1016/j.cmpb.2016.11.011
- L. Pham, C. Xu, and J. L. Prince, “Current methods in medical image segmentation,” Annual review on Biomedical Engineering, 2, 315-337, 2000.
- Narkbuakaew, H. Nagahashi, K. Aoki, and Y. Kubota, “Integration of modified K-means clustering and morphological operations for multi-organ segmentation in CT liver-images,” Recent Advances in Biomedical & Chemical Engineering and Materials Science, 34-39, March 2014.
- Deng, “A generalized unsharp masking algorithm,” IEEE Transactions on Image Processing, 20(5), 1249-1261, May 2011. http://doi.org/ 10.1109/TIP.2010.2092441
- R. Kannana, S. Ramathilagam, R. Devi, and E. Hines, “Strong fuzzy c-means in medical image data analysis,” Journal of Systems and Software, 85, 2425–2438, December 2011. http://doi.org/10.1155/2013/972970
- Harati, R. Khayati, and A. R. Farzan, “Fully automated tumor segmentation based on improved fuzzy connectedness algorithm in brain MR images,” Computers in Biology and Medicine, 41, 483–492, April 2011. http://doi.org/10.1186/s12938-016-0165-2
- R. Shally, and K. Chitharanjan, “Tumor volume calculation of brain from MRI slices,” International Journal of Computer Science & Engineering Technology (IJCSET), 4(8), 1126-1132, 2013.
- Descombes, F. Kruggel, G. Wollny, and H. J. Gertz, “An object-based approach for detecting small brain lesions: Application to Virchow-robin spaces,” IEEE Transaction on Medical Imaging, 23(2), 246–255, 2004. http://doi.org/10.1109/TMI.2003.823061
- C. Bezdek, R. Ehrlich, and W. Full, “FCM: The fuzzy c-means clustering amgorithm,” Computer & Geosciences, 10(2-3), 191-203, 1984. https://doi.org/10.1016/0098-3004(84)90020-7
- Gong, Y. Liang, J. Shi, W. Ma and J. Ma, “Fuzzy c-means clustering with local information and kernel metric for image segmentation,” IEEE Transactions On Image Processing, 22(2), 573-584, February 2013. http://doi.org/10.1109/TIP.2012.2219547
- (2017) PE- Brain tumor website. [Online]. Available: http:// www.mayfieldclinic.com /
- University of Maryland Medical Center (2017) homepage. Primary brain tumor [Online]. Available: http://umm.edu/health/medical/reports/articles/brain-tumors-primary
- Oncology (2017) homepage. Tumor type [Online]. Available: http://www.oncolink.org/types/article.cfm?c=52&aid=247&id=9534
- Lugina, N. D. Retno, and R. Rita, “Brain tumor detection and classification in magnetic resonance imaging (MRI) using region growing, fuzzy symmetric measure, and artificial neural network back propagation”, International Journal on ICT, 1, 20-28, December 2015.
- Selvakumar, A. Lakshmi, and T. Arivoli, “Brain tumor segmentation and its area calculation in brain MR images using K-mean clustering and fuzzy c-mean algorithm,” International Conference on Advances in Engineering, Science and Management, Tamil Nadu, 186-190, 2012.