Security Analysis and the Contribution of UPFC for Improving Voltage Stability

Adv. Sci. Technol. Eng. Syst. J. 3(1), 404–411 (2018);
 DOI: 10.25046/aj030149
The occurrence of many failures in the power system can lead to power instability and affects the system parameters to go beyond its operating limits. It may lead to obstructing the secure operations and reliability of power systems. Ensuring power system security needs proper actions to be taken for the undesirable contingency. Thus, security analysis is important tasks in modern energy management systems. This paper proposes an approach based on the Newton Raphson power flow method for power system security analysis. Firstly, the contingencies will be specified to assess their impact on the transient stability. Secondly, the selected contingencies will be classified in the order of severity. In addition, the integration of the Unified Power Flow Controller (UPFC) to enhance the transient stability of the power system is considered. The proposed method is implemented on the IEEE-14 bus system. We performed this case study using the well-known software EUROSTAG.
1. Introduction
Security analysis of a power system plays a significant role in the growth and development of modern societies. Given that the power system is a large-dimension complex system, it might be the site of various disturbances, making its chaotic behavior and difficult to control [1]. Thus, ensuring the security of the electric network becomes an essential task for operators and researchers.
Following a violent disturbance enormous damage may occur in the power system and impacts directly its normal operation. We can note that the concept of network security is broader than the stability of networks [2]. It is defined as the ability of power system to maintain its stable operation after each disturbance or unfavorable change of the system [3]. However, the level of security is deemed satisfactory if, firstly, it is able to ensure the production-consumption balance within certain acceptable limits related to line’s power flows, voltage in each node and operating points of generation units and if, on the other hand, it is able to persist in a more or less violent disturbance.
Therefore, the system operator must ensure that the power system operates at a secure operating point where all equipment is within their safe limits. If the failure is not controlled suitably, this could lead to a disastrous event such as major blackouts and impact then the economic and environmental requirements [4].
The advent of FACTS devices has been a boon to the power industry. These devices provide fast and effective control of the various parameters of the power system to improve their stability and preventing other related cascade accidents [5-9]. The UPFC is one of the most versatile FACTS devices, providing independent control of the voltage, real and reactive power of the transmission under its supervision. This device enhances the power system security.
- Hashim et al. [10] have presented an analysis of transient stability of IEEE 14 bus test system. They studied the effect of the fault location on system stability; and they analyzed the characteristics of the machine states including speed, rotor angle, output electrical power and the terminal voltage of the machine after a three-phase short-circuit which occurs at different points of the system. The IEEE-14 bus system has been also studied in [11], wherein both authors have studied the effect of fault location and critical clearing time on the system stability. In order to achieve this, they analyzed the behavior of the synchronous machine, in particular, the angular position of the rotor. They proposed to rapidly isolate the faulted part to increase stability margin.
- Zerigui [12] provided a solution to the problem of transient stability. To test a constrained optimal power flow, and estimate critical clearing time she developed a new analytical function. She applied her strategy to test large networks up to 145 buses. While in [13] the authors just used nine-bus IEEE system to confirm their proposed method. They presented a global approach to transient stability constraint optimal power flow based on SIME model. Likewise, authors in [14] analyzed the transient stability for IEEE- 9 bus test system. Then, they proposed a simple control method based on the equal area criterion for calculating critical clearing time. To improve the stability margin, the temporal evolution of the frequency and voltage, with and without load shedding, is performed.
For three decades, J-C Chow et al [15] have formulated the contingency classification problem into a pattern recognition problem and then design a Hopfield model to detect a prescribed set of patterns. This optimization method, which uses the linear programming technique, considers only the steady-state security assessment problem.
In order to explain the contribution in deepening understanding of the power system security problem, the authors in [16], proposed an efficient steady-state contingency classification methodology based on Rough Set Theory. Through this analysis, they could classify the system operating in four different states.
Abdulrazzaq, A. [17] used the Newton Raphson load flow method for the power system contingency ranking only for the line outage.
In most cases, the researchers deal with the security analysis in the steady case, considering the execution time of computational simulations performed. The main purposes of security analysis are the fast identification of critical contingencies and their evaluation related to the severity level [18-20].
This paper is an extension of work originally published in the Proceedings of the International Conference on Sciences of Electronics, Technologies of Information and Telecommunications [21].
This paper focuses on the contingency analysis that comprises three steps. Firstly, we create the contingencies list containing all sets of possible contingencies that may occur in a power system. Secondly, the classification of severe contingencies from the list that may lead to the supply and security constraints violations is achieved. Lastly, the evaluation of contingencies is necessary. In addition, a curative action using UPFC devices to avoid the effects of most severe contingencies is proposed. To verify our proposed approach, we perform simulations on an IEEE 14-bus power system.
2. Analysis of Electrical Networks security
The security analysis of an electrical network is related to its dynamic state or steady state following the disturbance. In dynamic security analysis, the transition from the existing operating condition for the new operating conditions and the fact that during the transient state should not be cascading outages are considerations of interest. The dynamic security analysis is normally done in a deterministic approach using analytical tools such as load flow calculation, dynamic simulation, etc. Indeed, these tools use a detailed model of the electrical system to determine the system dynamic response with respect to each of the analyzed contingencies. Analysis methods of the dynamic security of electrical networks are classified into four groups: methods based on numerical simulation, pattern recognition methods, direct methods and hybrid methods [22-25]. In this paper, we propose heuristic method because it is easier to set up and it gives quick and good solutions to difficult problems.
2.1. Operating States of a Power System
In security analysis, power system may operate in different states, namely normal, emergency, alert, extreme state and restorative [26, 27]. A system is said to be in normal operating state when it satisfies equality and inequality sets of constraints. This is equivalent to the fact that there is no overloaded equipment and all the variables of the system are within the normal operating limits [28, 29]. Following every single contingency the system must be able to operate in a secure way while respecting all the constraints. However, if the contingency is highly dangerous or the system generation drops below the required amount, the system operation may be insecure indicating an alert state. In this case, the equality and inequality constraints are still satisfied nevertheless; preventive action is needed to restore the normal state. In case of preventive control failure, the system security level may be under the permissible limit. Therefore, the inequality constraints are no longer maintained and the system enters in an emergency state. It is to be mentioned that in case of a sufficiently serious contingency, the system transits directly to the extremis state.
To overcome the emergency state, control measures should be initiated immediately. If these actions are not efficient or are not taken at the adequate time, the state of the system is said in extremis. This state is characterized by violated equality and inequality constraints which may cause the loss of some parts of the system or a total system blackout. Otherwise, the rapid and efficient application of control actions brings the system to the restorative state. In that instance, the implementation of other control measures may lead the system either to the normal state or the alert state.
2.2. UPFC device
UPFC (Unified Power Flow Controller) is the most powerful and versatile device. It can control three parameters either individually or in appropriate combinations at its series connected output while maintaining reactive power support at its shunt connected input device. Therefore, the aim of UPFC is to enhance the usable transmission capacity of lines and control the power flow [30-35].
The model of UPFC implemented in a transmission line is shown in Figure 1. A series converter connects with the line through an insertion transformer. A shunt converter connects with the line through a second transformer. The DC terminals of the two converters are linked together, and their common DC voltage is supported by a capacitor bank. A mathematical model of the UPFC is well-detailed in Reference [36].
3. Mathematical Model of power system
In order to analyze, simulate, design and control the electric power system operation, steady-state and dynamic system performances properly are explained.
3.1. Description of system
In general, a power system can be modeled by the following set of nonlinear differential-algebraic equations:
Where x is a vector of state variables, y is a vector of network variables, and λ represent the control and parameter variable which may be used to control or tune power system performance.
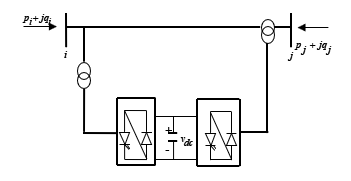 Figure 1. UPFC model.
The differential equation F represents governing dynamics of power systems, which is associated with generators, excitation systems, and speed governor. The differential variables x consist of the states of dynamic components such as rotor angles and rotor speed.
![]() The algebraic equation g represents the network power balance of power systems. The algebraic states y includes bus voltages and bus phase angles. It is also known as control variables.
The algebraic equation g represents the network power balance of power systems. The algebraic states y includes bus voltages and bus phase angles. It is also known as control variables.
![]() The active and reactive powers injected at any bus are given by Equation (4). Therefore, it is a function of voltage magnitudes and angles for all the buses, as well as the admittance, magnitude, and angle, for the transmission network.
The active and reactive powers injected at any bus are given by Equation (4). Therefore, it is a function of voltage magnitudes and angles for all the buses, as well as the admittance, magnitude, and angle, for the transmission network.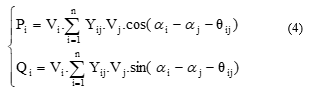
Where Yij,θij are, respectively, the admittance magnitude and angle for the transmission line i-j, Vi, Vj are the voltages at bus i and j, αi, αj are the voltages angles, and n is the number of studied network buses.
The active and reactive power functions are evaluated by this load flow equations: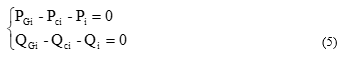
Pci, Qci, PGi and QGi are respectively active and reactive power consumed and produced for bus i.
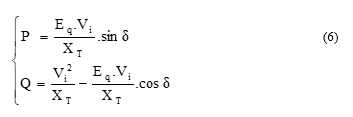
Equations (6) give the output active and reactive power. These equations show that P and Q are functions of the bus voltages and rotor angle. XT and Eq represent respectively transfer reactance between buses and internal voltage of the generator.
3.2. Model of Machine
The generator model is represented by the four-order model as follows:
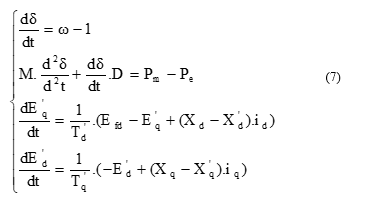 δ is the rotor angle of the machine, ω is the rotor speed, M is an inertia coefficient of machine, D represents the damping coefficient of machine, Pm, Pe are the mechanical and electrical power of the machine, E’d, E’q are the voltage behind the direct and quadrature axis transient reactance Xd’, Xq’ respectively, T’d0 is the d-axis open circuit transient time constant, T’q0 is the q-axis open circuit transient time constant, and Efd represents a field voltage.
3.3. Security Contraints
The security constraints are based on the operating limits which have to be satisfied for normal operation of the power system. In order to operate the system within an acceptable security domain, the basic security constraints are as follows:
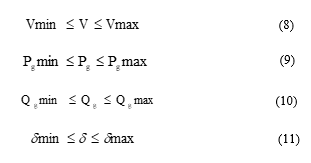
Considering the fact that the electrical network operates under two main types of constraints; constrained supply (C1) of energy (C2) which imposes that all consumers must be supplied and operations constraints require that the system variables should be within specified operating limits.
4. Proposed Method
During a normal operating state, all constraints are satisfied. It is characterized by a sufficient level of stability margins so that the system can withstand a single contingency. When the system satisfies all the supply and security constraints without reserve power generation, it passes in an alert state. This means that in the event of a contingency, at least one inequality constraint will be violated. Therefore, preventive actions have to be taken to bring the system to a secure state. The power system enters an emergency state from an alert state when a contingency occurs. In this case, all the equality constraints are satisfied and at least one inequality constraint is violated. Consequently, the system requires an immediate implementation of corrective actions to prevent the damage of equipment. However, once the severity of the disturbance is very high, both equality and inequality constraints are violated. Thus, the system passes in an extreme state.
In this paper, we consider the time taken by the system to transit from a secure state into another one where is not secure as an index for ranking serious contingencies. Therefore, the contingency is deemed severe when both constraints of the network are not satisfied and, it is potentially harmful if only the constraints of system operation are not satisfied. In the case of both constraints are respected, the contingency is recognized as being harmless.
To achieve this aim, a fast strategy is proposed to identify power system dynamic behavior using the time domain simulation method. A corrective control to restore power system operating equilibrium after disturbances has been also proposed. This strategy is based on a deterministic approach using analytical tools such as load flow calculation and dynamic simulation. Newton-Raphson method is used to solve load flow problem. In this method, optimal solution can be obtained using iterative method. It usually converges faster than other methods. Then, the identification of properties by the best solutions and introduce them as boundaries of the problem are mainly fulfilled. Firstly, the assessment of different operating state according to a set of selected contingencies is required. Then, security assessment is based primarily on steady-state load flow analysis and transient analysis of the power system. The based approach gives priority to the most severe cases for thorough analysis, and the stable cases are previously eliminated from the list.
Figure 2 depicts the flowchart of the proposed method.
5. Simulation
- Case Study
Figure 3 shows the single line diagram of IEEE 14-bus system. It consists of five synchronous machines. There are eleven loads in the system. Three step-up transformers, one of which is three winding transformer. The generators are modeled as an ideal voltage source behind the synchronous reactance of the machines. The model of transmission lines considers the resistance and the reactance. The loads are modeled as constant impedance. The all data for simulation were selected from [37]. We performed all simulations using software package EUROSTAG [38]. This software is a powerful tool dedicated to dynamic simulations. Its major advantage is the high rapidity of its algorithm.
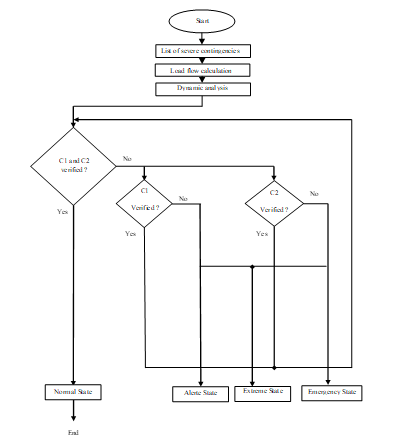 Figure 2. Flow chart of proposed method.
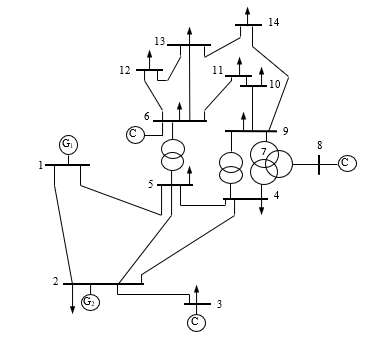 Figure 3. Single line diagram of IEEE 14-bus system.
5.2. Contingency Classification Method
Contingency analysis should be performed for the unexpected and severe events that may occur in power system. Table 1 presents the contingencies list containing the contingencies that may occur in a power system. For the contingencies classification, we considered two criteria; maintaining the network characteristics in their acceptable ranges, and ensuring a balance between production and consumption. A contingency is deemed very dangerous when both constraints of the network are not satisfied, which corresponds to an extreme state. It is potentially dangerous if only the constraints of system operation are not satisfied; the network is in an emergency state. Whenever the system goes to alert state under severe contingency; is that the constraint of energy supply is not fully respected. If both constraints are respected the contingency is recognized as being harmless; as a result, the network is stable. Thus, this contingency is ineffective on the loss of system and it can be rejected.
Table 1. Contingency Index.
| Contingency | Index |
| Bolted fault | I |
| Impedant fault | II |
| Increase of load by 10% | III |
| loss of generator G1 | IV |
| loss of generator G2 | V |
| Opening of line 8-7 | VI |
| Opening of line 2-3 | VII
|
5.3. Simulations Results
At time 250s, we simulated different types of fault and we followed the temporal transition of the system. Table 2 defines the emergency state, alert and the extreme state of network study. We can notice that the range of stability is different for each type of fault. Loss of generator G1 remains the scariest of all faults on network stability. In order to have reasonable accuracy in the classification of contingencies, the detailed assessment of the contingencies is necessary. The aim is to detect the worst case for the transient stability of the test system. Thus, we tested the impact of line opening, loss of power generator, and the severity of three-phase short-circuits.
5.3.1 Line opening scenario
We should first look at how the line opening affects the transient stability of the system. To achieve that, we propose the tripping of lines one by one. All system parameters (frequency, voltages at different buses, rotor angle of the two machines) must be within the allowable range to predict the security of the system.
Therefore, all security practice is followed. For the opening of line 1-5, the behavior of the two machines is different; G1 accelerates while the machine G2 decelerates. Both machines accelerate, in case VII and oscillations are much less than line 1-5. In the case of opening the line 9-14, a voltage drop at bus 14 passes from 0.971pu to 0.928pu, oscillations amplitude of the rotor angle is important. With the opening of line 8-7, we note a separation of the network in two sub-networks; the first sub-network includes the machines G1, G2, G3, and G6. The second involves only the machine G8. Following this fault, a drop in voltage appears at the terminals of all the consumer nodes and an increase of 2.5% of the voltage at bus 8 with a slight oscillation of voltages.
Table 2. Operating modes of the test system
| State | Alert State
|
Emergency state
|
Extreme State
|
| I | [250.1 250.4] | ] 250.4 250.413] | ]250.413 250.414] |
| II | [251.5 252] | ] 252 253] | ] 253 255] |
| III | – | – | – |
| IV | ] 250.07 250.114] | ] 250.114 250.13] | ] 250.13 250.15] |
| V | ] 250.9 251.5] | ] 251.5 257] | ] 257 260] |
| VI | – | – | – |
| VII | – | – | – |
We note that the variation in the speed and power of the two generators have a damped oscillatory regime. Then we can say that the system is stable under these conditions because generator speed and hence rotor angle regain their stability after few highly damped oscillations. In conclusion, the opening of a single line does not disrupt the stability of the network; this contingency may be classified as non-dangerous.
5.3.2 Loss of machine scenario
In order to study which of two machines is critical, we simulated separately, the case of the loss of machine G1 and G2 and followed the transient behavior of the system. As shown in Table 3, in the first case, the two machines are unstable, and the system exhibits a total voltage collapse. While in the second case, only machine G2 becomes unstable, and we note the oscillations of the rotor angle and acceptable electrical power. There are thus among the two machines disturbed during the fault, a machine that is more stable than the other after the elimination of fault. This is confirmed by the necessary critical clearing time that leads to instability. The critical clearing time must be equal to 0.114s for that the machine G2 becomes unstable, while the machine G1 maintains its stability during the definitive loss of G2. The machine G1 does undergo smaller oscillations than the machine G2 in the post-fault configuration. Due to its high nominal power, and that it is chosen as the reference generator. We confirm that machine G1 is critical.
5.3.3 Impact of location of the short-circuit
We will now proceed to study the impact of location of the fault on security margin of the network. A bolted three-phase fault was applied respectively to the nodes 2, 6, 5 and 14 at time t = 250s. The time duration of this fault is 100ms. The choice of nodes is relevant, bus 2 is producer node, a compensator is connected to bus 6, and bus 5 is a consumer node that is linked to two producer nodes and bus 14 is a weak node. Table 4 summarizes all the results of simulations. We noticed that during a fault at bus 2, the system puts only 0.413s to pass in an extreme state, bus 6 take 5.3s, the bus 5 puts 1.05s and bus 14 passes to an extreme state after 1s.
Let us note that transient system behavior is associated with large oscillations of both machines outputs. Therefore, a short circuit applied at bus 2 and bus 14 impacts greatly the stability of the network. These fault types are therefore classified as a dangerous contingency.
Table 3. State of both machine G1 and G2
Parameters |
Loss of G1 |
State of G2 |
Loss of G2 |
State of G1 |
f(Hz) |
40 |
unstable |
49.84 |
Stable |
δ1 (deg) |
diverge |
15.94 |
||
δ2 (deg) |
50 |
diverge |
Table 4. Variation of Fault Location
| Bus | Alert state
|
Emergency State | Extreme State
|
| 2 | ] 250.1 250.4] | ] 250.4 250.413] | ] 250.413 250.414] |
| 6 | ] 250.1 253.7] | ] 253.7 255. 3] | ] 255.3 260] |
| 5 | ] 250.1 250.8] | ] 250.8 251.05] | ] 251.05 251.1] |
| 14 | ] 250.1 250.8] | ] 250.8 251] | ] 251 251.3] |
5.3.4 Load increase
Similarly, we have performed simulations of load variation from 5% to 100%. Table 5 illustrates the stability intervals for three states of the system. We notice that the system satisfies both constraints energy supply and operating for 40% load increase on the system. On the other hand, from 70% the system loses the balance between production and consumption. For a 100% increase in load, the system is subject to voltage collapse. This is explained by the fact that the machine G1, during normal operation, generates only 233MVA (47%) while its nominal capacity is 615MVA. Thus, we note that the machine G1 has reserves to provide the required active power, but obviously, can only satisfy a large load variation.
It is noteworthy that in a multi-machine network, stability for the frequency range is ± 0.4Hz, the critical load of the system is thus 40%. Then, we can indicate that the system is highly vulnerable to voltage collapse in the event of heavy load increase. Furthermore, if we bear in mind that when transition time is small in an emergency or extreme state, this contingency is more severe and requires the treatment.
Numbered contingencies III, V, and VII pose no risk because the network remains stable. As against the others should be analyzed as they can cause loss of synchronism of system. Potentially dangerous contingencies are maintained in a waiting list because some of them can be harmful. Whereas the dangerous contingencies, I, II and IV must be treated. Figure 4 shows the impact of an increase of load on frequency value and rotor angle of the two machines.
Table 5. Stability Margin Depending on Load Increasing
State |
Alert State |
Emergency state |
Extreme State |
Stability margin |
] 5 40] |
] 40 70] |
] 70 100] |
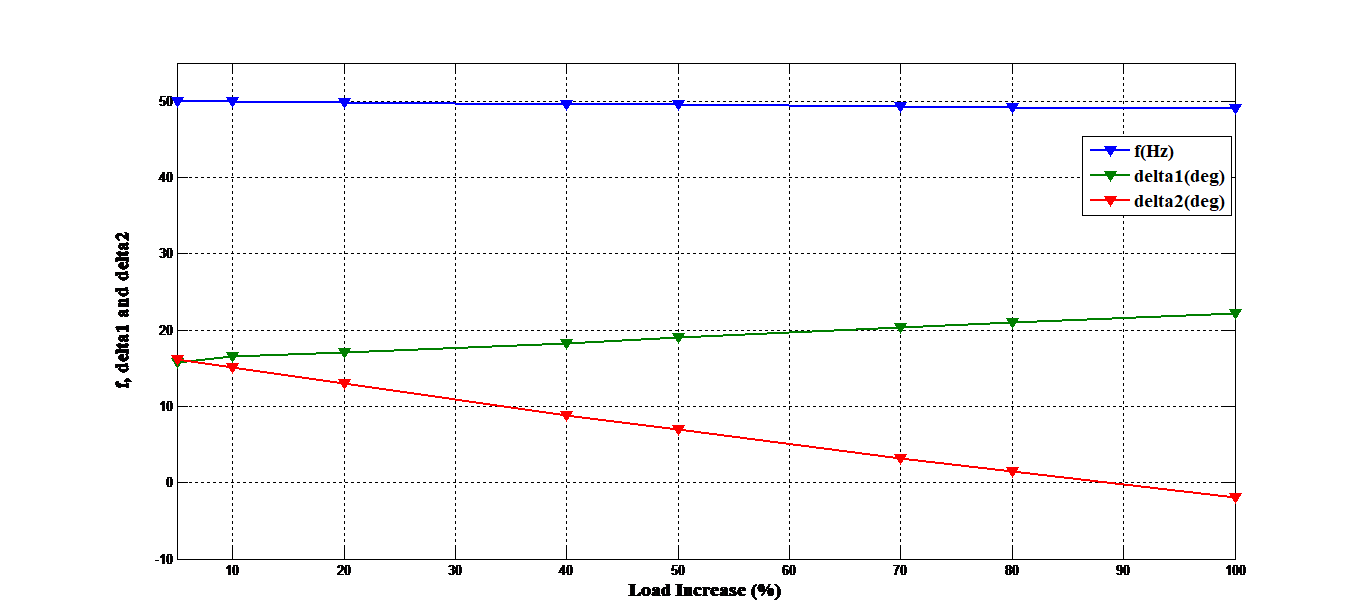 Figure 4. Impact of an increase of load on frequency value and rotor angle of the two machines.
- Contribution of UPFC on the voltage stability
The enhancement of voltage stability of the test system using the UPFC is studied. We connect UPFC to the system at different locations. Power dimension of UPFC is ± 200 MVAR. Two scenarios are performed. At first, we consider a total load increase of 40%. Then, a three-phase fault is applied at bus 14. The fault duration is 100ms.
The UPFC was integrated in the middle of line 2-3. Then, it is connected in the middle of line 1-2. Lastly, the UPFC is integrated in the middle of line 9-14.
Table 6 shows the voltage level of all bus under load increase of 40%. Regardless of its location, the UPFC improve almost the voltage level of all bus.
Figure 5 shows the effect of the UPFC on the behavior of voltage at bus 9 and bus 2 with and without the UPFC. The addition of the UPFC has remarkably improved the behavior of voltage.
Here, we consider a bolted three-phase fault at bus 14. The fault duration is 100ms.
Figure 6 and Figure 7 respectively illustrate the temporal evolution of voltages at bus 2 and bus 9 with and without the UPFC.
It should be noted that a short circuit at bus 14 causes a voltage drop which reaches its minimum beyond a certain threshold value and regains its initial value after highly damped oscillations in the presence of the UPFC. Therefore, the UPFC provides the best control of voltage and a good damping of oscillations.
Table 6. Load Increase of 40%
| Sans FACTS | UPFC in line 2-3 | UPFC in line 1-2 | UPFC in line 9-14 | |
| BUS1 | 1.060 | 1.060 | 1.060 | 1.060 |
| BUS2 | 1.040 | 1.040 | 1.040 | 1.044 |
| BUS3 | 1.003 | 0.985 | 1.003 | 1.004 |
| BUS4 | 1.014 | 0.992 | 1.013 | 1.017 |
| BUS5 | 1.022 | 1.003 | 1.022 | 1.026 |
| BUS6 | 0.996 | 0.982 | 0.996 | 1.014 |
| BUS7 | 1.011 | 0.992 | 1.011 | 1.011 |
| BUS8 | 1.082 | 1.067 | 1.082 | 1.018 |
| BUS9 | 0.978 | 0.959 | 0.978 | 1.085 |
| BUS10 | 0.972 | 0.954 | 0.972 | 0.972 |
| BUS11 | 0.980 | 0.963 | 0.980 | 0.980 |
| BUS12 | 0.977 | 0.962 | 0.977 | 0.977 |
| BUS13 | 0.971 | 0.956 | 0.971 | 0.971 |
| BUS14 | 0.952 | 0.935 | 0.952 | 0.952 |
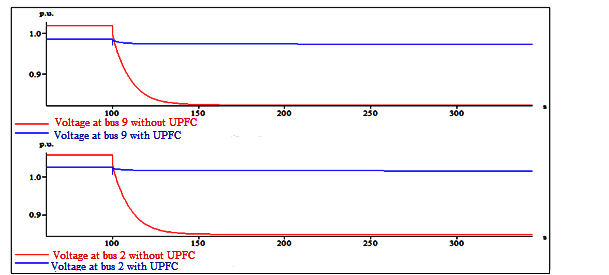 Figure 5 Voltage magnitudes at bus 9 and bus 2 with and without the UPFC.
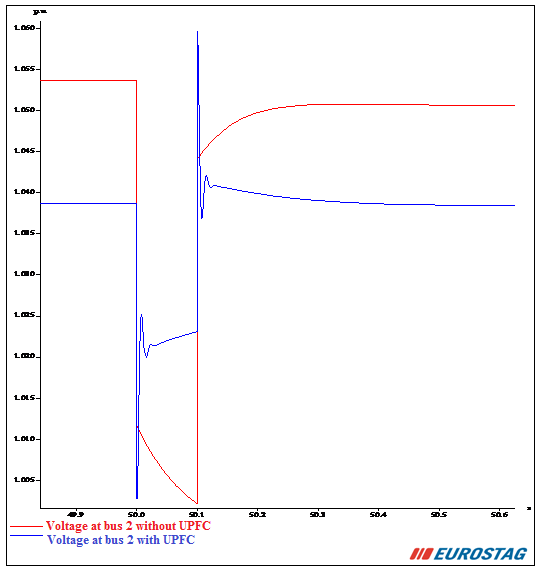 Figure 6 Voltage magnitudes at bus 2 with and without the UPFC.
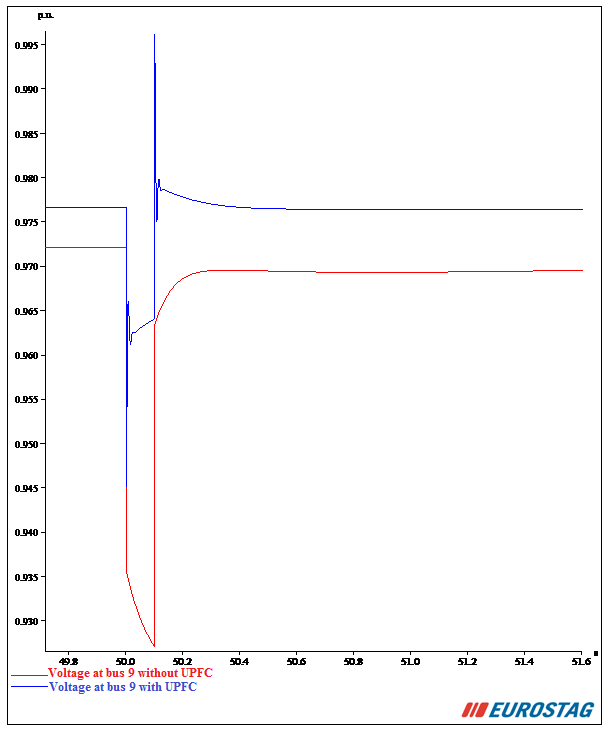 Figure 7 Voltage magnitudes at bus 9 with and without the UPFC.
6. Conclusions
This paper presented a classification of contingencies as well as curative action against faults affecting the voltage stability of the system. Extensive studies of the behavior of IEEE 14-bus system for different contingency cases revealed that is subject to instabilities under well-defined fault conditions. We have demonstrated through this paper that power system suffered from severe contingencies leading to their instability. Thus, we investigated effective methods to improve the stability of power network. A comprehensive analysis of the network security testing has allowed us to classify contingencies in an increasing order of severity. Some of these contingencies may cause serious instability on the network, and others may not be critical. As a result, it is necessary to focus attention on a limited number of contingencies and seek remedial action through UPFC device, which has a role to reduce the possibility of voltage collapse and limit damage of fault, as overloads and short -circuit. Therefore, the UPFC was most effective in improving voltage stability and reducing the harmful effects of dangerous contingencies.
Conflict of Interest
The authors declare no conflict of interest.
- Alcheikh-Hamoud, “Modeling of large interconnected power systems: application to the safety analysis in a competitive environment,” Phd. Engineering Sciences. Institut National Polytechnique de Grenoble – INPG, 2010.
- r. Gongada ,T.S. Rao, P.Mallikarjuna rao, S. Salima, “Power System Contingency Ranking using Fast Decoupled Load Flow Method,” International Conference on Electrical, Electronics, and Optimization Techniques, 2016.
- Ciapessoni, D.Cirio, S.Massucco, A.Morini, A.Pitto and F.Silvestro, “Risk-Based Dynamic Security Assessment for Power System Operation and Operational planning,”, MDPI journal , Energies, 2017.
- Burada, D. Joshi, and K.D. Mistry, “Contingency Analysis of Power System by using Voltage and Active Power Performance Index,” 1st IEEE International Conference on Power Electronics, Intelligent Control and Energy Systems, 2016.
- Abido, M. A., “Power system stability enhancement using FACTS controllers: A review,” The Arabian journal for science and engineering, 34(1B),153-172,2009.
- Meddeb, H. Jmii, S. Chebbi, “UPFC and SVC Devices for Transient Stability Enhancement,”4th International Conference on Automation, Control Engineering and Computer Science (ACECS) Proceedings of Engineering and Technology – PET, pp.82-87, Vol.19, 2017.
- Benaissa, S. Hadjeri, S.A. Zidi, “Impact of PSS and SVC on the Power System Transient Stability,” Advances in Science, Technology and Engineering Systems Journal, pp. 562-568, Vol. 2, No. 3, 2017.
- Y. Lee, M. Farsangi, and H.Nezamabadi-pour, “Hybrid of Analytical and Heuristic Techniques for FACTS Devices in Transmission Systems,” Power Engineering Society General Meeting, IEEE, 2007.
- Dubey, S.Dixit, and G.Agnihotri, “Optimal Placement of Shunt FACTS Devices Using Heuristic Optimization Techniques: An Overview,” International Conference on Communication Systems and Network Technologies, 2014.
- Hashim N. Hamzah, M.F. Abdul Latip and A.A. Sallehhudin, “Transient stability analysis of the IEEE 14-Bus test system using dynamic computation for power systems (DCPS),” Third International Conference on Intelligent Systems Modelling and Simulation 2012.
- K. Iyambo, and R. Tzoneva, “Transient Stability Analysis of the IEEE 14-Bus Electric Power System,” Africon conference, IEEE, 2007.
- Zerigui, “Optimal distribution of electricity production with transient stability constraint established by a statistical approach,” Phd. thesis,Univ. Québec, Feb 2015.
- Tu, L.A. Dessaint, and I. Kamwa, “A global approach to transient stability constrained optimal power flow using a machine detailed model,” Can. J. Elect. Comput. Eng., Vol. 36, No. 1, Winter 2013.
- Kamdar, M.Kumar and G.Agnihortri, “Transient stability analysis and enhancement of IEEE-9bus system,” Electrical & Computer Engineering: An International Journal (ECIJ) Volume 3, Number 2, June 2014.
- C .Chow, R. Fischl, M. Kam, H.H. Yan and S. Ricciardi, “An Improved Hopfield Model for Power System Contingency Classification,” Department of Electrical and Computer Engineering Drexel University, Philadelphia, PA 19104, USA.
- I. Faustino Agreira, C.M. Machado Ferreira, J. A. Dias Pinto, and F. P. Maciel Barbosa, “Application of the Rough Set Theory to the Steady – State Contingency Classification,” Power Tech, June 2005, IEEE Russia.
- Abdulwahhab A. A. ‘Contingency ranking of power systems using a performance index’, International Research Journal of Engineering and Technology (IRJET) e-ISSN: 2395 -0056 Volume: 02 Issue: 02, 2015.
- Chen, F.Luo, Y. Xu and Jing Qiu4, “Self-adaptive differential approach for transient stability constrained optimal power flow,” IET Gener. Transm. Distrib, pp. 1–10, 2016.
- Gan, R. J. Thomas, and R. D. Zimmerman, “Stability-Constrained Optimal Power Flow,” IEEE TRANSACTIONS ON POWER SYSTEMS, VOL. 15, NO. 2, MAY 2000.
- Mohseni-Kolagar and H. Miar-Naimi , “ Transient Analysis of Bang-Bang Phase locked Loops without Cycle Slipping for Frequency Step Inputs,” 2012, 6th International Conference on Sciences of Electronics, Technologies of Information and Telecommunications (SETIT).
- Meddeb, H.Jmii, and S.Chebbi, “Heuristic analysis and contingencies classification of case Study IEEE 14-bus,” 7th International Conference on Sciences of Electronics, Technologies of Information and Telecommunications (SETIT), pp.128–133, 2016.
- H. Fink and K. Carslen, “Operating Under Stress and Strain,” IEEE Spectrum Magazine , 1978
- M. Anderson and A. A. Fouad, “Power system control and stability,” Book, IEEE Press, 1994.
- Kundur, “Power system stability and control, book” McGraw-Hill,Inc 1993.
- Pavella, D.Ernest, and D. Ruizvega, “Transient Stability of Power Systems A Unified Approach to Assessment and Control,” Book, Kluwer Academic Publishers Boston/Dordrecht/London, 2000th Edition.
- Zeng, and Y.Yu,“A Practical Direct Method for Determining Dynamic Security Regions of Electrical Power Systems,”, International conf on power system Tech proceeding, IEEE 2002.
- A. Kaplunovich, K. S. Turitsyn, “Statistical properties and classification of N – 2 contingencies in large scale power grids,” 2014 47th Hawaii International Conference on System Science, 2014.
- Cheong Sou, H. Sandberg, and K. Henrik Johansson, “Electric Power Network Security Analysis via Minimum Cut Relaxation,” 2011 50th IEEE Conference on Decision and Control and European Control Conference, Orlando, FL, USA, December 2011.
- Singh, A. Uddin Ahmad, “Control Reactive Power Flow with UPFC Connected Using Different Distance Transmission Line,” Copyright to IJAREEIE DOI: 10.15662/IJAREEIE, 0409034, 2015.
- Visakha, K., Thukaram, D., & Jenkins, L, “Application of UPFC for system security improvement under normal and network contingencies,” Electric Power Systems Research, 70(1), 46-55, 2004.
- Thukaram, D., Jenkins, L., & Visakha, K.
, “Improvement of system security with unified-power-flow controller at suitable locations under network contingencies of interconnected systems,” IEE Proceedings-Generation, Transmission and Distribution, 152(5), 682-690, 2005. - Gupta, S., Tripathi, R. K., & Shukla, R. D, “Voltage stability improvement in power systems using facts controllers: State-of-the-art review,” Power, Control and Embedded Systems (ICPCES), pp. 1-8, 2010.
- Kamarposhti, M. A., Alinezhad, M., Lesani, H., & Talebi, N, “Comparison of SVC, STATCOM, TCSC, and UPFC controllers for static voltage stability evaluated by continuation power flow method,” In Electric Power Conference, EPEC, IEEE Canada pp. 1-8, 2008.
- V.R.Kumar, and S. S.Nagaraju, “Transient Stability Improvement using UPFC and SVC,” ARPN Journal of Engineering and Applied Sciences, Vol. 2, No. 3, June, 2007.
- Bhattacharyya, V.K.Gupta, and S.Kumar, “UPFC with series and shunt FACTS controllers for the economic operation of a power system,” Ain Shams Engineering Journal, 2014.
- Ping Zhang, C. Rehtanz, and B. Pal, “Flexible AC Transmission Systems: Modelling and Control,” DOI 10.1007/978-3-642-28241-6, Springer-Verlag Berlin Heidelberg, 2012.
- K. Kodsi and C. A. Canizares, “IEEE 14 Bus system with facts controllers,” IEEE Trans, 2003.
- Eurostag, Eurostag Software Release Notes, Tractebel-EDF, Release 5.1, Dec 2010.