Non-rigid Registration for 3D Active Shape Liver Modeling

Adv. Sci. Technol. Eng. Syst. J. 3(1), 366–372 (2018);
 DOI: 10.25046/aj030145
To avoid biopsies, doctors use non invasive medical techniques such as the computed tomography. Even that, the detection of the liver remains a big challenge because of the gray level and shape variations which depend on patients and acquisition modalites. In this work, we propose to create a 3D liver model in the training phase of 3D active shape model algorithm. This training model will be deformed according to any given 3D data for liver segmentation. The contribution of our work is the use of the Non-rigid registration with a B-spline registration on the training phase. We tested our method on an open access database (”3DIRCADb”) and on our database obtained from the radiology department of the National Oncology Institute of Tunis. Both data-sets showed the reliability of the method with an accuracy equal to 69.98% and 71.18% respectively for our database and ”3D-IRCADb”.
1 Introduction
Computed Tomography (CT) is a non invasive technique with a large field of view. It helps doctors to detect some hepatic disease. First, they identify the liver from the abdominal CT slice using two phases of enhancement: portal and arterial. In each time of enhancement, the gray level of the liver changes. In this work, we propose a 3D method to extract the liver from the CT slice according to its shape. We use different 3D CT exam with different phases of enhancement containing normal and pathological cases. The aim of our work is to use an advanced technique of segmentation to extract liver from images of any type of modality. For that reason, we propose to use the Active Shape Model (ASM). The ASM have been recognized as robust solution for a supervised technique of segmentation. Our contribution is to improve the performance of the 3D ASM algorithm with a pre-processing phase using a non rigid registration based on B-Spline transformation. The following paper is an extension of work originally presented in the 7th International Conference on Sciences of Electronics, Technologies of Information Telecommunication” [1]. In this work, we improve the evaluation of results using the ROC-Curve analysis and we ensure the reliability of our method using our database in addition to the ”3D-IRCADb”. Also, we compare the results not only with the Isosurfaces also with the Marching Cubes 3D reconstruction. The paper is organized as follow: Section 2 presents some literature related works. In section 3, we explain the 3D-ASM method and its different steps for 3D-model construction. the proposed method is applied on the open access database ”3D-IRCADb” and our database. In section 4, we use the ROC-Curve analysis to evaluate the 3D liver modeling. First, we compare our 3D model with the Isosurfaces 3D reconstruction, then, with the Marching Cubes technique. Finally, we resume our proposed method and the obtained results on the conclusion.
2 Related works
The major point of interest of the Computed-aided diagnostic system is to solve difficulties of the medical field. The segmentation technique is the most important step in those system. It allows the physicians to extract the region of interest and to analyze it for more helpful medical information. In this context, many techniques of segmentation have been developed such as morphological operations exposed on the work of Pham The Bao et al.[2]to extract the liver from the volumetric CT images. In [3], they improved morphological operator algorithm by using the watershed technique to segment the micro-tomographic trabecular bone. The watershed algorithm is widely used to identify the region of interest. In [4],P. Rodrigues et al. used it with an open software ”Mevislab” to extract the liver from the CT exam with a 87% of accuracy. In [5], the author used the Fisher algorithm to improve the watershed algorithm for the radar images segmentation. Moreover, there are some intensity based techniques which detect the object according to the intensity repartition. In [6], the author constructed a model of the intensity distribution for the surface of the liver, cysts and lesions. Then, they calculated the probability of pixel belonging to each classification of different regions. In [7], Alom et al. used the ”SGM growing slice method”, an algorithm for 3D segmentation of the liver. Also, we note that algorithms of classification are used to segment the liver. For example, in the work [8], authors made a new texture feature extraction to improve liver classification using K-mean algorithm. While, in [9], the author used the ”Support Vector Machine” algorithm and the surface distance maps for 3D-liver segmentation from CT-scans. Previously exposed works are based on the intensity of the liver and its gray level. In order to improve the segmentation technique, we propose a 3D-supervised-method for liver segmentation to overcome problems of gray level variation.
3 Methods and materials
In this section, we will explain the use of the shape context based on non-rigid surface registration with a B-Spline transformation in order to adapt the Active Shape Model for 3D CT liver segmentation. We start by a global description of the proposed method. Then, we detail each step. Figure 1 describes the different steps of our work to segment 3D CT liver. First, we note that the cases of the two databases are acquired with different parameters. So each exam has different number of slices, resolution and voxel size. To create the 3D model of the liver using the 3D ASM, we must uniform the volumetric data in the pre-processing phase. Several works combine different registration algorithm with a 3D segmentation method to extract a volumetric data such as to segment the left ventricle in [10] and the mandibular canal in [11]. In our work we propose to use a non-rigid registration with a B-Spline transformation. After the pre-processing phase, the 3D CT-scan has the same size of the matrix of vertices and the matrix of faces. Those two matrix will be used on the training phase of the 3D-ASM. Finally, we create the 3D liver model in the testing phase of the 3D-ASM.
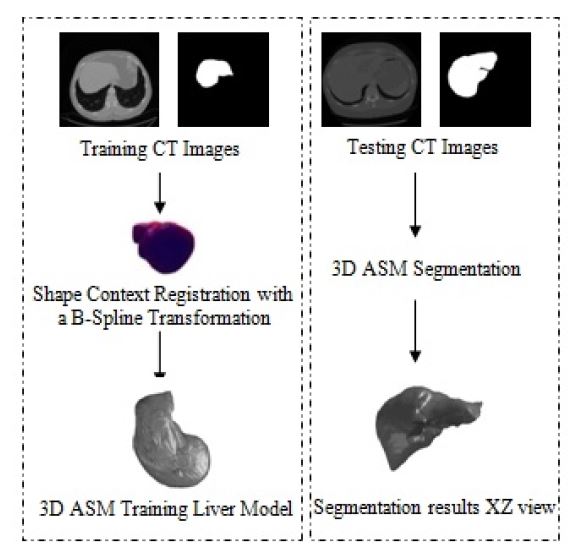 Figure 1: Diagram of the main work for 3D-ASM Liver segmentation
3.1 3D pre-processing CT-data
The CT-Scan measure the attenuation of the X-ray crossing the organ. These measurements are taken from different angles to produce a cross-sectional image called also slice separate with a thickness value. The total number of slices makes a volume information of the explored organ. However, doing the CTScan exam allows doctor to see details of the scanned organ in multi-planes (Coronal, axial and transverse). The obtained CT image is a matrix composed in pixels. Considering the the thickness between slices, each pixel represents a small volume element called also voxel. Its size depends on the matrix size, the thickness and the field of view. The CT images will be next stored as a numeric image. We note that the CTimages are coded according to thee Hounsfield units (UH) expressed by equation 1:

In our work,we first change the UH to a gray level scaling using the DICOM header. We can define the gray value of a pixel as follow in equation (2):
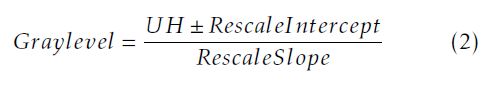 where: The rescale intercept is equal to 0 for the IRCADb database and −1024 for our database; The rescale slope is equal to 1 for the both databases. After changing the UH to the gray level scale, we uniform the slice number of the training data so all the training exams will have the same number of slices. We add a black slice at the end of the CT exam to reach the desired number. Then, we start the preprocessing step to achieve the same matrix size of faces and vertices to all the training 3D data using the Shape Context Correspondence Point Model algorithm. It is based on a registration method. We can classify the registration into two classes: rigid and non-rigid transformation [12–14]. In our work, we employ a diffeomorphic B-Spline cubic transformation for no-rigid registration. We note : ”C1” a contour of an object 1 and ”pi” the number of points selected to define the contour; ”C2” a contour of an object 2 and ”qj” the number of points selected to define this contour. Then, we measure the cost function ”C”between the two objects. It is defined in (3) as follow:
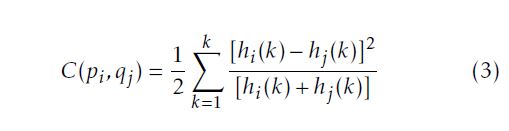 With: hi and hj respectively histograms of the two shapes. After calculating the cost function, we minimize it to increase the degree of the similarity and the matching between the two shapes. To minimize the cost function, we choose a type of transformation in the registration phase. The type of transformation depends on the feature to be extracted from the object [15, 16], such as the match point algorithm[17], the 3D coordinate[18]and the intensity transformation using an iterative closet point algorithm [19, 20]. Figure 2 shows the different steps of the pre-processing phase. The first step of the registration phase using the Shape Context algorithm is to define the type of the transformation. In this work, we use the B-Spline cubic transformation. Then, we choose the mastery data which have the biggest number of slice and a floating data. This transformation is based on the surface matching with a spatial alignment of the two volumetric CT data. As an output of this phase, the CT exam will have the same size of vertices and faces matrix in order to be used on the next stage which is the 3D-ASM.
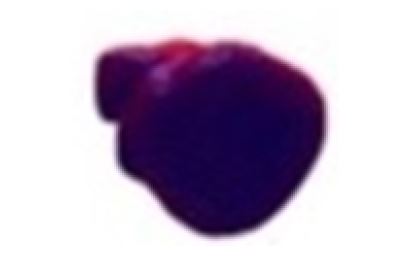 Figure 2: Pre-processing phase using Shape Correspondence Point Model
3.2 3D Active Shape Model
The 3D-ASM is an iterative supervised segmentation algorithm firstly proposed in [21] in 2002. It contains two phases: training and testing. Thanks to this algorithm based on the distribution point model (PDM) [22], we train our system to learn different liver shape variations. The input data in the training phase are 3D surface matrix containing the faces, the vertices of the 3D mesh and the binary volume of the extracted liver from the CT slice. At the beginning, we define for an object ”O” a set of target point called landmark ”n”. The ”n” points reform a vector of shape noted X = (x,x2,…,xn,y1,y2,…,yn,z1,z2,…,zn)T . After the identification of vector shape, we calculate from the 3D input data the covariance matrix. Then, we use
the principal analyze components (PCA)[23]to identify the eigen-vectors”’xi and their eigen-values. The PCA allows us to calculate the mean shape and its variations. Finally, we apply the PDM algorithm to create our training shape model noted X˜ in (4).
X˜ = X¯ +φsbs (4)
With: X¯: aligned training shape; bs:shape parameter√
vector of the shape. It is equal to bs=±m λi; m ≤ 3; φs: eigenvectors corresponding to the eigenvalue of the covariance matrix. The next step in the 3D-ASM algorithm is to update the training model using the Mahalanobis distance[24]. Then, we apply the training deformed model to create our 3D liver model according to a given CT-data without doing a registration step.
4 Results and discussion
In this section, we start by a description of the databases used in this work and we present the obtained results. In order to evaluate the accuracy of our 3D liver modeling, we use the ROC-Curve analysis.
4.1 Description of databases
The proposed method was tested on two databases: our database (15 CT-exams) and the ”3D-IRCADb” one (20 CT-exams). In [25], twenty radiologists expert describe the different parameters of the 3D IRCADb database. We found that the voxel size is various from one case to another from 0.57cm3 to 1.6cm3. Also in our database acquired at the radiology department of National oncology Institute ”Salah AZAIEZ” of Tunis, the voxel size varies from 1.25cm*1.25cm*1.25cm to 1.4cm*1.4cm*1.4cm. For more efficiency, we use for the training phase, the 3D CT-scans with the same voxel size. In this work,for each database, we use the 80% of the CT-scan data having the same slice thickness for the training phase and 20% of 3D CT-scan for the testing phase.
4.2 Experiments
This study presents the use of the 3D-ASM for CT liver segmentation. For the beginning, we make a registration phase to recover some parameters such as rotation, scaling and translation in order to minimize the dissimilarity between two 3D CT-data. Figure 3 shows 3D mesh of the diffeomorphic B-Spline cubic registration. After the Shape Context registration, the output of this stage is used as input of the training phase of 3D-ASM algorithm. Different results of the 3D training shape are exposed in Figure 4.
Figure 3: 3D liver mesh of the B-Spline registration
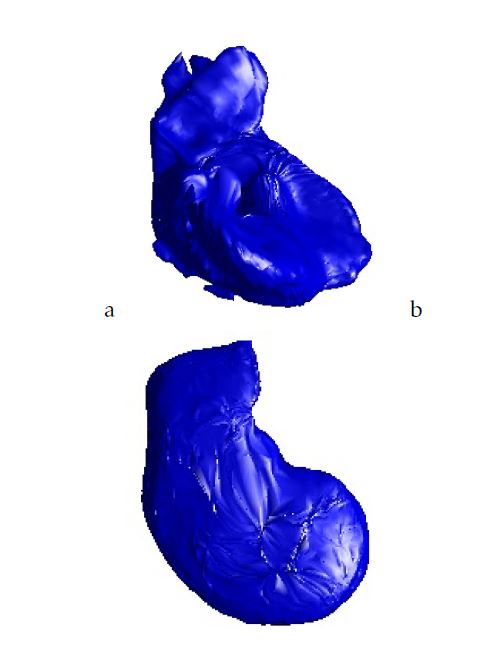 Figure 4: Training 3D model:a.Case from our database; b.Case from 3D-IRCADb database
To establish the proposed work, we use for the training phase of the 3D-ASM the cases which have the same thickness between slices and total number of slice. Then, we handle the corresponding Shape Context Points Model with a B-Spline transformation to create the same size of a 3D Liver grid. After the preprocessing step, we apply the 3D-ASM algorithm. To evaluate, in this work, the obtained results, we make a 3D reconstruction of the liver using the Isosurfaces and the Marching Cubes method.Then we compare them with the 3D-ASM of the liver. Figure 5 and figure 6 show different views of the 3D liver shape obtained from our database and the ”3D-IRCADb” open access database.
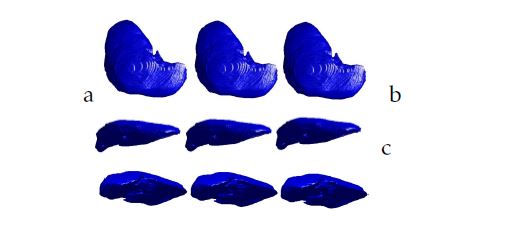 Figure 5: 3D liver segmentation of cases from ”3DIRCADb” database using respectively from the left to the right: the Isosurfaces, the Marching Cubes and the proposed method: a.XY view; b.XZ view; c.YZ view
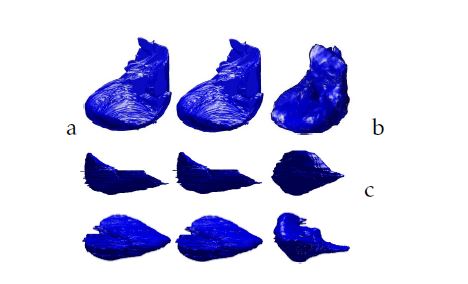 Figure 6: 3D liver segmentation of cases from our database using respectively from the left to the right: the isosurfaces, the Marching Cubes and the proposed method: a.XY view; b.XZ view; c.YZ view
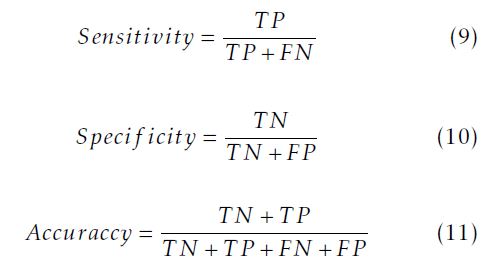
After visual comparison, we use five parameters essentially used on ROC-curves analysis widely used in evaluation on the medical field [26]. These parameters are: sensitivity (SN), specificity (SP), accuracy (ACC), positive predicted value (PPV), negative predicted value (NPV) and area under the curve (AUC). We note the Vs is the segmented volume and VGT the ground truth one. We define the True Positive(TP) as the degree of matching between the 3D mesh of Vs and the VGT expressed in(5).
T P = Vs ∩VGT (5)
Its complement called False Negative (FN) is defined in (6).
FN = VGT −T P (6)
Moreover, we define the True Negative (TN) when we found a similarity on the false information. It is given in (7).
T N = 1−(Vs ∪VGT ) (7)
The False Positive (FP) is when our system detect a falsse mesh similiarity when there is no resemblance. It is given in (8).
FP = Vs −T P (8)
According to those parameters, we calculate the sensitivity given in (9), the specificity given in (10) and the accuracy given in (11).
We expose in tables 1 and 2 the different obtained values of the previously defined parameters. In this work, for each database, the liver was segmented by experts. So, we make a 3D reconstruction of these segmented volume using Isosurfaces and Marching Cubes techniques. Then, we apply the ROC-Curve independently. In the first hand, we apply it between our 3D results and 3D isosurfaces. On the second hand, we extract the different measure of the ROC-Curve between our 3D results and the Marching Cubes reconstruction.
| Our database | 3D-IRCADb | |
| Sensitivity (%) | 68.38 | 63.8 |
| Specificity (%) | 71.57 | 59.36 |
| PPV(%) | 69.88 | 60.23 |
| NPV (%) | 70.85 | 59.52 |
| Accuracy (%) | 69.98 | 59.51 |
| AUC | 0.74 | 0.63 |
Table 1: Performances of the 3D-ASM with a B-spline registration versus the Isosurfaces reconstruction
| Our database | 3D-IRCADb | |
| Sensitivity (%) | 75.16 | 50.06 |
| Specificity (%) | 65.93 | 49.94 |
| PPV(%) | 69.16 | 50.07 |
| NPV (%) | 72.33 | 50.76 |
| Accuracy (%) | 70.44 | 50.07 |
| AUC | 0.74 | 0.49 |
Table 2: Performances of the 3D-ASM with a B-spline registration versus the Marching Cubes reconstruction
Comparaing to the Isosurfaces and Marching Cubes methods, the 3D-ASM based on the Shape Context registration with a B-Spline registration achieve about 70% of accuracy and 71,57% of specificity. Those promising results, ensure the efficiency of the proposed method based on a non-rigid registration for the pre-processing phase. We found that we achieve better results with our database.
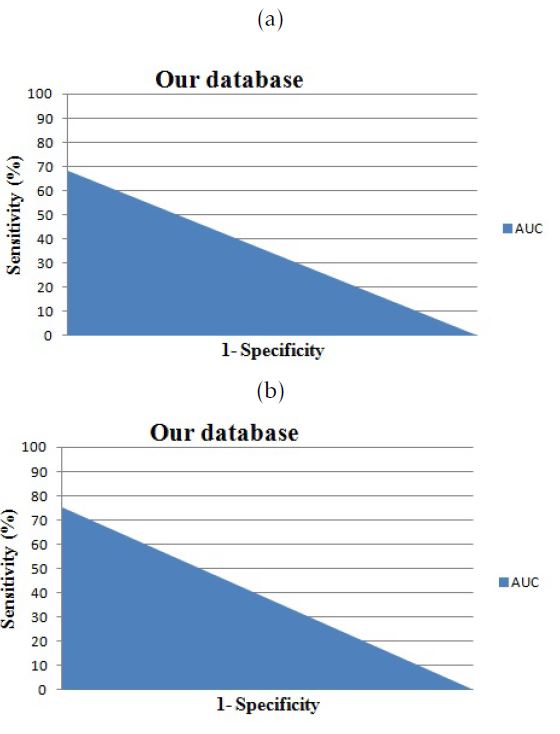 Figure 7: The area under the curve for cases from our database: a.versus Isosurfaces; b.versus Marching Cubes
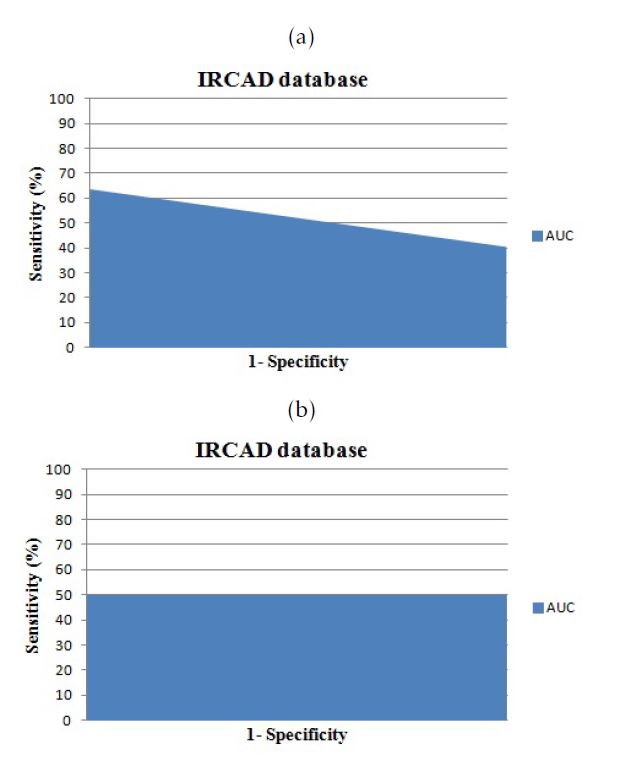 Figure 8: The area under the curve for cases from ”3D-IRCADb”database: a.versus Isosurfaces; b.versus Marching Cubes
Our database contains pathological and normal cases. We used the normal cases for the training phase and we test the proposed method on pathological and normal cases. In fact, the 3D Active Shape Model is an advanced technique of 3D segmentation based on the shape. In this study, we prefer to use normals case with shape variation in order to create an efficient 3D learning model which will be deformed according to a given 3D CT-Scan exam. The inconvenient of the use of the pathological cases in the training phase is the no accurate liver shape since we can found one or several parts of the liver have been removed. The ”3D-IRCADb” contains pathological cases without ablation which can be convincing for our study. To evaluate the efficiency of our proposed method using the ”3D-IRCADb” database, we compare the 3D liver mesh obtained using our proposed method , the Isosurfaces and the Marching Cubes 3D reconstruction with the VTK files. The different results are exposed in the table 3. We found almost the same measure off the Area under the curve, presented in figure 9, but we achieve a slight improvement in terms of accuracy using the 3D Active Shape Model with a B-spline registration comparing to the Isosurfaces (Iso) and the Marching Cubes (MC).
| MC | Iso | Proposed Method | |
| Sensitivity (%) | 65.782 | 65.758 | 65.765 |
| Specificity (%) | 75.392 | 75.492 | 75.494 |
| Accuracy (%) | 70.629 | 70.648 | 71.182 |
| PPV (%) | 72.973 | 73.052 | 73.053 |
| NPV (%) | 68.775 | 68.744 | 68.736 |
| AUC | 0.757 | 0.756 | 0.751 |
Table 3: Comparison of the 3D liver mesh between the VTK files of ”3D-IRCADb”, the Isosurfaces, Marching Cubes and our proposed method using ASM with a B-spline registration.
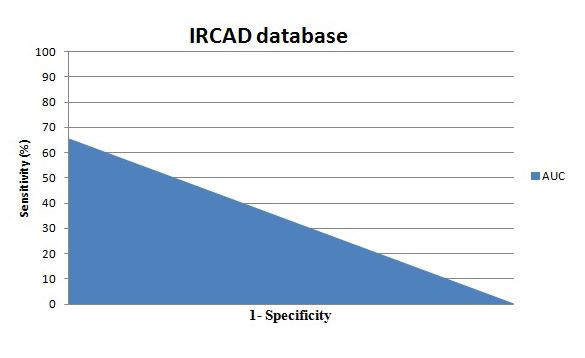 Figure 9: The Area under the curve: Comparison between our propose method and the VTK files of ”3DIRCADb” database
5 Conclusion
In this work, we used the Active shape Modeling for 3D CT-liver segmentation. In order to well create our model, we used in the pre-processing phase the Shape Context Corresponding Point Model with a BSpline cubic interpolation. Evaluation of the proposed method has been performed by using 20 CTexams from the ”3D IRCADb”’database and 15 CTexams from our database. We acheive a good results for 3D liver segmentation with a 70% of accuracy. Results obtained using our database are better than those obtained with the open access database ”3D-IRCADb”. This is due to the fact that the ”3DIRCADb” database is composed only by pathological cases contrariwise to our database which is composed by normal and pathological cases. As a conclusion, it would be better to use only normal cases or a much bigger number of normal cases than pathological cases to build a good training model. The proposed method brings to the doctors and the researchers, an approximate 3D model for normal liver cases. As a perspective, we attend to extract some feature from this 3D model for normal liver i order to detect liver pathologies according to the liver 3D mesh.
Conflict of Interest
The authors declare no conflict of interest.
- Trabelsi, K. Aloui, and D. Ben Sellem. 3d active shape model for ct-scan liver segmentation. In 2016 7th International Conference on Sciences of Electronics, Technologies of Information and Telecommunications (SETIT), pages 161–165, Dec 2016. doi: 10.1109/SETIT.2016.7939859.
- Pham The Bao, Tran Hong Tai, Viet-Hang Duong, and Jia- Ching Wang. Liver segmentation from 3d abdominal ct images. In Consumer Electronics-Taiwan (ICCE-TW), 2015 IEEE International Conference on, pages 342–343. IEEE, 2015.
- A. Fourati and M. S. Bouhlel. Contour-based surface modeling and analysis of microtomographic trabecular bone images. In 2012 6th International Conference on Sciences of Electronics, Technologies of Information and Telecommunications (SETIT), pages 423–427, March 2012. doi: 10.1109/SETIT. 2012.6481951.
- Rodrigues, J. L. Vilac¸a, and J. Fonseca. An image processing application for liver tumour segmentation. In 1st Portuguese Biomedical Engineering Meeting, pages 1–6, March 2011. doi: 10.1109/ENBENG.2011.6026097.
- Belkhaoui, A. Toumi, A. Khenchaf, A. Khalfallah, and M. S. Bouhlel. Segmentation of radar images using a combined watershed and fisher techniques. In 2012 6th International Conference on Sciences of Electronics, Technologies of Information and Telecommunications (SETIT), pages 400–403, March 2012. doi: 10.1109/SETIT.2012.6481948.
- J. Chen, A. Kutluk, Y. T. Hu, and M. Hamit. Liver hydatid ct image segmentation based on localizing region active contours and modified parametric active contours. In 2014 7th International Conference on Biomedical Engineering and Informatics, pages 217–221, Oct 2014. doi: 10.1109/BMEI.2014.7002773.
- Z. Alom, M. Mostakim, R. Biswas, and A. Chakrabarty. Automatic slice growing method based 3d reconstruction of liver with its vessels. In Computer and Information Technology (ICCIT), 2013 16th International Conference on, pages 338–344, March 2014. doi: 10.1109/ICCITechn.2014.6997361.
- Ma, F. Duan, and P. Guo. Improvement of texture image segmentation based on visual model. In 2012 6th International Conference on Sciences of Electronics, Technologies of Information and Telecommunications (SETIT), pages 151–154, March 2012. doi: 10.1109/SETIT.2012.6481904.
- Zhang, J. Tian, D. Xiang, X. Li, and K. Deng. Interactive liver tumor segmentation from ct scans using support vector classification with watershed. In 2011 Annual International Conference of the IEEE Engineering in Medicine and Biology Society, pages 6005–6008, Aug 2011. doi: 10.1109/IEMBS.2011. 6091484.
- Santiago, J. C. Nascimento, and J. S. Marques. Segmentation of the left ventricle in cardiac mri using a probabilistic data association active shape model. In 2015 37th Annual International Conference of the IEEE Engineering in Medicine and Biology Society (EMBC), pages 7304–7307, Aug 2015. doi: 10.1109/EMBC.2015.7320078.
- Abdolali and R. A. Zoroofi. Mandibular canal segmentation using 3d active appearance models and shape context registration. In 2014 21th Iranian Conference on Biomedical Engineering (ICBME), pages 7–11, Nov 2014. doi: 10.1109/ICBME.2014. 7043884.
- Huysmans, J. Sijbers, and V. Brigitte. Automatic construction of correspondences for tubular surfaces. IEEE Transactions on Pattern Analysis and Machine Intelligence, 32(4):636– 651, April 2010. ISSN 0162-8828. doi: 10.1109/TPAMI.2009. 93.
- Perean˜ez, K. Lekadir, I. Castro-Mateos, J. M. Pozo, A´ . Laz´ary, and A. F. Frangi. Accurate segmentation of vertebral bodies and processes using statistical shape decomposition and conditional models. IEEE Transactions on Medical Imaging, 34(8):1627–1639, Aug 2015. ISSN 0278-0062. doi: 10.1109/TMI.2015.2396774.
- Mohamed M Habib, Roshan A Welikala, Andreas Hoppe, Christopher G Owen, Alicja R Rudnicka, Adnan Tufail, Catherine Egan, and Sarah A Barman. Incorporating Spatial Information for Microaneurysm Detection in Retinal Images. Advances in Science, Technology and Engineering Systems Journal, 2(3):642–649, 2017. URL https://astesj.com/v02/i03/ p82/.
- Pan, X. Zhang, Y. Wang, Z. Hu, X. Zheng, and Z. Wu. Establishing point correspondence of 3d faces via sparse facial deformable model. IEEE Transactions on Image Processing, 22(11):4170–4181, Nov 2013. ISSN 1057-7149. doi: 10.1109/TIP.2013.2271115.
- Olivier Commowick. Design and Use of Anatomical Atlases for Radiotherapy. Theses, Universit´e Nice Sophia Antipolis, February 2007. URL https://tel.archives-ouvertes.fr/ tel-00133432.
- Salehpour and A. Behrad. 3d face reconstruction by klt feature extraction and model consistency match refining and growing. In 2012 6th International Conference on Sciences of Electronics, Technologies of Information and Telecommunications (SETIT), pages 297–302, March 2012. doi: 10.1109/SETIT. 2012.6481932.
- Ghanbari, R. Abbasi-Asl, A. Ghaffari, and E. Fatemizadeh. Automatic b-spline image registration using histogram-based landmark extraction. In 2012 IEEE-EMBS Conference on Biomedical Engineering and Sciences, pages 1004–1008, Dec 2012. doi: 10.1109/IECBES.2012.6498119.
- Antonis D Savva, Theodore L Economopoulos, and George K Matsopoulos. Geometry-based vs. intensity-based medical image registration: a comparative study on 3d ct data. Computers in biology and medicine, 69:120–133, 2016.
- Xing and P. Qiu. Intensity-based image registration by nonparametric local smoothing. IEEE Transactions on Pattern Analysis and Machine Intelligence, 33(10):2081–2092, Oct 2011. ISSN 0162-8828. doi: 10.1109/TPAMI.2011.26.
- van Ginneken, A. F. Frangi, J. J. Staal, B. M. ter Haar Romeny, and M. A. Viergever. Active shape model segmentation with optimal features. IEEE Transactions on Medical Imaging, 21(8):924–933, Aug 2002. ISSN 0278-0062. doi: 10.1109/TMI.2002.803121.
- Timothy F Cootes, Christopher J Taylor, et al. Statistical models of appearance for computer vision, 2004.
- Tateyama, A. H. Foruzan, and Y. W. Chen. Pca based statical shape model of the spleen. In 2009 Fifth International Conference on Natural Computation, volume 6, pages 36–39, Aug 2009. doi: 10.1109/ICNC.2009.695.
- Fadlalla G. Elfadaly, Paul H. Garthwaite, and John R. Crawford. On point estimation of the abnormality of a mahalanobis index. Computational Statistics & Data Analysis, 99: 115 – 130, 2016. ISSN 0167-9473. doi: http://dx.doi.org/10. 1016/j.csda.2016.01.014. URL http://www.sciencedirect. com/science/article/pii/S0167947316000232.
- Database IRCAD’, Http://www.ircad.fr/fr/recherche/3dircadb- 01-fr, Accessed 01 May 2015. Http://www.ircad.fr/fr/recherche/3d-ircadb-01-fr, 2015.
- Enoch Opanin Gyamfi and Yaw Marfo Missah. Pixel-Based Unsupervised Classification Approach for Information Detection on Optical Markup Recognition Sheet. Advances in Science, Technology and Engineering Systems Journal, 2(4):121– 132, 2017. doi: 10.25046/aj020417. URL http://astesj. com/v02/i04/p17/.
No related articles were found.