
LabVIEW-based data acquisition system for Diode I-V Characterization
Volume 3, Issue 1, Page No 348-351, 2018
Author’s Name: Nor Shaida Mohd Saufia), Nurul Syafiqah Yap Abdullah, Mohd Ikhwan Hadi Yaacob
View Affiliations
Faculty of Science Mathematics, Universiti Pendidikan Sultan Idris, 35900, Malaysia
a)Author to whom correspondence should be addressed. E-mail: norshaidasaufi@gmail.com
Adv. Sci. Technol. Eng. Syst. J. 3(1), 348-351 (2018); ![]() DOI: 10.25046/aj030142
DOI: 10.25046/aj030142
Keywords: LabVIEW, Data acquisition system, I-V Characteristics, Diode

Export Citations
This work describes computerized data acquisition system for current-voltage (I-V) characteristics of diodes. The proposed system consist of a personal computer pre-installed with LabVIEW, two units of power supply, an interface board, current and voltage sensors. Two devices under test (DUTs) are selected namely 1N4007 silicon and 1N34 germanium diodes. The current flow through the circuit and voltage across the diode is measured and I-V characteristic is successfully plotted. When data acquisition interrupted by the user, real time I-V curve with least-square fitting is plotted. The LabVIEW was employed primarily to display data from sensors and storing collected data for further post-measurement processing. Estimated forward voltage drop from plotted I-V curve was then compared with the published value from manufacturer’s datasheet. Comparison revealed that developed system has been successfully characterized both DUTs base on the forward voltage drop obtained from the plotted I-V curve. Furthermore, proposed system architecture offers extra flexibility where stored data can be manipulated with minimum programming efforts. The application of the proposed system can also be extended for in-situ device characterization in various circuits.
Received: 15 November 2017, Accepted: 07 January 2018, Published Online: 02 February 2018
1. Introduction
Rapid advancement in computerized measurement system around the world has seen the introduction of fast, simple, user-friendly and reliable solutions found in various applications. In recent years, rapid progress of the virtual instrument platform such as LabVIEW graphical programming language has simplified programming effort and produce simple yet highly-productive real-time computerized measurement system.
This paper is an extension of work originally presented in 2016 6th IEEE International Conference on Control System, Computing and Engineering (ICCSCE) [1]. In this report, we discussed in detail a system to determine I-V characteristics curve of germanium diode.
Proposed computerized I-V characterization system employed LabVIEW as the acquisition tool to obtain the data, analyze and display the result. Ease of use is one of our priority in this project. However, the complete functionality of LabVIEW is a plus factor that also satisfied the requirement of this project [2]. Virtual Instruments (VIs) in LabVIEW is utilized to construct a Graphical User Interface (GUI) as the time saving is the fair trade-off for the full low level control of other conventional programming languages such as C/C++, Visual Basic, and Matlab. Its graphical nature makes it ideal for measurement and data acquisition [3,4].
Simplifying data acquisition process and decreasing test time without scarifying the accuracy are primary goals in this project. Semiconductor diode is used in all sorts of electrical and electronic system. The electrical characterization of diode has been an important subject for more than half a century [5]. Semiconductor diode is an important device that exhibit non-linear relationship of I-V characteristics. In order to visualize the relationship, it is common to plot current versus voltage on graph. However, it is much more convenient to display the complete curve in an automated computer-based acquisition system.
2. System Description
This paper describes a LabVEW-based measurement method to plot I-V characteristics of semiconductor diodes. Figure 1 shows a block diagram of the main components of the measurement system that comprised mainly a personal computer with LabVIEW software, voltage and current sensors, interface board to be used between the sensors and computer, power supplies, and electronic circuit. In this research, LabVIEW 2012 was used in Windows 7 operating system. More precise sensors were used to measure voltage and current. The current sensor used was the Phidget CE-IZ02-32MS2-0.5 DC Current Sensor 0-1A powered by an external 12V power supply. The voltage sensor is Phidget Precision voltage sensor 1135 which measure differential voltage between input terminal and its output terminal. The current and voltage sensor was interfaced to personal computer through Phidget interface board 8/8/8 through Universal Serial Bus (USB) cable. Basically, the main components of the system and circuit used in this project is similar as described in [1] but we have used more sophisticated and better performance voltage and current sensors in terms of its measuring range and accuracy.
3. LabVIEW software
3.1. Block diagram
There are two windows for user to works on which are block diagram and front panel. LabVIEW is a programming environment which in block diagram, blocks representing functions, icons representing variables and lines representing data flows pass between different functional nodes [4]. LabVIEW is compatible with most of other hardware such as Phidget devices therefore they have their own blocks representing function. The communication between Phidget devices and LabVIEW software has been simplified using robust Application Program Interface (API) library which is accessible online for free. Figure 1 shows the block diagram of formula node in LabVIEW that was used to convert analog sensor value of voltage and current sensors to its corresponding value in volts and miliAmperes.
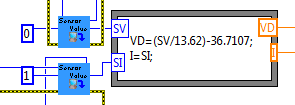 Figure 1. Formula node to write formula used to convert analog sensor value to voltage and current values
Particularly, Lev-Mar least square fitting method is expounded in the system which fit best the non-linear relation of diode. Figure 2(a) shows block diagram in LabVIEW for diode when user switch Curve fitting slide to Non-Linear and in Figure 2(b) is the block diagram when user switch slide to Linear. The saved data file in .csv can be accessed and plotted in Compare Graph when user clicked ‘file path’ and choose file location. The block diagram of the flow pass is shown in Figure 3.
Figure 3 shows block diagram that its function to read data from spreadsheet or .csv data file to be plot and compare in graph. The functional block can read and display multiple plot of germanium and silicon diode.
3.2. Graphical User Interface (GUI)
Front panel window is used as Graphical User Interface (GUI) of the system for user to interact with the program. Controls such as push button START, STOP, SAVE, PLOT and etc. as shown in Figure 4 are for user action to make the data displayed in indicator fields such as voltage, current value and also graphs. Before start the acquisition, user must make sure to check what is the electronic device to be tested. As we performed the measurement for I-V characteristics of diode, the Curve Fitting slide must be set to Non Linear. Next, when user clicked RUN button to start performing the acquisition, the LED of RATIOMETRIC STATE button is appeared green when the interface board is properly connected to computer and appeared red when it is not connected.
The voltage and current value appeared automatically and plotted on the I-V Characteristic graph. The fitting of I-V plot is plotted in real time until user push the STOP button to abort the execution. The graph provided a cursor for user to hover over the plotted line to find forward voltage drop of the diode as shown in Figure 4. The GUI gave user option in Curve fitting slide button to choose between linear and non-linear regression depends on what the characteristics of device the user testing.
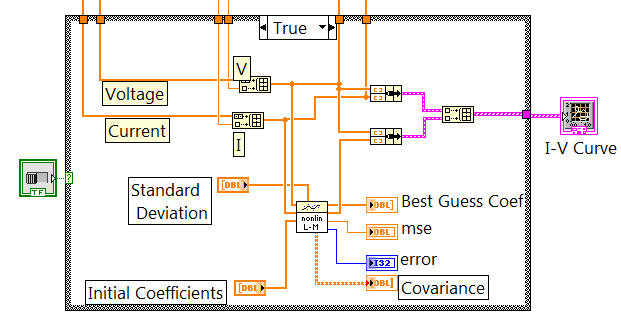 Figure 2(a). Block diagram of linear curve fitting
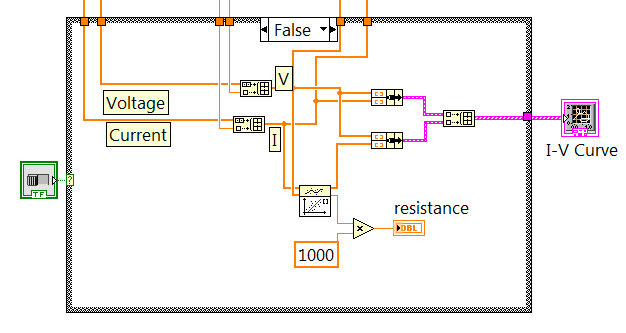 Figure 2(b). Block diagram of non-linear curve fitting
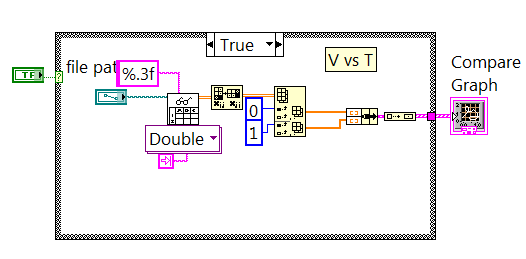 Figure 3. Functional block to read and plot graph from data file
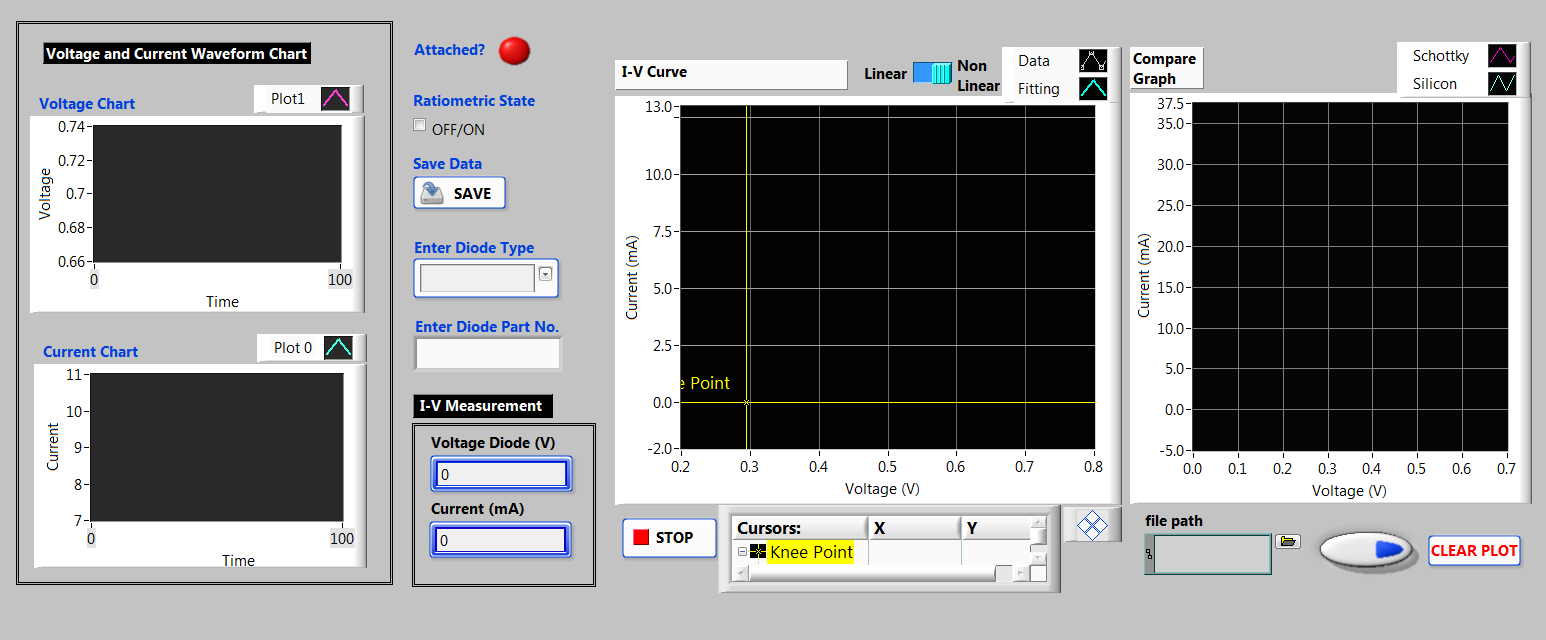 Figure 4. Graphical User Interface (GUI) developed in LabVIEW software Figure 4. Graphical User Interface (GUI) developed in LabVIEW software |
4. Analysis & Discussion
Recently in [1], silicon and Schottky diode has been studied which the system has shown the non-linear relationship of I-V characteristics. Upon studying the I-V graph, forward voltage drop of both diodes has been clarified which 0.7 volts for silicon and 0.4 volts for Schottky diode.
In this paper, the system has been tested on same silicon diode and characteristic of germanium diode is explored. The I-V characteristics graph plotted in Figure 5 can be seen that after the forward voltage drop, the current increases very rapidly where the device starts to conduct for both DUT. Below this voltage, current is less than 1% of maximum rated value of diode current [6]. Rated peak forward current for 1N34 and 1N4007 diode for most brand are 150mA and 30A [6,7]. Voltage increase slightly due to small internal dynamic resistance as the current change after the forward voltage drop is larger than the voltage change. The 1N34 germanium diode has much less defined result. The forward voltage drop is 0.4V which it is still shown low forward voltage drop. This germanium type of diode have low forward voltage drop which is fast switching speed and found uses in television and crystal radio application.
The silicon diode always expected to have value of forward voltage drop which is approximately 0.7 volts. The forward voltage drop was measured as 0.7 volts which this has support the theory behind its design. A germanium diode such as 1N34 have typically 0.3 volts forward voltage drop or low forward voltage drop means they are much more efficient compared to silicon diode. However, silicon diodes are resistant to heat, and better in terms of processing and stability. The results of this experiment appear to satisfy the theory behind diodes.
5. Conclusion
In this paper, a system for determination of current-voltage characteristics of diode has been developed and implemented. Based on LabVIEW software platform, this system measure current flow through the circuit and voltage across the diode to plot I-V characteristics of diode tested. From I-V plotted, forward voltage drop of silicon and germanium diode has been successfully determined. The possible research direction may include determination of voltage-current characteristics of any other two terminal components such as resistor or transistor. The ideality factor of diode can also be estimated by taking the natural log of current versus voltage plot.
Conflict of Interest
The authors declare no conflict of interest.
Acknowledgment
The authors want to thank to the Ministry of Higher Education (MoHE), Malaysia, through the RAGS/1/2015/STO/UPSI/03/1 Research Acculturation Grant Scheme (RAGS), Universiti Pendidikan Sultan Idris (UPSI) for the financial support provided to this work.
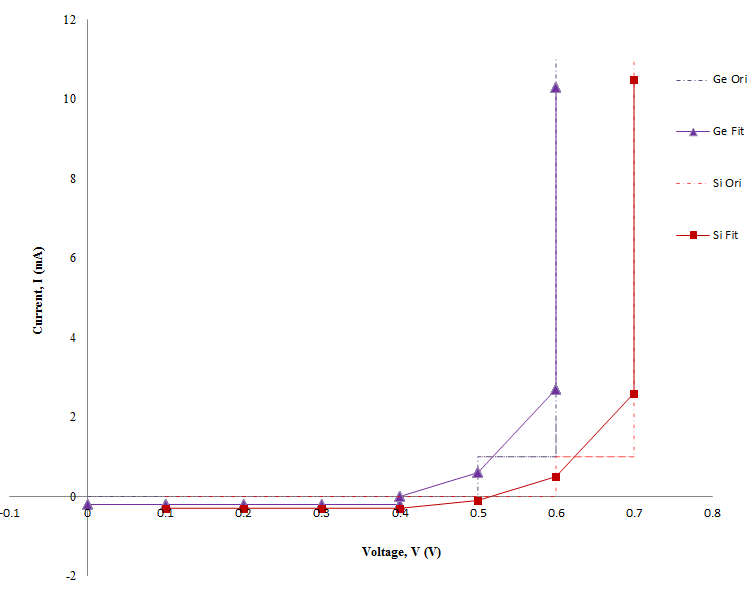 Figure 5. I-V characteristics graph of silicon and germanium diode Figure 5. I-V characteristics graph of silicon and germanium diode |
- s., M. S., Abdullah, N., & Yaacob, M. (2016). “Automated measurement system for diode I–V characterization,” in 2016 6th IEEE International Conference on Control System, Computing and Engineering (ICCSCE),pp. 498-501,2016.
- Sumathi, S., Surekha, P., & Surekha, P. (2007). LabVIEW based advanced instrumentation systems (Vol. 728). Berlin: Springer.
- Travis, J. King, LabVIEW for Everyone: Graphical Programming Made Easy and Fun, 2006.
- Bitter, R., Mohiuddin, T., & Nawrocki, M. (2006). LabVIEW: Advanced programming techniques. Crc Press.
- Shockley, “The theory of p-n junctions in semiconductors and p-n junction transistors,” Bell Syst. Tech. J., vol. 28, p. 435, 1949.
- Bakshi, A. G. U. (2009). Basic Electronics. Technical Publication
- Semtech, “Point Contact Germanium Diode,” 1N34A datasheet, n.d. {Retrieved from http://pdf1.alldatasheet.com/datasheet-pdf/view/42335/SEMTECH/1N34.html
- Vishay, “General Purpose Plastic Rectifier,” 1N4001 thru 1N4007 datasheet, 2017 [Revised Feb. 2017].