Signal-Based Metamodels for Predictive Reliability Analysis and Virtual Testing

Adv. Sci. Technol. Eng. Syst. J. 3(1), 342–347 (2018);
 DOI: 10.25046/aj030141
In the current industrial development, an increasing number of sensors is applied for monitoring of any kind of appliances and machines. A predictive mathematical model allows for realistic assessment of the health state of the appliance, indication of service requirements, as well as control of the appliance, serving as so-called digital twin on a control device. Completely analogous modeling can be used for virtual testing, i.e. a (partial) substitution of physical experiments. The software-in-the-loop model provides realistic feedback to the physical specimen on the test rig and helps to increase the representativeness of the experiment and to reduce costs. In a joint research project partially sponsored by the German Federal Ministry of Economics and Energy, the authors developed an approach for meta-modeling of dynamic systems. While the modeling process is fed by results from sophisticated simulations, or even test results as input data, the resulting model can be used for fast stochastic analyses as well as software-in-the-loop in dynamic real-time experiments. The approach was verified on tests of an aircraft high lift system.
1 Motivation and Objective
The prediction of test results is especially important for very expensive tests like in aerospace industrial applications, e.g. testing of high lift systems. As a matter of costs and manageability, the test specimen usually represents only a partial system. A realistic feedback of reactions from the remaining system by software driven actuators increases the representativeness of test results. Sophisticated procedures for realistic modeling of physical systems, e.g. algorithms for multi-body dynamics simulation, are available, but they require significant computation time and lack the ability of real-time performance. Therefore, there is a need to reduce computational cost maintaining high fidelity modeling.
Purely mathematical models can be established which are fast to compute, yet maintain accurate results. The authors’ approach, which has been presented initially in [1], yields meta-models that approximate the dynamic response of the tested object. Models are built on the basis of physical simulations that represent the test results accurately, but require a computation time that would be prohibitive as for the applications indicated above. The results of real experiments can be used as input data as well. The proposed meta-models, having short response times, enable fast robustness analysis to assess the influences of uncertain parameters such as damping or friction and can be used as software-in-the-loop even in real-time dynamic experiments [2, 3], where often fast but simplified physics-based models are applied [4]. The requirements for development of the methodology, which will be presented in the following sections, are summarized as: speed in performance, flexibility to change of parameters, versatility and accuracy.
The combination of physical testing and virtual testing serves several purposes: evaluation of the test rig without risk of damage; substitution of parts of the tested system —or augmentation of the existing test—; more realistic and more complex tests and reduction of costs.
Other applications of this approach can be thought of: fast meta-models can be implemented as digital twin on data acquisition and control devices for online monitoring of a system; in the development of a product, fast but accurate models are important for stochastic analyses such as predictive reliability assessment.
2 Methodology
Basis of the methodology proposed here is Dynardo’s algorithm Metamodel of Optimal Prognosis (MOP). The procedure fits the best available model to given data points and avoids so-called over-fitting. It first starts a filtering of parameters by statistical criteria. Input parameters with negligible influence on the observed results are canceled from the data set, thus the dimension of the problem can be reduced effectively. Several model approaches, such as polynomials, moving least squares, kriging, are built up and tested by cross validation. The resulting Coefficient of Prognosis (CoP) is the complimentary value to the sum of squared residuals over the variation of result data. The CoP gives information, what amount of data variation is explainable by the meta-model, based on independent test data. The MOP result is the chosen model out of the set of available models with the largest CoP. The MOP is also used for sensitivity analysis [5, 6]. Conditional variances are computed by holding systematically one parameter at fixed values, indicating the relative contribution of this parameter to the total variation of the response.
The MOP deals with scalar response quantities only. For the intended application, results are time series, e.g. from a multi-body dynamics simulation. Hence a representation of the time series by scalar values has to be found, while avoiding to adopt the total set of discrete time steps. The approach makes use of a specific topic in probability theory, namely the random fields methodology [7, 8]. A random field is a quantity defined on a spatial domain, where the value at any point of observation is a random variable. Here, the domain is time instead of space. The training data for the model are produced by first sampling input values, either by design of experiments or quasi-random sampling, then computing the results for each input data set. The time-dependent results are then interpreted as random process or 1-D random field.
The key to a parametrization of the random process is the eigenvalue decomposition of the covariance matrix CXX of the discretized time series X,
ΨT CXXΨ = diag{λi}, (1)
wherein Ψ is the matrix of eigenvectors, and diag{λi} holds the eigenvalues of the covariance matrix. From this, the so-called spectral representation of the random field can be derived [9]. Assuming that X are normal distributed with zero mean values (which can be subtracted for the analysis and added later again for synthesis of time series), new random variables Y are defined as
Y = ΨT X, (2)
which are normal distributed, independent, zero-mean and with a standard deviation given by
σYi = pλi . (3)
For synthesis of the original time series X, one makes use of the Karhunen–Loeve series expansion`
X = ΨY. (4)
A typical property of eigenvalue solvers is, that eigenvalues are stored in descending order. Since the eigenvalue of order i defines the amount of variation contributed by parameter Yi to the total variation of the data, this gives a criterion for truncation of the series expansion and therefore a drastic reduction of the dimension [10, 11].
Summarizing, for generation of a time series X one needs the modal base Ψ of the covariance matrix, which we may call the set of “shape functions” in the following, and the respective “amplitudes” Yi. Figure 1 shall illustrate the series expansion of (4) with an added mean value signal.
The shape functions are an unchangeable property of the data. Properties of the parameters Yi have to be determined such that, the series expansion optimally represents the physical time series X. For this purpose, MOP is applied to a training data set, from which the corresponding sample of amplitudes is calculated. This leads to the Field-Metamodel of Optimal Prognosis
(F-MOP). Figure 2 shows the flow of analysis. Using these dynamic meta-models, we obtain a simplified and reduced parametric of the dynamic signal based on a statistical meta-model. The user does not need to find a parametrization himself.
In analogy to the sensitivity analysis of scalar data [5, 6], the Coefficient of Prognosis of the F-MOP can be plotted against the time axis, called F-CoP here. Moreover, sensitivity measures over time can be computed, such that it is possible to assess the model quality and the relative influence of input parameters on the response, locally within the entire observed time range. The procedure is realized by connecting the functionalities of the programs offered by Dynardo, optiSLang and Statistics on Structures (SoS).
3 Application Example: Aircraft High Lift System
The methodology which is described in the previous section is validated by the example of an aircraft high lift system. Instead of real experiments, virtual tests using a detailed model serve for generating the training data. The simulation model in MSC Adams/Flex comprises the inboard flap, outboard flap, transmission and actuators as well as the test rig. With that, model wing position, flap positions, loadings as well as
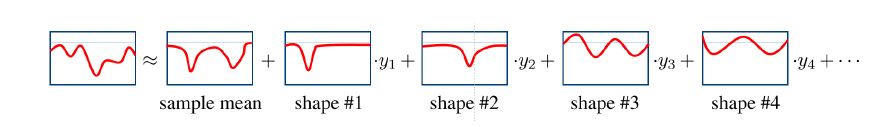 Figure 1: Illustration of Karhunen–Loeve series expansion of a signal.`
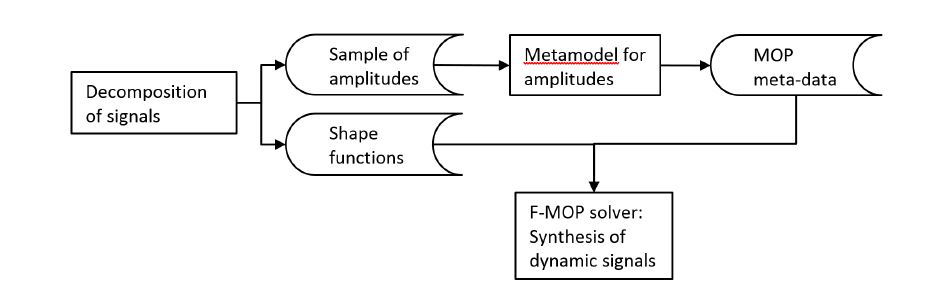 Figure 2: Overview of the approach of decomposing signals and generating meta-models for dynamic signals.
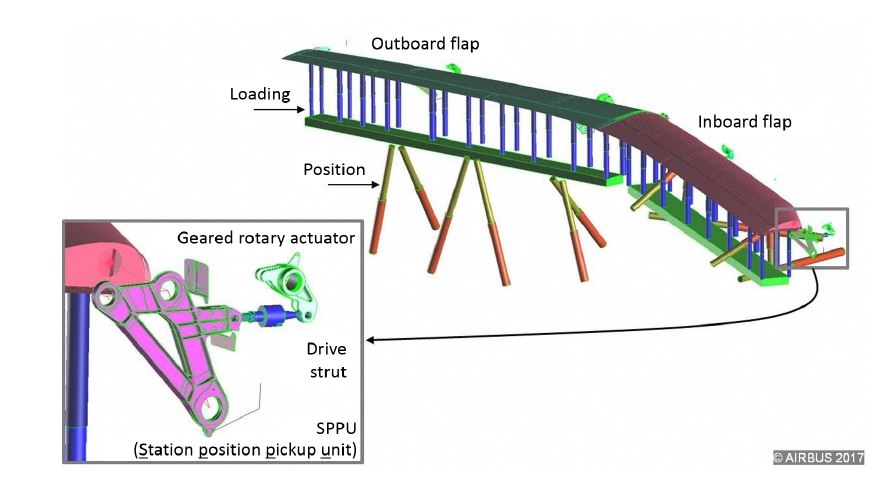 Figure 3: Adams/Flex model of the high lift system on a test rig.
actuator action and backlash can be simulated. Since friction is taken into account in the simulation, the model is actually non-linear. Figure 3 visualizes the tested system.
For the virtual test, wing and flap positions and loadings are given. The test case is a simulated rupture of two actuators simultaneously, one at the inboard flap, one outboard. As uncertain parameters, the stiffness of all actuators, backlash of all actuators, damping and friction parameters are sampled as input to the meta-modeling procedure. 200 parameter sets are simulated using MSC Adams/Flex, yielding signals over time of the dynamic responses. The responses observed are all actuator moments, drive strut forces and angles at the station position pickup units (SPPU). For these responses, dynamic meta-models shall be built.
4 Discussion of Results
Figure 4 –top– shows 4 typical signals picked out of the whole sample, here of the moment at actuator #2. Below, the prediction capability expressed as F-CoP is plotted. It can be observed that, the Coefficient of Prognosis of the model F-CoP [Total] is able to reach nearly 100% at the peaks of the signal, while its value drops where the oscillation passes the stationary value. At such points, scatter in data is rather numerical noise than information and cannot be explained by the metamodel. The relative influences of input parameters can be observed, too (largest: F-CoP[DV Fric Mue PP dyn] for Coulomb friction parameter).
Another signal, the angle at SPPU #2, is examined in the same way, results are displayed in Figure 5. There is a constant shift for each sample. The FCoP[Total] values are near 100% throughout the entire time range. The model quality is considered excellent by means of the statistical F-CoP criterion.
Finally, the original simulated time series and the series synthesized with help of the field meta-model shall be compared. Again, a few time series are arbitrarily picked from the whole sample. In Figure 6, the signals of the moment at actuator #2 are compared, and Figure 7 shows the comparison for the angles at the station position pickup unit #2. The top plots in both figures are the original simulation results obtained by MSC Adams/Flex, which serve as reference. The bottom plots are the signals which were synthesized by the field meta-models using the same input parameters as for the original simulations. The coincidence of original signals and meta-model results is excellent, particularly in the peaks. When the signals tend to be damped out, some artificial oscillations in the field meta-model results can be observed. These will vanish if the series expansion (4) is truncated at a later position, thus more shape functions will be taken into account.
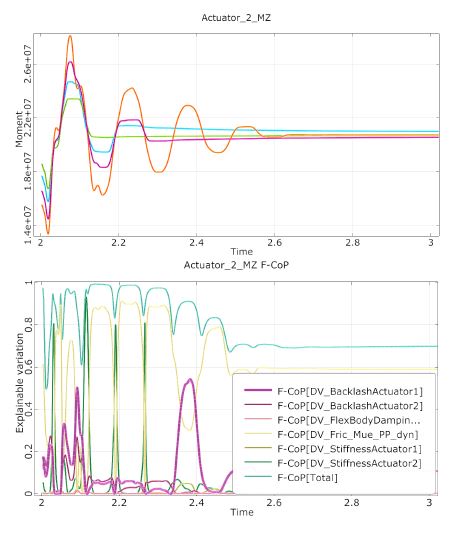 Figure 4: Top—Sample time series of moments at actuator #2. Bottom—Prediction capability of the model for the time dependent signal (F-CoP [Total]) and the impact of each input parameter on the total variation of the signal.
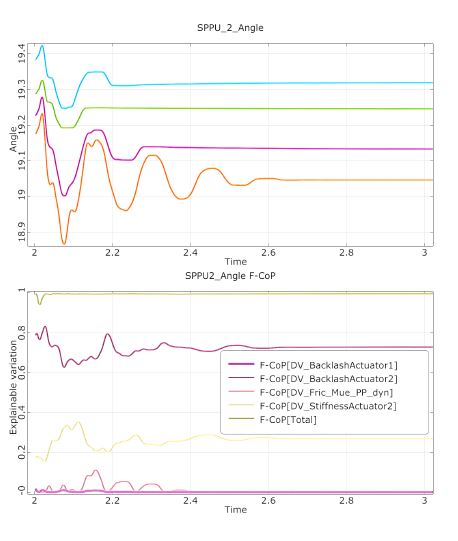 Figure 5: Top—Sample time series of angles at SPPU #2. Bottom—Prediction capability of the model for the time dependent signal (F-CoP [Total]) and the impact of each input parameter on the total variation of the signal.
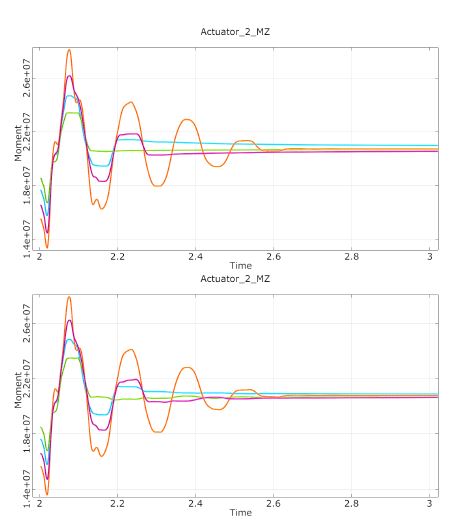 Figure 6: Sample time series of moments at actuator #2. Top—original results obtained from Adams/Flex. Bottom—synthesized signals by F-MOP.
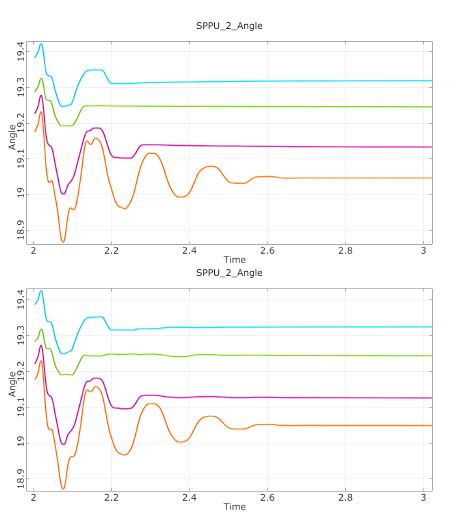 Figure 7: Sample time series of angles at SPPU #2. Top—original results obtained from Adams/Flex. Bottom—synthesized signals by F-MOP.
The proposed procedure has been applied also to other applications, e.g. for the parameter identification of non-linear material models in finite element analysis. The “signal” here is the load–displacement curve of a test specimen. In previous approaches [12], the signal was discretized into few equidistant steps, then meta-models were established by MOP for the single values on the curve. The squared residuals at these discrete points were used as criteria in a fast optimization procedure using MOP. For longer signals this approach is infeasible, moreover, it requires manual interference to identify characteristic points or relevant ranges. With the proposed approach, this is not necessary anymore. The field meta-model is valid for all points according to the raster of the original data, and one easily sees in which regions the parameters have what amount of influence.
5 Summary and Outlook
A new procedure is proposed in this article for metamodeling of dynamic (time series) signals. It is based on the decomposition of a sample set of signals into a series consisting of shape functions scaled by amplitudes for each summand. The algorithm Metamodel of Optimal Prognosis is then applied to find the best fitting model for each amplitude. The Coefficient of Prognosis, which does an assessment of models with the statistical method of cross validation, is used as the selection criterion. It is possible to assess the model prediction capability even locally along the time axis. Moreover, sensitivity measures reveal the relative influence of parameters (as input to the dynamic analysis or experiment), also locally along the time axis.
The procedure has been applied to an aircraft high lift system. The training data were generated by virtual experiments, i.e. multi-body dynamics simulations. The surrogate models proved to be very accurate, by the CoP criterion as well as by direct comparison of the reference to the model time series. Unlike the highfidelity simulation, the meta-models are very fast to compute, allowing e.g. for fast stochastic analyses in the scope of predictive reliability analysis. The models were also successfully implemented as software-in-theloop into an experimental environment for real-time dynamic tests at the Airbus site.
Further developments are planned which will focus on more detailed model assessment and model improvement, locally in the time and parameter space. The range of application for this procedure is not limited to the above mentioned. Signals can be any xydata, so fast surrogate models can be obtained, e.g., also for spectral analyses both in the low and high frequency domains, stress-strain curves of a material law etc. The field meta-models can also serve as digital twins which, fed by sensor data, monitor or control electronic appliances or machines.
Acknowledgments
This work was partially financed by the German Federal Ministry of Economics and Energy, call LUFO 5.1, grant number 20Y1301E, which is gratefully acknowledged by the authors.
The authors also express their gratitude for the contributions by Thomas Topsch, Tobias Ulmer, Achim¨ Lenz, Airbus Operations, Bremen; Sonke Klostermann,¨ Mario Cappitelli, Airbus Group Innovations, Hamburg; Viktor Lebsak, MSC Software, Munchen and¨ Michael Neumann, P3 group, Hamburg.
- Kunath, V. Bayer, R. Niemeier, “Predictive reliability with signal based meta-models” in 18th International Conference on Thermal, Mechanical and Multi-Physics Simulation and Experiments in Microelectronics and Microsystems (EuroSimE), Dresden Germany, 2017.
- Forrester, A. S´obester, A. Keane, Engineering Design via Surrogate Modelling, Wiley 2008.
- Vogt, “Effektive Visualisierung Stochastischer Simulationen”, Der Andere Verlag 2010.
- Bayer, U.E. Dorka, U. Fllekrug, J. Gschwilm, “On real-time pseudo-dynamic sub-structure testing: algorithm, numerical and experimental results” Aerospace Science and Technology, 9(3), 223–232, 2005.
- Most, J. Will, “Metamodel of Optimal Prognosis – an automatic approach for variable reduction and optimal metamodel selection” in Proc. Weimar Optimization and Stochastic Days 5.0, Weimar Germany 2008.
- Most, J.Will, “Sensitivity analysis using the Metamodel of Optimal Prognosis” in Proc.Weimar Optimization and Stochastic Days 8.0, Weimar Germany, 2011.
- Vanmarcke, Random Fields: Analysis and Synthesis, MIT Press 1983.
- Bucher, Computational Analysis of Randomness in Structural Mechanics, Structures and Infrastructures Book Series Vol. 3, CRC Press 2009.
- Ghanem, P.D. Spanos, Stochastic Finite Elements – a Spectral Approach, Springer 1991.
- E. Brenner, “Ein Beitrag zur Zuverl¨assigkeitsanalyse von Strukturen unter Ber¨ucksichtigung von Systemuntersuchungen mit Hilfe der Methode der Stochastischen Finite Elemente”, Ph.D. (Dr. tech.) Thesis, Leopold Franzens Universit¨at Innsbruck, 1995.
- Bayer, J. Will, “Random Fields in Robustness and Reliability Assessment of Structural Parts” in 15. VDI Kongress Berechnung und Simulation im Fahrzeugbau SIMVEC (in German with English abstract), Baden-Baden Germany 2010.
- Most, “Effiziente Parameteridentifikation fr numerische Simulationsmodelle”, in NAFEMS Konferenz: Berechnung und Simulation, Bamberg Germany, 2014 (in German)