Development of Indicators for Technical Condition Indexing of Power Transformers

Adv. Sci. Technol. Eng. Syst. J. 3(1), 148–154 (2018);
 DOI: 10.25046/aj030118
Reliable operation of a power transformer with a certain load depends on the technical condition of individual construction parts and the ability to prevent defects that can cause a failure. During the lifecycle of a transformer, valuable data is constantly accumulated, which forms the basis for technical or risk assessment of the equipment. Therefore it also serves as a ground for the decisions on further operation, or repairs, or replacement. To achieve this goal, data need to be systematized. Since technical condition indexing allows combining various types of data including results of diagnostic tests is used within the framework of this research. As part of a larger risk assessment methodology, algorithms for two indicators are proposed in this paper, and they are based on results of electrical measurements and analysis of oil parameters, respectively. The novelty of the algorithms for indicators introduced in this paper is based on analysis of features specific to the power system in Latvia such as large proportion of aged transformers, low loading level, significant variation in oil volumes, and statistics on typical faults. Proposed limits of parameters are verified with data from operation history. Taking into account the differences in the measurement periodicity, the indicator that is based on electrical measurements assesses the individual constructive parts of the transformer (windings and core, bushing and on-load tap changer) separately, whereas the other, indicator combines the results of oil parameters into a single assessment. These indicators were verified by using 30 transformers from the Latvian power system and the obtained results coincide well with the operation history.
1. Introduction
This paper is an extension of the results disseminated in the international conference paper relating to the development of risk indicator for power transformers based on electrical measurements [1]. This risk indicator is part of a condition indexing algorithm that allows categorizing a large volume of technical data obtained during operation and maintenance of a power transformer into discrete risk categories. It provides information in a fast and systematic way, so that transformers can be easily compared and critical ones can be selected for further investigation.
The main goal of this extended paper is to present an algorithm for determining the numerical value of the indicator based on results of electrical measurements (EM indicator), as well as for establishing the numerical value of the indicator based on results of oil parameters analysiss. The outcome for both indicators is the risk category derived on a scale from 1 (lowest risk) to 5 (highest risk, outage expected or immediate action necessary). The proposed indicators correspond to diagnostic tests regularly performed on power transformers in Latvian transmission system. However, significant differences in the periodicity of oil checks and electrical measurements determined the disparate structure of both algorithms and the mathematical methods selected.
The proposed indicators have been verified with 30 case studies. Results of diagnostic tests both from transformers that required repairing, and transformers in a normal operation condition were used. The authors express their gratitude to the Latvian Transmission System Operator (Augstsprieguma tikls, JSC) for providing data for the case studies.
Different approaches are applied to develop appropriate and efficient algorithms for technical condition index which includes such common power transformer parameters as oil characteristics, dissolved gas analysis and electrical measurements [2].
Artificial neural networks (ANN) and adaptive neuro-fuzzy inference system (ANFIS) models, for instance, are no longer limited just for diagnosing faults and aging of power transformers. These models can also be used to quantify the general condition of a power transformer [3], also as synthetic risk assessment methods [4] and fuzzy logic [5].
The different diagnostic tools and methods, periodicity and power system charchteristics are actually driving the need to develop a unique, expert-made assessment models for a certain power system. The novelty of the algorithms for indicators introduced in this paper is based on analysis of features specific to the power system in Latvia such as large proportion of aged transformers, low loading level, significant variation in oil volumes, and statistics on typical faults. Proposed limits of parameters are verified with data from operation history. The algorithms provide evaluation of the main constructive parts of a power transformer, and also the structure of indicator algorithms is planned as adjustable, if the amount of applied diagnostics tests is changed.
2. Technical Condition Index as a Part of Risk Matrix
Configurations of the risk matrix proposed for Latvian power system within the framework of this research is shown in Figure 1, and can be effectively used to evaluate each power transformer in the system, as well as to plan the maintenance or replacement of aged units. Risk matrix is divided into 3 parts, where green indicates a low-risk with no concern, blue indicates a moderate risk region or a transformer in a normal operation and technical condition, whereas the red region indicates a need for immediate action. The greatest attention will be paid to 4 cases depicted in Figure 1, that fall in the high-risk region.
In Figure 1, the ordinate axis of the risk matrix, shows operation characteristics and it is based on such important parameters as transformer age, load, maintenance history, the existence of monitoring system, importance in the system (as additional option). Three indicators are used to determine the technical condition index. Together with scoring and weighting factors it is depicted as a value on abscise axis of the risk matrix. Parameters used to determine the technical condition index are given in Table 1 and they correspond to diagnostic tests regularly performed on power transformers in Latvian transmission system.
The algorithm of the indicator based on dissolved gas analysis (DGA) is provided in [6]. It is based on assessment of 7 key gases shown in Table 1 and includes analysis of features specific to the power system in Latvia where power transformers are aged and variations in oil volumes are significant. Transformer loading, operation of the on-load tap changer (OLTC), and oil treatment are also taken into account in order to quantify this indicator.
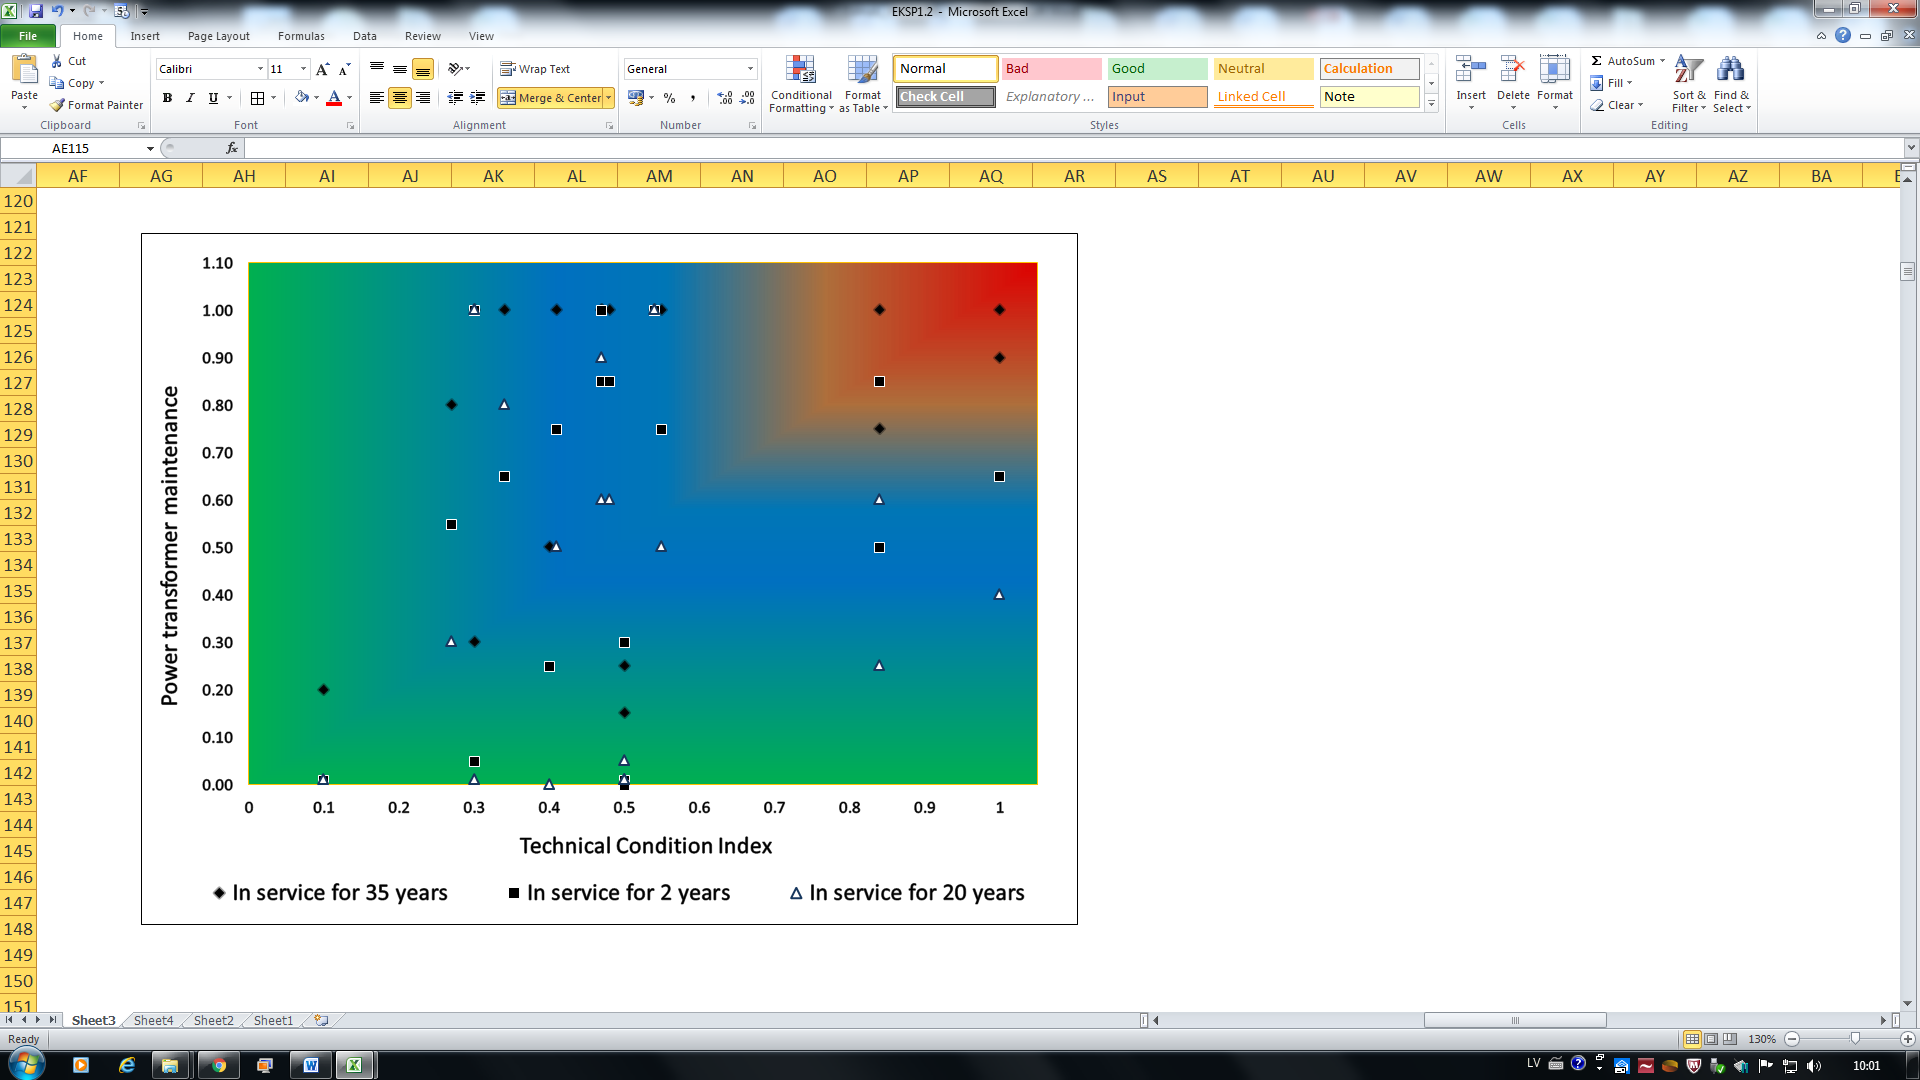 Figure 1. Proposed configuration of risk matrix
The indicator based on electrical measurements for technical condition indexing of a power transformer is developed by evaluating separately 3 main parts of a power transformer: windings, bushings and OLTC. A failure of any of these parts may be critical for a power transformer, the surrounding equipment, environment and even service personnel. The indicator based on analysis of oil parameters such as flash point, dissipation factor, acidity and moisture content is developed as a combined approach of binary and fuzzy logic which allows evaluating the risk on basis of several oil parameters as a single entity.
Both indicators are described in detail in the following chapters of this article.
Table 1. Indicators for technical condition indexing
| Electrical measurements | |||
| Windings
and core |
Bushings | OLTC | |
| Power factor, PF | Power factor, PF | Static resistance, SR | |
| Insulation resistance, Rm | Insulation resistance, Rm | Transition time & current ripple from dynamic resistance measurement (DRM) | |
| Short-circuit impedance, Zk | Capacitance, C1 | ||
| No-load losses, P0 | |||
| Transformer oil | |||
| Oil analysis | DGA | ||
| Dissipation factor | H2, CH2 | ||
| Flash point | C2H4 C2H6 | ||
| Moisture content | C2H2 | ||
| Acidity | CO, CO2 | ||
3. Development of Electrical Measurement Indicator
3.1. Winding and core
Power factor, insulation resistance and short-circuit impedance allow verifying the technical condition of transformer windings, whereas variations in no-load losses reflect the condition of a transformer core.
A flowchart of a multi-step algorithm is shown in Figure 2. where scoring system for windings and core as a part of the EM indicator is derived on a scale from T=1 (lowest risk) to T=5 (highest risk, outage expected).
The first step is input of measured parameter values from test reports: insulation resistance (Rm), power factor (PF), short-circuit impedance (Zk), no-load losses (P0), and winding temperature readings from a thermometer on a transformer.
Next step is data processing. As a reference point, it requires data from the factory test report for a particular power transformer, as well as background information such as age, rated voltage, etc. This information is stored in a specific technical file that is prepared for each transformer in the system. This file is also used for other condition indexing indicators. Since the technical file contains limits for the evaluation of parameters shown in Table 2, modifications are restricted.
During data processing the input data are modified into a suitable form for further analysis. PF values from the test report are calculated at base temperature of 20 ̊C. Thus the limits proposed in Table 2 and stored in the technical file can be applied for risk evaluation (E1 indicates low risk, and E5 – high risk). PF limits are based on recommendations provided in the standard IEEE C57.152-2013. On basis of maintenance experience, additionally value for level E5 were specified. PF=1.5% at 20 ̊C is an effective parameter for detecting high risk since moisture and contamination of windings in this case in practice proved to be too high for reliable operation. Another parameter used for high risk detection is the Dt coefficient. It is a ratio between the measured resistance and rated voltage of high voltage winding (Rm/Un). Coefficient Dt=1MW/kV at base temperature of 20 ̊C is set as the minimum insulation resistance limit [7]. For further analysis, values from the factory test report Rfact adjusted to base temperature are used as reference to evaluate if the decrease of measured Rm is acceptable.
Limits for evaluation of short-circuit impedance Zk are based on [8] and given in Table 2. Two values of Zk between phases should be within E4 of each other. Lager deviation can indicate on mechanical deformation of windings. A single-phase connection no-load losses P0 measurement is a test that has been historically used for evaluating the magnetic system of power transformers in Latvia. A specific feature is that different test voltage is used (either 220V or 380V). It causes difficulties if evaluation is based on traditional comparative analysis to a factory test. In order to use results of a single measurement in this algorithm, limits based on statistical data and recommendations of [9] and performed study of measurement history of no-load losses from 100 transformers [1].
3.2. Bushings
Electrical measurement results can provide information about degradation of bushing insulation and help to avoid potential failures, such as bushing explosion and transformer winding deformation. Flowchart for bushing assessment is given in Figure 3, and evaluation process is similar to the windings assessment described before. Although a 3-level scoring system is proposed as more suitable for bushings as more polarizing. It starts with evaluation of results of PF measurements for bushings by applying respective limits from Table 2. for data from test reports are used for input. The input is followed by the next step – data processing where all data are modified in a suitable form just like in the algorithm for windings and the core part.
Table 2. Limits of parameters included in EM indicator
| Parameter | Level | ||||||
| E1 | E3 | E4 | E5 | ||||
| Windings and core | |||||||
| PF, %, at 20 ̊C | <0.5 | 0.5 | 1 | ≥1.5 | |||
| P0 phase-phase, % | P0 A-B>40 P0 A-B<20
P0 A-C>4 |
||||||
| Zk phase-phase , % | ≥3 | ||||||
| Bushings | |||||||
| PF, %, at 20 ̊C | <0.5 | ≥1 | |||||
| On Load Tap Changer | |||||||
| SRph-ph, % | <2 | >2
(at least in 3 taps) |
≥5 | ||||
| Transition time, tt, ms | <100 | ≥200 | |||||
| IN1,2, % | 60 | ||||||
If the measured PF value is above the limit E5 as it shown in Table 2 or the rated capacitance C1 of a bushing differs from factory measurement by more than 10 %, to reduce the risk of failure, it is advisable to remove the bushing from service [10].
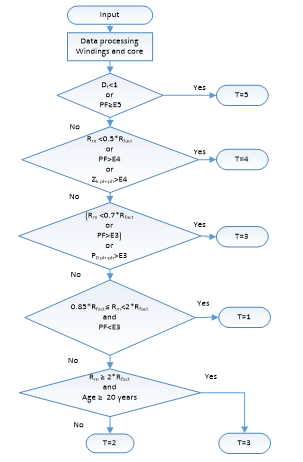 Figure 2. The algorithm of EM indicator for windings and core
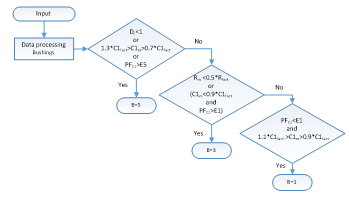 Figure 3. The algorithm of EM indicator for bushing
3.3. OLTC
The static resistance measurement (SRM) is an important tool in this industry and it is used to check for loose connections, broken strands, as well as high contact resistance in tap changer. For decades, SRM is performed for each tap in the tap changer for all power transformers in Latvia and the experience is significant. Therefore SRM is included in the OLTC algorithm as the exclusion rule which can only indicate if the risk is low or high. For input in Figure 4, SRMs of all phases and all taps are assessed without the factory test report results; therefore the technical file is not needed.
In accordance with [11], the agreement with limit E5 indicates on high risk and it is an important signal to consider the need to repair tap changer immediately. If the SRM difference between phases is within the limit E1, it indicates on low risk. If resistance in 3 taps exceeds the limit E1, it should be investigated and TC=4 is assigned.
Dynamic resistance measurement (DRM) allows detecting defects caused by contact coking, contact wear, oil-film layer deposition, deviating transition times, contact timing problems, maintenance errors and damaged transition resistors. Therefore as additional criterion for the OLTC assessment – the dynamic resistance measurement (DRM) is proposed [1] evaluating two parameters form test report: transition time, ms, and current ripple change IN1,2, %. The proposed limit values E1 and E5 shown in Table 2 are assigned on basis of [12] research and were verified by authors with analysis of 76 test reports of DRM.
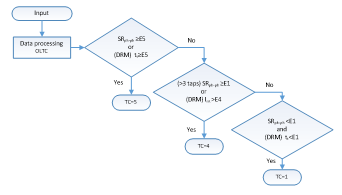 Figure 4. The algorithm of EM indicator for OLTC
4. Development of Oil Indicator
4.1. General description of oil indicator algorithm
Generally mineral transformer oil is used in power transformers in power system of Latvia. Regularly measured oil parameter are dielectric strength, moisture content, acidity, dielectric dissipation factor, interfacial tension, viscosity, flash point, and sludge content. Method for assessment of the measurement results described in the national standard involves comparison of data obtained in laboratory with the given assessments limits, and conclusions are obtained for each oil parameter separately rather than as a single entity. The standard does not provide guidance on how to obtain one conclusion based on multiple contradicting input parameters.
Fuzzy logic is widely applied for dissolved gas analysis (DGA) of power transformers [13, 14] since DGA contains relatively many input parameters. If binary logic is used a contradiction can occur, where some of the input parameters correspond with a good condition but others with a bad condition. Fuzzy logic can provide more detailed assessment of technical condition. For example, fuzzy logic based algorithm with acidity and interfacial tension of oil as input parameters is used to estimate remnant life of a power transformer [15]. Similar approach of data processing is described in [16] in which remaining service life of transformer in years is predicted based values of viscosity, resistivity, particle count, acidity and moisture content of oil. Another research [17] shows the possibility to combine measured values of moisture and acidity of oil, and the power factor of the winding to determine the type of transformer defect based on the physical and chemical condition of insulation in cases with contradicting input data values.
Therefore within the framework of this research fuzzy logic as data processing method is used to develop a technical condition indicator for a power transformer based on measurement results of oil parameters. Four independent oil parameters (flash point, dissipation factor, acidity and moisture content) and additional parameter (changes in flash point value in two subsequent measurements) are used as input data as shown in Figure 5. Limits shown in Table 3 are based on typical values observed for transformers installed in transmission network in Latvia. As a result, algorithm calculates the value of transformer oil indicator within limits from K=1 – (low risk) to K=5 (high risk, immediate actions required).
Flash point (FP) is the lowest temperature at which oil in certain conditions releases such amount of vapour that, together with air, creates a flammable mixture leading to fire hazard. Therefore, this parameter is proposed for indicating high risk. Based on practical experience in decision-making for transformer repairs dissipation factor (tanδ) is proposed as another parameter indicating high risk since it is sensitive to oil aging, moisture, as well as changes in contamination levels.
Table 3. Proposed Limits for Oil Parameters
| Flash point, oC | Upper limit | Acidity, mgKOH/g | Moisture content, ppm | Tand, % |
| 125 or ³Δ5 in 2 subseqent measurements | Level 1 | <0.05 | <5 | <1 |
| Level 2 | ≤0.075 | ≤10 | ≤2.5 | |
| Level 3 | >0.1 | >15 | >4 |
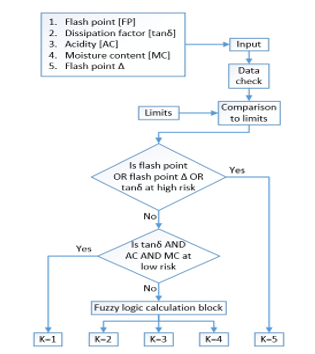 Figure 5. Overall flowchart of oil indicator algorithm
Dissipation factor tanδ along with acidity and moisture content are proposed as criteria for medium risk evaluation. In order to reach a unified conclusion regarding the correlation between these independent oil parameters, the use of fuzzy logic is suggested.
The operation of the algorithm begins with reading the input parameters, namely results from the most recent oil measurement which then are stored in technical file that is prepared for each transformer in the system for possible repetitive usage. If any of the necessary oil parameters have not been measured in this particular testing, the algorithm assumes the value of that parameter as in Level 2 (see in Table 3).
If the value of the parameter is repeatedly unknown, the approximation is performed in a logarithmic scale as shown in Figure 6 where approximated value aims for the Level 3, yet cannot reach it, since the difference from the maximum boundary is halved per iteration.
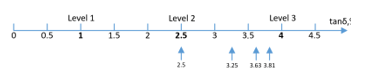 Figure 6. Assumed values for unknown parameter value
Next step of the proposed algorithm is the evaluation of exclusion cases indicating high risk (either flash point or changes in value of flashpoint or dissipation factor exceeds the limits of Level 3) or low risk (values of dissipation factor and moisture and acidity are all below limits of Level 1). Fuzzy logic calculation block activates if neither of the exception cases checks included in the algorithm is positive.
4.2. Fuzzification
Developed shape and slope for membership functions used within fuzzy logic calculation block of proposed algorithm is shown in Figure 7 originally, the selection of membership function shape and slope was carried out for each of the three oil parameters. Illustration of membership function for tand is shown in Figure 8. The triangle and trapeze forms were tested for M (medium risk) membership function, whereas slope was altered for L (low risk) and H (high risk) membership functions. All variations were tested by using the results of oil tests for 10 transformers with given maintenance history and different technical condition.
Results show that output values are not affected by the shape of M membership function, however, in some cases value changes were observed by alteration of the slope of L and H membership functions. After evaluation it was concluded that the combination of increased H membership function effect has the best correlation with technical condition based on maintenance history.
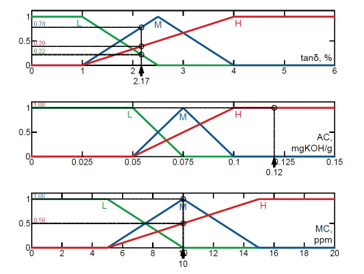 Figure 7. Membership functions of oil indicator
For obtaining corresponding output values, a rulebox is created as shown in Table 4. It contains all possible combinations. Altogether, there are 27 combinations, since for each of the 3 input parameters used in the fuzzy logic block 3 membership functions are assigned. The specific weight value is the minimum of all three membership values for a given combination. The specific weights are summed together for each result value and thus a fuzzified output is obtained. Afterwards, the gravitation centre of this output function is calculated. The obtained result is more precise, as more points are used for the calculation.
4.3. Fuzzy inference and defuzzification
An example is illustrated in Figure 7 with following values of oil parameters as input data from regular oil sample test of a particular 110 kV transformer: flash point, 139oC; changes in flash point value between two subsequent measurements, 2oC; dissipation factor tanδ, 2.17%; acidity, 0.12mgKOH/g; moisture content, 10 ppm. Since exception cases included in the algorithm are negative in this case fuzzy logic calculation block activates.
Table 4. Rulebox for fuzzy logic calculation block
| # | Input Variables | Corresponding output | # | Input Variables | Corresponding output | # | Input Variables | Corresponding output | ||||||
| tanδ | AC | MC | tanδ | AC | MC | tanδ | AC | MC | ||||||
| 1 | L | L | L | 2 | 10 | H | M | L | 3 | 19 | L | M | H | 3 |
| 2 | M | L | L | 2 | 11 | H | L | M | 3 | 20 | M | M | H | 3 |
| 3 | L | M | L | 2 | 12 | H | M | M | 3 | 21 | H | H | L | 4 |
| 4 | L | L | M | 2 | 13 | L | H | L | 3 | 22 | H | H | M | 4 |
| 5 | M | M | L | 2 | 14 | M | H | L | 3 | 23 | H | L | H | 4 |
| 6 | M | L | M | 2 | 15 | L | H | M | 3 | 24 | H | M | H | 4 |
| 7 | L | M | M | 2 | 16 | M | H | M | 3 | 25 | L | H | H | 4 |
| 8 | M | M | M | 2 | 17 | L | L | H | 3 | 26 | M | H | H | 4 |
| 9 | H | L | L | 3 | 18 | M | L | H | 3 | 27 | H | H | H | 4 |
The membership of dissipation factor is 0.78, 1 for acidity and 0.5 for moisture content. The specific weight is calculated as 0.5. This process is repeated for each matching combination. The gravitation centre of this output function is calculated, as well as the position of gravity centre on x axis is estimated as shown in Figure 9. The third of the position of gravity centre is the result and final output, in this case K=4 for oil indicator is obtained, which indicates a rather high operation risk.
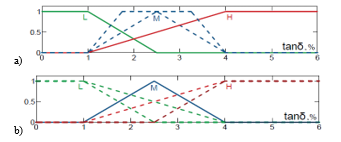 Figure 8. Selection of the shape and slope for membership functions for tand:
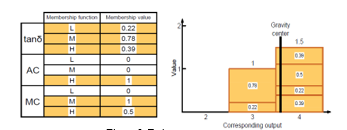 Figure 9. Estimation of output value
5. Verification of EM and Oil Indicator
Results of measurements within a time period of 8 years for 30 power transformers are used to verify both indicators and see how they complement each other. It has to be noted that the power transformer park in Latvia is aged and power transformers installed between 1967 and 2000 were used for verification with different technical condition, repairing plans and failure rate. Figure 10 shows numerical values of EM and oil indicator obtained for the latest available measurement set of each transformer. Since polarized score is used omitting the values 2 and 4 for bushings and 2 and 3 for OLTC the combined score 3&4 is allocated in a separate column. Mainly a numerical value of 1 was assigned to parameters OLTC and bushings which reflects timely scheduled repairs. In those two cases where score value of 5 is assigned for bushings immediate decisions to replace them have been made by system operator. Similarly OLTC is repaired immediately if there1 is a variation from normal operation or a problem is detected.
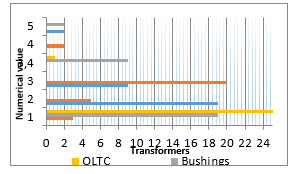 Figure 10. Numerical values of indicator parameters of 30 power transformers
Values 2 and 3 are obtained most frequently for oil analysis most showed result 2 and 3, which indicates either normal operation or marks out necessity for small maintenance works such as the change of silicagel in a thermosyphon. In two cases when score of 4 for winding and core is assigned result dramatic decrease of winding isolation resistance and increase of power factor therefore obtained results concise well with operation history.
For further analysis 4 cases from 30 were selected to illustrate how indicators together reveal the technical condition of a power transformer. Cases 1 to 3, plotted in Figure 11, depicts the latest measurements available for three different transformers. Case 2 reflects a transformer in an almost perfect technical condition. But in case 1, problems with OLTC can be noticed and analysis of measurement history revealed increased static resistance in 3 taps. Case 3 reveals bushing defect, caused by decreased insulation resistance in scheme C2 and increased power factor in scheme C1.
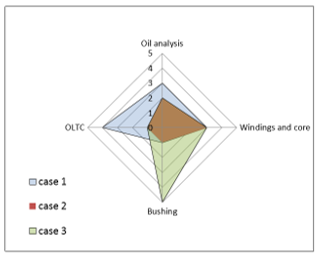 Figure 11. Case studies results
Since electrical measurements are performed on average once in four years EM indicator is more static. Case 4, plotted in Figure 12, illustrates the role of the oil indicator as the first implication of a possible fault in a transformer since its results are more dynamic. It can be observed that technical condition of this particular transformer has decreased due to increase in moisture level over the years.
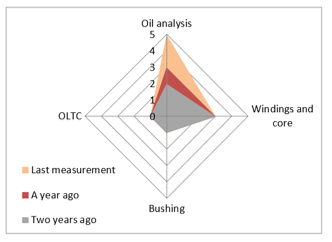 Figure 12. Oil analysis results
6. Conclusions
Literature review leads to a conclusion that methods for risk assessment of power transformers are mainly based on the results of performed diagnostic measurements and operation history. Since maintenance strategy may vary over the time and may depend on decisions by a particular transmission system operator the development of a modified risk matrix is a common global practice.
Configuration of risk matrix for power transformers in Latvian transmission network proposed within the framework of this research is composed of three regions indicating low risk, moderate risk and high risk the last one requiring immediate action. The place of a transformer within the risk matrix depends on its technical condition index (x-axis) and such parameters of operational history as transformer age, load, maintenance history, importance in the system (y-axis). Technical condition index is established by calculating the numerical values of the three indicators and applying a scoring and weighting factor.
To determine numerical values of the indicator based on oil analysis combined approach of binary and fuzzy logic proved to be successful since it allows evaluating risk based on several oil parameters as a single entity. Results from a verification confirm that higher output values are shown by transformers that have already attracted attention in practice. As oil analysis is done quite often, changes in values of this indicator are first indication of a possible defect in a transformer and they substantiate the necessity for further testing. However, an indicator based on results of electrical measurements more effectively serves to detect faulty constructive parts more effectively and can be used as a basis for decisions on replacement of a bushing or repairs of an OLTC.
- Poiss, S. Vitolina, “Development and Implementation of Risk Indicator for Power Transformers Based on Electrical Measurements”, 18th International Scientific Conference on Electric Power Engineering (EPE), Czech Republic, Kouty nad Desnou, 17-19 May, 2017, pp.425-428.
- Haema, R. Phadungthin, “Development of Condition Evaluation for Power Transformer Maintenance”, 4th International Conference on Power Engineering, Energy and Electrical Drives, Istanbul, Turkey, 13-17 May 2013.
- Hamed Zeinoddini-Meymand, Behrooz Vahidi, “Health index calculation for power transformers using technical and economical parameters “, IET Science, Measurement & Technology, Volume: 10, Issue: 7, 10 2016.
- Dun Lin, Yao-Yu Xu, Yu Liang, Yuan Li, Ning Liu, Guan-Jun Zhang, “A Risk Assessment Method of Transformer Considering the Economy and Reliability of Power Network”, 1st International Conference on Electrical Materials and Power Equipment (ICEMPE), Xi’an, China, 2017.
- P. Lata, Diego. P. Chacón-Troya , R. D. Medina, “Improved tool for power transformer health index analysis”, IEEE XXIV International Conference on Electronics, Electrical Engineering and Computing (INTERCON), 2017.
- Poiss, “Development of DGA Indicator for Estimating Risk Level of Power Transformers,” 17th International Scientific Conference on Electric Power Engineering (EPE 2016), Prague, 16-18 May, 2016.
- AStitch in Time: The Complete Guide to Electrical Insulation Testing, Dallas: Megger, 2006.
- Scope and norms of testing electric equipment (in Russian), RAO “UES of Russia”, RD 34.45-51.300-97, 1997.
- Kaganovich E. A., Reichman I. M., Power transformer tests up to 6300 kVA and voltages up to 35 kV, (in Russian), Energia, 1980.
- Electric Power Transformer Engineering, Third Edition, James H. Harlow CRC Press, May 16, 2012 by CRC Press693 pages.
- “IEEE Guide for Diagnostic Field Testing of Fluid-Filled Power Transformers Regulators and Reactors,” IEEE Std. C57.104, 2013.
- J. Erbrink, E. Gulski, J. J. Smit, R. Leich, B. Quak, and R. A. Malewski, “On-load tap changer diagnosis-an off-line method for detecting degradation and defects: Part 2,” IEEE Electr. Insul. Mag., vol. 27, no. 6, pp. 27-36, 2011.
- Abu-Siada, S. Hmood, and S. Islam, „A New Fuzzy Logic Approach for Consistent Interpretation of Dissolved Gas-in-Oil Analysis,” IEEE Transactions on Dielectrics and Electrical Insulation, vol. 20, pp. 2343 – 2349, 2013.
- Nemeth, S. Laboncz, and I. Kiss, „Condition Monitoring of Power Transformers using DGA and Fuzzy Logic” on Proc. 2009 IEEE Electrical Insulation Conference, Montreal, Canada, May 31-June 3, 2009, pp. 373-376
- S Forouhari, and A Abu-Siada, „Remnant Life Estimation of Power Transformer Based on IFT and Acidity Number of Transformer Oil” on Proc IEEE 11th International Conference on the Properties and Applications of Dielectric Materials (ICPADM), Sydney, Australia, July 19-22, 2015, pp. 552-555.
- K. Kori, A. K. „Sharma, and A. K. Singh Bhadoriya, Intelligent Diagnostic Method for Ageing Analysis of Transformer,” Energy and Power Engineering, Vol. 4 No. 2, 2012, pp. 53-58
- C. Flores, E. E. Mombello, J. A. Jardini, G. Ratta, and A. M. Corvo, „Expert system for the assessment of power transformer insulation condition based on type-2 fuzzy logic systems,” Expert Systems with Applications, vol. 38, pp. 8119-8127, 2011.