Applying Machine Learning and High Performance Computing to Water Quality Assessment and Prediction

Adv. Sci. Technol. Eng. Syst. J. 2(6), 285–289 (2017);
 DOI: 10.25046/aj020635
Water quality assessment and prediction is a more and more important issue. Traditional ways either take lots of time or they can only do assessments. In this research, by applying machine learning algorithm to a long period time of water attributes’ data; we can generate a decision tree so that it can predict the future day’s water quality in an easy and efficient way. The idea is to combine the traditional ways and the computer algorithms together. Using machine learning algorithms, the assessment of water quality will be far more efficient, and by generating the decision tree, the prediction will be quite accurate. The drawback of the machine learning modeling is that the execution takes quite long time, especially when we employ a better accuracy but more time-consuming algorithm in clustering. Therefore, we applied the high performance computing (HPC) System to deal with this problem. Up to now, the pilot experiments have achieved very promising preliminary results. The visualized water quality assessment and prediction obtained from this project would be published in an interactive website so that the public and the environmental managers could use the information for their decision making.
1. Introduction
This paper is an extension of work of “Applying Parallel Programming and High Performance Computing to Speed up Data Mining Processing”, originally presented in the 16th IEEE international Conference on Computer and Information Science, 2017 [1]. Water quality is an important issue. Not only can the drinking water directly influence our body as about 70% of the human body is made up of water, the natural water is also an important part as people like to have some entertainment activities near lakes or rivers. Nowadays the prediction of river or lake water qualities is more and more important. The traditional way to assess water quality is analyzing the water attributes’ value. If the value is in a certain range, the quality of water can be classified. This is an easy and fast way, but it can only be used for assessment. To predict water quality, scientists need to use the chart to show the changes of an attribute in a period of time. This is a statistic way and can predict water quality in a relatively accurate way. The problem is it takes lots of time to analyze the water attributes and it can only predict a long period of time’s water quality. As the results are analyzed by people, increasing water attributes for analyzing will greatly increase the workload [2, 3, 4, 5, 6, 7].
In this research, we use machine learning algorithm on water quality prediction. By applying machine learning algorithms, the increasing water attributes and cases are no longer a big problem. Compared with the traditional way, using machine learning can deal with a great number of data in a short time. It can also slightly reduce the human error on the analysis phase. The idea of implementation is not very complex. First, we use the K-MEANS algorithm to classify the data. The K-MEANS algorithm is a very basic, easy and important clustering algorithm. In this research, we specify K is 5, which means we want to classify the water data into five clusters to represent five water qualities from good, relatively good, medium, relatively bad, and bad. By analyzing each cluster’s center; we will know which cluster represents what water quality. After that, we use the C5.0 algorithm to generate a decision tree [8]. In this research, we use five or seven water attributes for classification.
2. Significance
As water quality is more and more important, not only scientists but also the general publics are interested in the future natural water quality. Thus, the request to predict natural water quality like weather forecast is getting stronger. Unlike weather forecast which can use satellites to get, we can’t use several satellites to cover a large area to collect water data. The data needs to be collected by observations in different places. It also takes far more time to analyze the data so that people can make a water quality prediction. The United States is a country with many rivers and lakes. The government has already established many water observations to monitor the water system of the country [9]. Collecting data is not so difficult. Making predictions in an efficient way is the key problem.
For this research, the most significant part is it completely uses the data from currently operational observations. This means the hardware cost of prediction is greatly reduced. As long as an observation station can provide enough data, this method can be used to predict water quality. By using machine learning technology, we can deal with a great amount of data in a short time, which can make water quality analyze very quickly. Although these kinds of water quality analysis may not be as accurate as biology analysis, it is accurate enough for water quality forecast to the generate public [10]. Compared with the traditional way for water quality research, the human factors in this research is relatively low. This can slightly reduce the possibility of human error.
3. Design and Implementation
There are four steps in this research: data selection, data preprocessing, classification, and assessment and prediction. The first two steps are preparing a suitable data for classifying. Step three is to make the classifications. It will be implemented by the K-MEANS algorithm. Step four will generate different decision trees for assessment and predicting by using the C5.0 algorithm.
Data selection is very important. This step is the root of this research. As this is a machine learning research, a “good” data definitely can greatly affect the results. The “good” here means it needs to have enough cases, enough attributes, and less missing data. Enough cases can ensure the number of training data. The accuracy of classifications is based on the number of training data. The more cases we have, the better the classifications will be.
The data we used was from the USGS website. USGS keeps the daily water data from 10472 observation sites all over the United States. Many of the sites keep about four attributes of the water. After checking all the sites keeping at least seven attributes, we finally choose the site numbered 08070200. This site is in San Jacinto River in Texas and the data is still updating till now. It keeps 7 attributes of the water, and has few missing values. In this research, we choose the data between 11/22/2005 and 09/08/2012 which has 2483 records [9].
The second step is data preprocessing. We made the data more meaningful for use. It included resetting the extreme data, and normalizing the data. To deal with the extreme data, we put the entire data of one attribute on a scatter chart and find the extreme value. Fig. 1 is an example of original “discharge” value shown in a chart. The x-axis represents different cases and the y-axis is value. It is very clear that the maximum value of discharge is about 8000. If we use these values directly and normalize them, the problem is most normalized value will be 0. This is definitely not good for classification as it cannot reflect the data distribution. To solve this problem, the idea is set all values greater than an “extreme value” to be equal to this “extreme value”. In Fig. 2, we use the same data in Fig. 1 but set all values greater than 700 to be equal to 700.
Fig. 2 looks better than Fig. 1. It now can reflect the changes and distribution of the discharge. A problem here is how to set the “extreme value”. In Fig. 2, we can see that there is not too much difference if we set the extreme value to 600 compared with 700, as most value are under 200. The key point is we do not want to change too much value as changing data is a kind of human factor. Making the charts have better data distribution with the least changes is the role of the extreme value. In this attribute, totally 136 values have been affected by setting the extreme value to 700, which is about 5% of the total 2483 values.
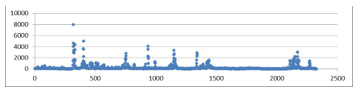 Figure 1, the original scatter chart of the discharge in this research. All values are either the original values or calculated values.
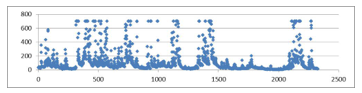 Figure 2, the new discharge chart which set all values greater than 700 to be equal to 700.
The third step of this research is classification. We want to classify the data into five clusters (classifications). Each cluster represents a certain water quality range from very bad, bad, medium, good, to very good. The method for classification is to implement the K-MEANS algorithm. The K-MEANS algorithm is a very basic but important algorithm for classification. It treats every node in an N-dimensional space. Each dimension represents an attribute. In this research, we used seven attributes, so each record was a node in 7-dimension spaces. We first gave five initial centers. Then based on the distance of each node and each center, we assigned every node a group. After that, we recalculated the distance of every node inside one group to move the center. So we repeated the iteration of assigning groups and moving centers until the distance between the new center and the previous center was smaller than a “quit distance” or the new center moved to a previous center node.
The last step of this research was assessment and prediction. Before we could make the assessment and prediction, the very first thing was to analyze which group represents what kind of water quality. This can be done by analyzing the center node’s attributes. We needed to look up some references and some criteria of water. This was not easy but also not hard. The results of classification actually were the results for water quality assessment. We already classified the data into five groups. We could make a water quality assessment by generate a decision tree.
The main topic was how to make prediction. Before we could make the decision tree, we needed the training data. The format of the training data we used to generate the decision tree was “attributes” plus “classification results”. If the training data was “day 1’s attributes” plus “day 1’s classification result”, it was used to generate a decision tree for assessment. So, we “shifted” the classification results by 1day. The training data would be like “day 1’s attributes” plus “day 2’s classification result”. This data can generate a decision tree for prediction. Fig. 3 shows how to “shift” the data. In this way, we lose one day’s case as the last day only has attributes. This is a basic way for prediction. It uses previous 1day’s attributes for prediction. An improved way is using more than 1 day’s attributes. We first created an additional attribute which made the first line look like “day 1’s attributes” plus “day 1’s attributes” plus “day 2’s classification result”. Then we shifted it to “day 1’s attributes” plus “day 2’s attributes” plus “day 3’s classification result”. This was using previous 2 days’ attributes to predict the third day’s water quality. In our research, we used up to previous 8 day’s attributes to predict the ninth day’s water quality to see if the results have any improvements. This does not mean the more the better. In fact, adding more day’s attributes is the same with adding water attributes. It can increase the data interference, which will increase the difficulty to generate the decision tree and reduce the accuracy of prediction.
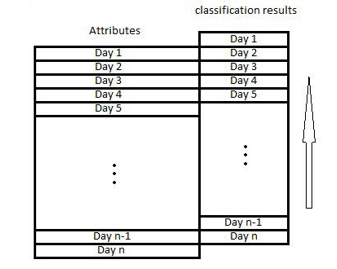 Figure 3, the idea of how to “shift” the classification result.
After preparing the training data, we used See5.0 to generate a decision tree. See5.0 is a software tool which implements the C5.0 algorithm. It can deal with a great amount of data in a short time and generate the decision trees by the classic method, the winnow method, and the boost method. It generates a decision tree and gives the importance of every attribute. Most times all attributes are used. If one attribute has not been used by the C5.0 algorithm, very often this attribute may have a linear relationship with some other attributes [9].
4. Result and Analysis
The results analysis of this research is based on the prediction accuracy. Among the 2483 records, the even records are used as training data to generate decision tree, the odd records are used as testing data. We tested the decision tree by testing data to get the prediction error rate.
The accuracy for assessment was quite good. Using the winnow method, the prediction accuracy was 93.5% by using seven attributes and 93.6% by using five attributes. Dissolved oxygen, turbidity and PH were mainly used attributes for assessment. The usage of temperature was relatively low, which shows the way we normalized the temperature reasonable. Using boost method, the prediction accuracy was 96.1% by using 7 attributes and 95% by using five attributes. The results of boost method show increasing attributes can increase the prediction accuracy.
The prediction has 32 results into 2 groups. One group used five attributes to predict, another group used seven attributes to predict. In this way, we can know if increasing attributes can improve the prediction accuracy. Both the winnow and the boost methods are used for test. One group have 8 tests differed by using different number of day’s attributes.
Table 1 is the result for group 1. It shows the error rate for prediction the next day’s water quality by using five attributes to classify the data into five classifications. Table 2 is the result for group 2. It shows the error rate for prediction the next day’s water quality by using seven attributes to classify the data into five classifications. All the results above are the test error rate assigned by See5.0. Based on these results, we can change the data from error rate to prediction accuracy as an alternative.
Table 1, the error rate of predict the next day’s water quality by using 5 attributes and 5 classifications. W stand for winnow method and B stand for Boost method.
| Predict 2nd Day | Predict 3rd Day | Predict 4th Day | Predict 5th Day | ||||
| W | B | W | B | W | B | W | B |
| 19.1% | 16.5% | 19.4% | 17.1% | 19.6% | 16.9% | 20.7% | 17.0% |
| Predict 6th Day | Predict 7th Day | Predict 8th Day | Predict 9th Day | ||||
| W | B | W | B | W | B | W | B |
| 22.8% | 16.1% | 21.2% | 17.0% | 21.4% | 17.0% | 22.6% | 16.9% |
Table 2, the error rate of predict the next day’s water quality by using 7 attributes and 5 classifications. W stand for winnow method and B stand for Boost method.
| Predict 2nd Day | Predict 3rd Day | Predict 4th Day | Predict 5th Day | ||||
| W | B | W | B | W | B | W | B |
| 19.6% | 18.1% | 21.2% | 16.8% | 20.2% | 16.9% | 20.3% | 16.9% |
| Predict 6th Day | Predict 7th Day | Predict 8th Day | Predict 9th Day | ||||
| W | B | W | B | W | B | W | B |
| 21.5% | 16.6% | 21.1% | 16.0% | 22.1% | 17.7% | 20.7% | 16.3% |
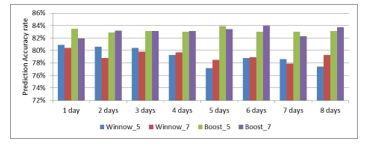 Figure 4, Prediction accuracy of two different methods and using different number of attributes on predict the next day’s water quality to 5 classifications.
Figure. 4 shows the prediction accuracy for each method using different attributes. It proves the great performance of boost method. We can see using seven attributes has better performance. The winnow method seems to have no great difference. The boost method, however, shows the advantage of using seven attributes. Out of eight tests, five tests show using seven attributes can reach a better performance than using five attributes. Also using the boost method reaches the highest prediction accuracy, which is 84% by using previous six day’s attributes to predict the next day’s water quality.
This figure also shows some interesting results. As we mentioned before, increasing more day’s attributes may not improve the prediction accuracy. Actually, these eight tests are all used to predict the next day’s water quality. With the increase number of attributes, the prediction accuracy of the winnow method, generally speaking, is reducing. This is because data interference. No matter we increase the number of single day’s attributes or we increase the number of days we use for prediction; they have same effect for the winnow method. When the attributes’ number is greatly increased, the difficulty to generate the decision tree also increasing tremendously. The boost method, however, doesn’t take too much effect from data interference. As each decision tree make a slightly improvement based on the previous decision tree’s error, the “vote” mechanism can greatly reduce the data interference and has a better performance.
5. High Performance Computing Speed up the Processing
In this project, we were running machine learning program on Purdue University’s High Performance Cluster – Falcon, which has 8 nodes, each with 4 CPUs, and/or Miner, which has 512 nodes, each with 4 CPUs. This high performance computing (HPC) system is supported by the Northwest Indiana Computational Grid (NWICG) program funded by the U.S. Department of Energy grant ($4.9 million). Taking advantage of the NWICG’s HPC system, it is practical for us to use complexity to exchange the water quality prediction accuracy. HPC dramatically decreases the running time of the enumeration based algorithm, which is time consuming but more accurate.
Facilitated perfectly by the current existing Northwest Indiana Computational Grid, the project has applied the HPC system which dramatically decreases the running time of the enumeration based algorithm, so that makes this very time-consuming algorithm for water quality prediction becoming practical.
Up to now, the experiments of this innovative approach obtained very promising results. The sixteen-processor HPC system achieved more accurate water quality prediction and reduced the execution time by more than ten times. The experiment results showed applying machine learning models on HPC system is a very encourage direction for Northwest Indiana’s water quality assessment and prediction.
In light of almost 3000 cases, the optimal enumerative algorithm is very time-consuming (running in days) when executing on a single machine. In order to improve the performance, we applied parallel programming on the enumerative algorithm. The program run on multi-processors in parallelism. The parallel computing assigned one process as the master process and others as slave process. The master process read in the data, broadcasted the data and other information to the slave processes. The parallel programming split the clustering calculation into threads for slaves. Each slave process worked on calculations for clustering. Finally, the master processor received the results from each slave process and chose the global optimized clustering [11, 12, 13].
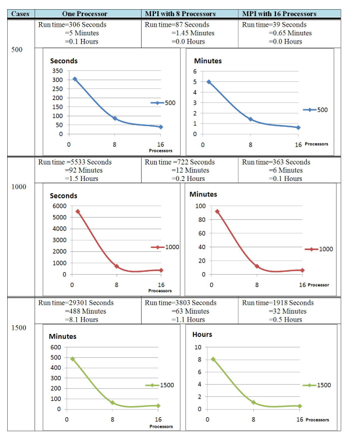 Figure 5, Experiment results with MPI on the HPC
Our experiments compared the running time of the enumerative algorithm using a single processor with that using HPC with 8 processors and 16 processors. The number of the cases was 500, 1000, 1500, 2000, 2500, and 2700 respectively. Figure 5 and Figure 6 below show the execution time of our preliminary experiments. It exposed the critical role of HPC for the time consuming enumerative algorithm to process large amount of data. For example, for 1500 cases, running on a single processor, it took more than eight hours to finish the clustering; whereas running on HPC with 16 processors, it only took about 32 minutes. This improvement of execution time is critical, because it is important to have a reasonable amount of indicative and representative data samples (cases) in order to discover patterns in data samples using machine learning technologies. It is not unusual to have a data set of 1500 cases by this approach.
The results of these experiments produced a solid fundamental for future developments in our water quality assessment and prediction project. We created decision tree employed C5.0 for the water quality assessment and prediction. Using the produced decision trees to predict unseen cases, the prediction accuracies reach 82 percent, two percent better than applying k-means algorithm and about the same improvement than applying the mechanistic simulation models. It is anticipated that if we use more attributes of the water quality in the future, the accuracy rate could be further improved.
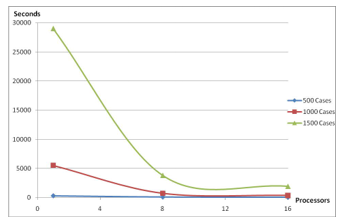 Figure 6, Execution time in seconds for comparison of various processors in HPC
6. Summary and Conclusion
In this research, by applying machine learning algorithm to a long period time of water attributes’ data; we can generate a decision tree so that it can predict the future day’s water quality in an easy and efficient way. The idea is to combine the traditional ways and the computer algorithms together. Using machine learning algorithms, the assessment of water quality will be far more efficient, and by generating the decision tree, the prediction will be quite accurate. The drawback of the machine learning modeling is that the execution takes quite long time, especially when we employ a better accuracy but more time-consuming algorithm in clustering. Therefore, we applied the HPC System to deal with this problem. Up to now, the pilot experiments have achieved very promising preliminary results. The visualized water quality assessment and prediction obtained from this project would be published in an interactive website so that the public and the environmental managers could use the information for their decision making.
- Ruijian Zhang, “Applying Parallel Programming and High Performance Computing to Speed up Data Mining Processing”, Proceedings of the 16th IEEE international Conference on Computer and Information Science, May 2017.
- Faruk, D. “A hybrid neural network and ARIMA model for water quality time series prediction” Appl. Aritf. Intel., 23, 586-594, 2009. https://doi.org/10.1016/j.engappai.2009.09.015
- M. He, Z. L. He, “Water quality prediction of marine recreational beaches receiving watershed baseflow and stormwater runoff in southern California”, Water. Res., 42, 2563-2573, 2008. https://doi.org/10.1016/j.watres.2008.01.002
- Labiosa, J. Leckie, R. Shachter, D. Freyberg, J. Rytuba, “Incorporating Uncertainty in Watershed Management Decision-Making: A Mercury TMDL Case Study” in Watershed Management Conference, Williamsburg, Virginia, United States, 2005. https://doi.org/10.1061/40763(178)125
- Said, “The Implementation of a Bayesian Network for Watershed Management Decisions” Int. Ser. Prog. Wat. Res., 20, 591–605. 2005. https://doi.org/10.1007/s11269-006-3088-z
- Shrestha, F. Kazama, “Assessment of surface water quality using multivariate statistical techniques: A case study of the Fuji river basin, Japan” Environ. Modell. Softw., 22, 464-475, 2006. https://doi.org/10.1016/j.envsoft.2006.02.001
- A. Stow, M. E. Borsuk, K. H. Reckhow, “Nitrogen TMDL development in the Neuse River watershed: An imperative for adaptive management”, Water Resources Update, 122, 16–26, 2002.
- See 5.0 [Computer software]. Australia: Rulequest Research, 2012.
- USGS Water-Quality Data for the Nation. USGS Water-Quality Data for the Nation from U.S. Geological Survey, U.S Department of the Interior, http://waterdata.usgs.gov/nwis/qw
- Tong, W. Chen, “Modeling the relationship between land use and surface water quality”. Environ. Manage., 66, 377-393, 2002. https://doi.org/10.1006/jema.2002.0593
- C. Severance, K. Dowd, High performance computing, 2nd Edition, 1998.
- Stellner, “Cocheck: Checkpointing and Process Migration for MPI”, Proceedings of International Conference on Parallel Processing, Hawaii, USA, 1996. https://doi.org/10.1109/IPPS.1996.508106
- L. Vaughan, A. Skjellum, D.S. Reese, F.C. Cheng, “Migrating from PVM to MPI, Part I: The Unify System”, Frontiers of Massively Parallel Computation, McLean, Virginia, United States, 1995. https://doi.org/10.1109/FMPC.1995.380476