Measurement of the Bridge Surface Deflections Using Near-Field Amplitude of Secondary Radiators System
 , Yevhen Poliakov 1, Andrii Lebedynskyi 1, Viktor Ivanov 2, Ruslan Pashchenko 2
Adv. Sci. Technol. Eng. Syst. J. 2(6), 217–224 (2017);
 DOI: 10.25046/aj020626
In remote measurements on large-sized objects main focus is on measuring deformations of bridge surfaces and determination of the dynamic amplification factor in particular. The proposed method estimates deflections of entire lower surface of a bridge due to placement of secondary radiators on this surface. Antenna array directivity pattern (ADP) is distorted during deflection of the bridge surface. ADP distortions contain the information about deflections of the individual points of the surface. Minimization of the distance in a functional space with a quadratic metric (the functional) between a distorted measured ADP and theoretical one allows us to determine these deflections. The main problem is measurement of the secondary radiators system ADP in far zone which often cannot be achieved for real bridges in practical situations. Therefore, a new method for determining surface deflections based only on field amplitude measurements in near-field zone of a secondary radiators system is considered in the article. This amplitude of field strength depends on the bridge surface deflection. The modulus of difference between the normalized amplitude distribution of the measured field at the outputs of the receiving array elements, which is created by the radiators system of an unloaded bridge, and the similar amplitude field distribution of a loaded bridge is minimized and deflection of the bridge at the points of the radiating elements placement is calculated.
1. Introduction
This paper is an extension of the work originally presented in the International Conference on Antenna Theory and Techniques [1].
In engineering practice, an important place is taken by measurements of surface deflections of large-sized objects. The dynamics of these deflections can serve as a basis for diagnosing the objects’ state. Deflection measurements for lower part of the surface are one of the most important actions in maintenance of bridges. For this purpose, contact sensors are usually mounted directly on the lower part of the bridge. The installation of contact sensors and transducers interrupts traffic on the bridges and can be time-consuming. Non-contact measurements on bridges which are carried out remotely have recently become an alternative to the contact ones. The analysis of remote method for estimating bridge surface deflections was carried out in [1]. It is based on measurement of the antenna directivity pattern (ADP) distortion of the radiators which are installed on the lower surface of a bridge.
2. Modern Methods of Bridges Surface Deflections Measurement
Let us consider the methods of deflection measurements on bridge structures. The number of deflection measurement methods has increased essentially in the last decade. Bridge safety monitoring is based, in a great extent, on measurements of deflections that become indispensable for this aim. New technologies include intelligent robots that feature a high speed of measurement and precision, laser image deflection measurement, GPS satellite-surveying systems, electro-optical imaging deflection, wireless inclination sensor systems [2, 3] and techniques of digital image correlation between images of undeformed and deformed configurations [4]. In [5], for measuring deflection and vibration of bridges a ground-based interferometric radar is suggested. The maximum measurement range is equal to 1000 m and the errors of displacement radial component can reach 0.1 mm. Most of the proposed methods are expensive or very expensive.
The main characteristics of any bridge are dynamic amplification factor (DAF), bridge natural frequency and bridge acceleration [6]. The dynamic amplification factor can be evaluated as the maximum total load effect divided by the maximum static effect [7]
 where – maximum dynamic response which is usually determined as vertical deflection of the bridge surface due to dynamic loads (for example, moving vehicles), – maximum deflection under static loads (for example, immovable vehicles).
In [8], an optimal scheme for measuring DAF of a bridge using radar is proposed. This radar measures the phase of reflected electromagnetic wave in noisy environments. In its turn, the phase depends on deflections of the bridge surface.
Increased measurement accuracy can be provided by using measuring devices which operate on the different physical principles. An optimal scheme for determining bridge surface deflection by measuring it simultaneously with a mechanical sensor and radar has been developed in [9]. Practically, operation quality of such scheme does not depend on noise or interference. Since radar-based methods use phase measurements that are sensitive to moving both bridge and earth surfaces, seismic fluctuations of the earth surface reduce the accuracy of the deflections measurement due to traffic, for example. In addition, DAF estimation (1) involves measuring static and dynamic deflections that are separated in time due to technological reasons. This fact imposes strict requirements to stability of radar frequency that increases the cost of a measuring system.
Consequently, all modern measuring technologies for bridge structures can be divided into three groups. The first group includes the use of radar systems of millimeter and optical ranges of electromagnetic waves [10-15] for estimation of deformations and deflections of bridge elements, including stay-cables which support the buildings. For this purpose, in particular, phase interferometers with a high-resolution range are used. These systems measure dynamic characteristics of bridge structures at local points. The second group includes the use of opto-mechanical systems of technical vision [16-18] followed by image processing based on developed algorithms, which allows to analyze the dynamics of bridge structures in distributed areas. These methods do not determine the DAF. The third group is based on application of the algorithms for processing GPS data with Kalman filtration to obtain the value of the bridge DAF [19].
DAF measurement is performed at one point of the bridge structure. To measure it at another point, it is necessary to change the direction of the main maximum of the transmitting and receiving antennas directivity pattern. The existing measuring methods are not able to estimate the dynamics of deflection changes in the entire lower surface of the bridge. In order to fix that, a system for deflection measurements on the lower surface of a bridge by creating, on the surface, an equidistant linear antenna array that re-radiates the incoming electromagnetic wave was proposed in [1] (Figure 1). When the surface is bent due to the process of bridge loading, the radiators also move together with it and the ADP is distorted.
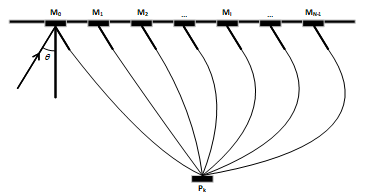 Figure 1: The system of secondary radiators on the lower part of a bridge surface
The antenna directivity pattern is measured in far zone of the antenna and then it is compared with the undisturbed one which was previously measured in the absence of deflections on the unloaded bridge. The integral of square of the difference between the two ADPs creates a functional which depends on the displacements of the secondary radiators at the deformed surface. Minimization of this functional by the method of global random search (using a genetic algorithm) leads to estimation of all the displacements of radiators and, consequently, the deviation of the points on the bridge surface. A similar method is used in [20] for antennas synthesis and even earlier in solving the inverse problem of measurement in linear inertial systems or systems with memory [21].
Let us consider this method. In [1], the authors have developed the functional,
 in which is a deflection of the surface at the point of the secondary radiator placing, – the measured ADP of the radiators system from which the theoretical ADP of the same system, that is described in (2), is subtracted.
For an unloaded bridge and both ADPs (measured and theoretical ones) must be matched, as a result . In practice, there always are almost constant static deflections of the bridge surface and many other factors that lead to a discrepancy between these ADPs. In the process of calibration, minimum values of the functional (2) close to zero are reached. After loading a bridge , there may be a difference between the two ADPs of the radiators system. Minimization of the functional (2) using a genetic algorithm results in the determination of unknown deflections . It should be known, however, that formula (2) is the only one and has unknown deflections. Since the dependence of the functional (2) on the deflections in the – dimensional space is complicated, it is possible to find a non-global, but a local minimum of (2) which leads to incorrect (“phantom”) solutions of the deflections determination. One or more of them may have an abnormal meaning. Since the deflections were fixed during the simulation, the “phantom” solutions could easily be distinguished from the correct ones. As shown in [1], when the ratio of the distance between the radiators to the wavelength exceeds 0.5, a certain probability of “phantom” solutions begins to appear. It may reach a value of 0.6 with an increase in the ratio to one and more. The reason for this phenomenon is the appearance of array diffraction maxima and increased number of the local extrema in the search space of genetic algorithm. Consequently, “phantom” solutions can be almost completely eliminated by rational choice of the ratio of the radiating antenna array. In addition, the use of a priori information about surface deflections reduces their probability significantly, even when the ratio is large. This information is often known from previous bridge research or can be obtained by other methods, for example, using the measurements made by mechanical sensors.
It should be noted that instead of passive secondary reflectors, one can use the antenna array of active radiators located at the same points. However, the cost of such system is probably higher.
3. Results of Experimental Research
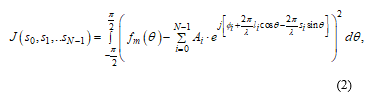
For experimental verification of this effect, a “Kredo” coherent-pulsed radar with an electromagnetic wave length of 1.8 cm and a pulse duration of 0.4 μs (Figure 2) was used. The experimental setup also included a digital oscilloscope DSO-2250, USB (analogue-digital converter (ADC) with a sampling frequency of 100 MHz) and a laptop. In Figure 2a, a photo of a radar sounding path is shown, in Figure 2b – the placement of the angle reflectors against the background of a reinforced concrete wall, and in Figure 2c – the experimental installation. At a distance of 0.7 m from a reinforced concrete wall and at a height of 1.5 m, the array of five secondary radiators in the form of triangular horns (Figure 2b) was constructed; the distance between horns was equal to 1.5 m. The length of the horn side was 30 cm, and its depth was 15 cm.
The analog radar signals reflected from the horns were received by a mirror antenna, converted to the intermediate frequency and arrived at the input of the amplitude detector. The signal from the output of this amplitude detector entered the ADC of the oscilloscope, was converted into a digital code, and then into a text file (file with extension .txt), which is available in various computer mathematical packages.
To estimate the amplitude of reflected signals, an informative signal (Figure 3) consisting of 200 points was cut out from a long signal (5000 points). It corresponded to the distances at which the angle reflectors were located. In Figure 3, a blanking signal (long, up to a distance of approximately 80 m) which corresponds to the duration of the sounding signal is displayed initially and then a signal (of a shorter duration), that describes the amplitude of the signal reflected from the horns, appears.
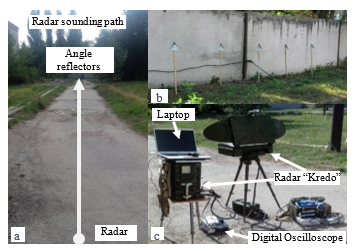 Figure 2: Photographic scheme of the experiment:
radar sounding path (a); placement of the angle reflectors (b); general view of the experimental installation (c)
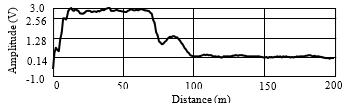 Figure 3: Distance distribution of amplitude of the signal received from angle reflectors
During the experiment the following positions of the angle reflectors were considered: a reinforced concrete wall without reflectors (variant 1); five reflectors on the same line (Figure 2b) (variant 2); one central reflector that was shifted forward by 20 cm (variant 3); two reflectors (central and next to the right) were shifted forward by 20 cm (variant 4); three reflectors (central and two next to the right) were shifted forward by 20 cm (variant 5); one reflector (rightmost) has been moved forward by 10 cm, two reflectors (central and next to it to the right) were shifted by 20 cm forward (variant 6); two rightmost reflectors were shifted forward by 10 cm, the central reflector was shifted by 20 cm forward (variant 7); three reflectors (central and two next to it to the right) were shifted forward by 10 cm (variant 8).
The reflected signals for the above-mentioned variants of the angle reflectors positions were recorded 10 times and then their values were averaged. The obtained experimental data were used to estimate the amplitude of the signals that were reflected from the angle reflectors with different placements relative to each other. The total field amplitude of secondary radiation of the horns at a range of 85 m was measured using the radar. The field amplitude at the radar receiver output was changed if any radiator was shifted in the radial direction (toward the radar location), that shows its sensitivity to movements of the radiators. For example, in the above-described variants, the experimental values in volt of the field amplitude were as follows: 1.16, 1.30, 1.39, 1.51, 1.39, 1.48, 1.40, 1.34. The shape of ADP of the secondary radiators system in experiments was not measured.
4. New Method for Estimating Bridges Surface Deflections
The problem of determination of the bridge surface deflections, described above, is technically complicated. The practical measurement of ADP for the secondary radiators system causes the greatest difficulty. First, we need to measure the field amplitude dependence on the angular coordinate, and it is not easy to do near a real bridge. Secondly, the measurements should be made in the far-zone of antenna at distance , calculated as two squares of antenna size divided by the wavelength . For example, if and , then 6 km and this value of far-zone distance is impossible for practice. Of course, with increasing wavelength and surface dimensions, whose deformation is measured, there are other problems associated with, for example, the efficiency of radiation of the passive elements of array. Consequently, practical application of the method presented in [1] is limited by the conditions of bridge sounding.
This problem can be solved on the basis of the amplitude-phase distribution measurement in the near-field zone of the antenna and obtaining the ADP of the radiators system on the basis of these measurements. Such problems were solved by many authors, for example, [22]. In practice, high-precision measurements of the amplitude and phase of the field in real weather and other conditions are complicated and expensive which reduces the value of this approach. Consequently, simpler methods of remote measurements of bridge surface deflections are required. This forces us to give up high-precision measurements of the amplitude and phase in the near-field zone of antenna.
The main idea of this article is to use only amplitude measurements in the near-field zone of the radiators system. The obtained data do not allow to determine the ADP but our task is to estimate only the bridge surface deflections. In this case, there is no need for complex operations of ADP measuring. Instead of these operations, we use a linear receiving antenna consisting of receiving elements, for example, horns located at points (Figure 4) at the same distance from each other.
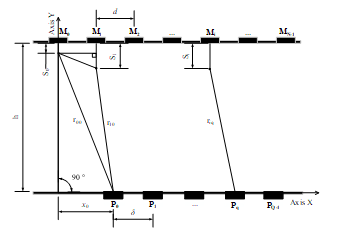 Figure 4: The layout of the receiving antenna array elements (points ) relative to the radiating elements position (points )
The receiving element is located from the transmitting element at a distance which is easily determined from the geometry of Figure 4:
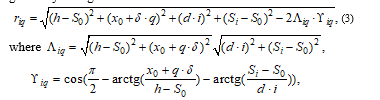 where
where
h – distance between the lower surface of a bridge and array of receiving elements placed in parallel to the transmitting array;
Si – amplitude of a bridge surface deflection at the points , i. e. in locations of radiators;
– distance between the origin of the coordinates and the first in order of the receiving element .
The complex amplitude of field strength at the output of each q receiving element is the sum of the fields created by all transmitting elements and is determined by the known formula [23] which for this case has the following form
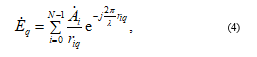 where – amplitude and phase of the field, which is created by the radiator (further, for simplicity, initial phase field is taken equal to zero, i. e. ).
We believe that all secondary radiators ADPs are equal and wide so that the extreme elements of the transmitting array irradiate all elements of the receiving array by energetically equivalent waves. The amplitude of the field in the simulation was the same. Thus, the distance (3) makes the largest contribution to the total amplitude distribution of field strength. The amplitude of the field created by the secondary radiators at an unloaded bridge is determined similarly (4)
 where the upper index “0” indicates variables describing the position of radiators on an unloaded bridge, the surface shape of which is not necessarily a plane. These variables are easy determined before carrying out measurements. Due to the specificity of the problem geometry (Figure 4), the amplitudes of field strength will be different at the output of every receiving element. After the bridge loading the deflections in accordance with formula (4) can substantially change the amplitude of the field at the outputs of receiving elements, especially when small wavelengths are used. Before measuring, it is very difficult to calculate the amplitude-phase distribution of the field along the transmitting array, especially in the case of electromagnetic wave reflections from the concrete base of the bridge, various supporting elements, etc. For simplicity, but without loss of physical meaning, a uniform amplitude and phase distribution of the field is used. Thus, the field amplitudes at the outputs of the array receiving elements depend only on the distances containing the deflections. The simulation was carried out in several stages:
- Determination of the field amplitudes at the outputs of the receiving elements of the array for an unloaded bridge, provided that the distances are given;
- Measurement of deflections by mechanical sensors. In this article the typical values of bridge deflections were set by authors;
- Determination of the field amplitudes at the outputs of the array receiving elements for a loaded bridge, provided that the distances and the deflections are specified.
Thus, amplitudes of the field at the outputs of receiving elements of the array for an unloaded bridge and a loaded one were obtained in the simulation process for different conditions. It was further assumed that the deflections , which were previously given, are now unknown. To determine these deflections and compare them with the given ones or for this case with reference deflections, a functional was composed:
![]() It is minimized with the help of a genetic algorithm by variations on . As a result, the “unknown” values of the bridge surface deflections were determined.
It is minimized with the help of a genetic algorithm by variations on . As a result, the “unknown” values of the bridge surface deflections were determined.
5. The Simulation Results
In Figure 5, 6 normalized field amplitudes at the outputs of the receiving antenna array elements located at distances m (Figure 5) and m (Figure 6) from the lower surface of a bridge are presented. The length of the electromagnetic wave was cm. Similar figures for the wavelength cm are shown in Figures 7, 8.
 Figure 5: Normalized field amplitude at the outputs of the array receiving elements for an even (solid line) and deformed (dotted line) bridge surfaces for
 Figure 6: Normalized field amplitude at the outputs of the array receiving elements for an even (solid line) and deformed (dotted line) bridge surfaces for
 Figure 7: Normalized field amplitude at the outputs of the array receiving elements for an even (solid line) and deformed (dotted line) bridge surfaces for
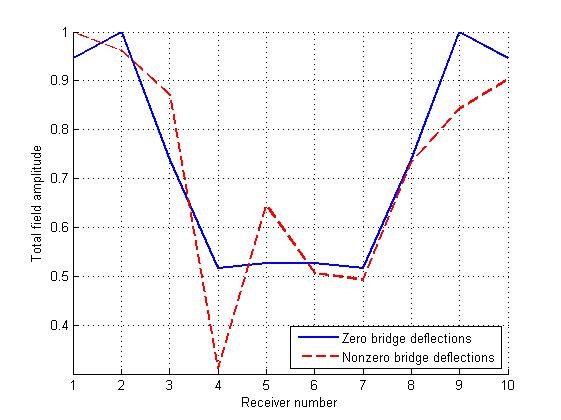 Figure 8: Normalized field amplitude at the outputs of the array receiving elements for an even (solid line) and deformed (dotted line) bridge surfaces for
The genetic algorithm in the process of its work “deforms” the dotted line in such a way that it takes a place of the continuous line. Since the latter is obtained for an unloaded bridge, the algorithm actually reduces existing deflections almost to zero and at the same time determines their absolute values. In this case, the errors of these deflections determination arise. For modeling, the bridge surface deflections in millimeters were selected by authors as follows: 0, 5, 4, 7, 6, 4, 2, 3, 4, 2. The profiles of the deformed bridge surfaces and the profiles of the reconstructed surfaces that were determined by the genetic algorithm, are shown in Figure 9. Between them, there is some discrepancy which was interpreted as an error of deformed surface restoration.
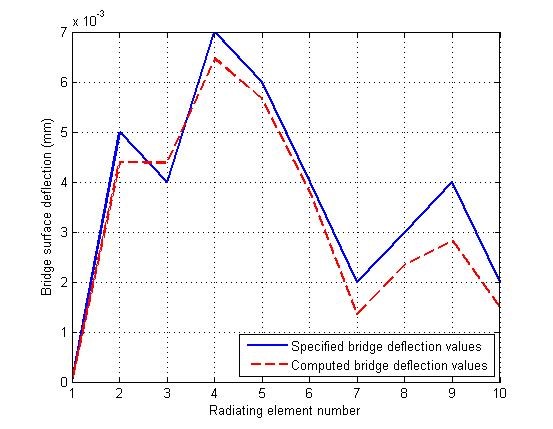 Figure 9: The profile of the deformed bridge surface (solid line) and the profile of the surface that was determined by genetic algorithm (dotted line)
The dependence of relative errors of surface profile restoration on the number of receiving elements in array for different wavelengths is shown in Figure 10.
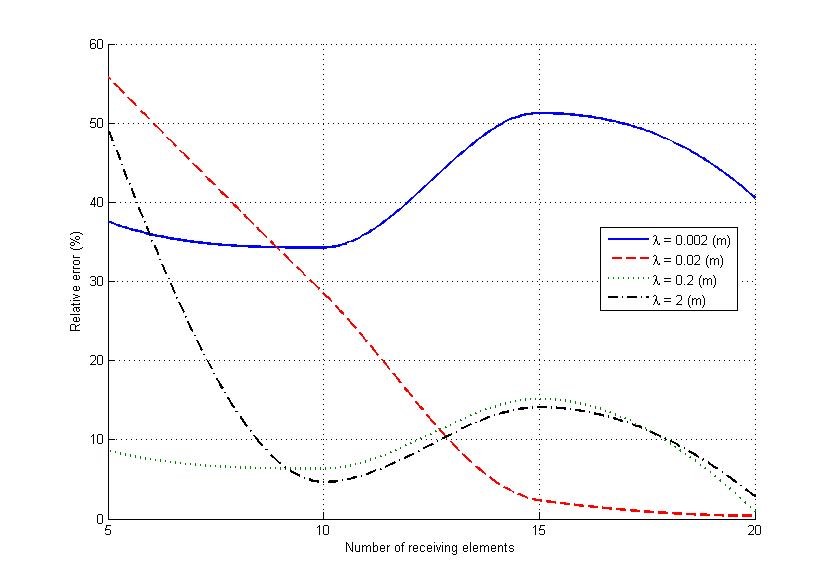 Figure 10: Dependences of the relative errors of the bridge deformed surface profile restoration on the number of receiving elements in array for different wavelengths
In the centimeter and decimeter range of wavelengths the relative errors of bridge surface profile determination are decreased with the increase in array receiving elements number and when the number 10 of receiving elements is exceeded, these errors are less than 10%. This quantity is limited in practice by reception conditions, because the method requires that all elements must receive the radiation from all transmitting elements. Relative error also depends on the wavelength which is used for radiation (Figure 11). The number of receiving elements is equal to 10.
For each bridge the dependence (Figure 11) will be different but there always is a wavelength range which provides the minimum error of the bridge surface deflection determination.
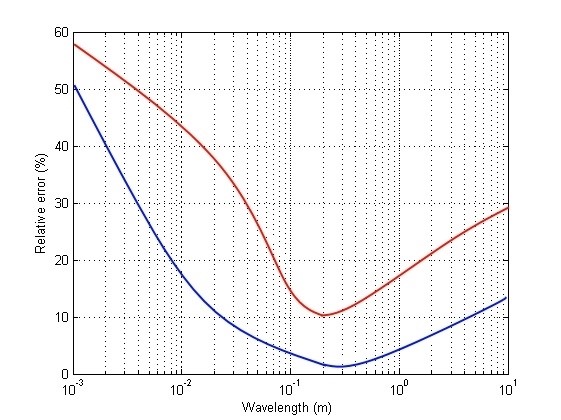 Figure 11: Dependences of the relative errors of the bridge deformed surface profile restoration on the wavelength: blue line – m, m; red line – m, m
Dependence of the relative errors of the bridge surface profile restoration on signal / noise ratio is represented in Figure 12. A deterministic signal describing the field amplitude and a white noise of different intensity were added in simulation. In this case the work of the genetic algorithm for finding the global minimum became more complicated.
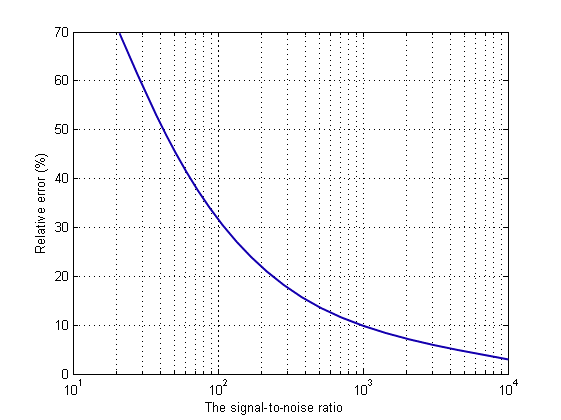 Figure 12: Dependence of the relative error of the bridge deformed surface restoration on the signal-to-noise ratio
The dependence of the “phantom” solutions probability on the ratio , that is, on the electrical distance between the radiators, is shown in Figure 13. Figure 14 demonstrates similar dependence on the number of receiving elements. The wavelength was 20 cm, and the distance between the lower surface of the bridge and the receivers was 50 m.
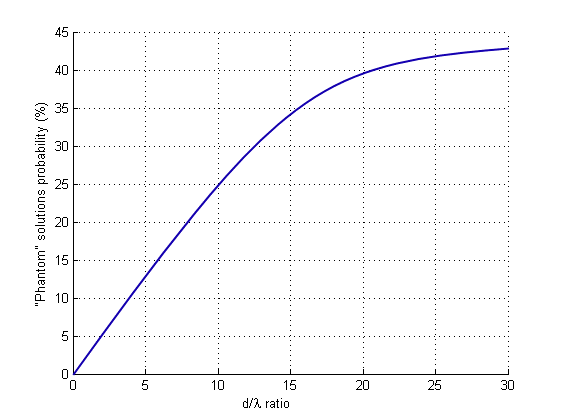 Figure 13: Dependence of “phantom solutions” probability on the ratio
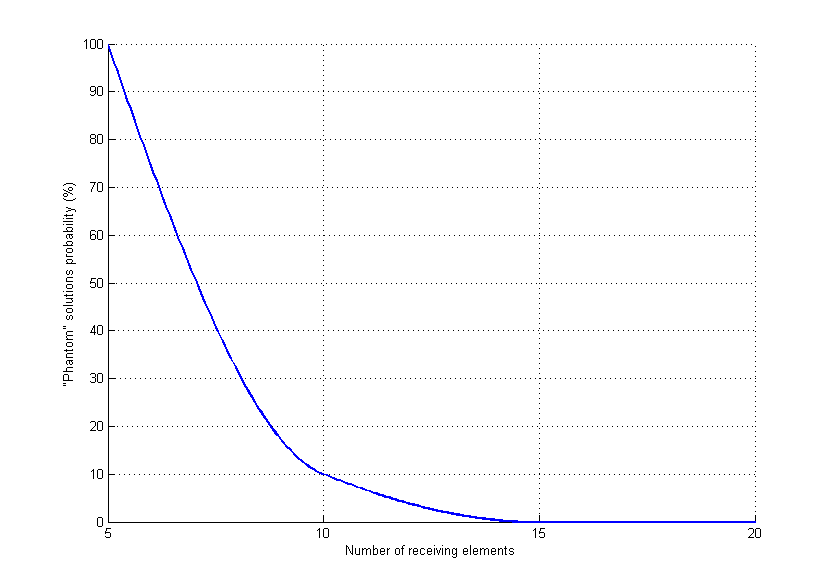 Figure 14: Dependence of “phantom solutions” probability on the number of receivers
The solution was considered as “phantom” one if the error of the bridge deformed surface restoration exceeded 10%. Figures 13 and 14 impose requirements for the number of radiators and receiving elements of the appropriate antenna arrays. Increased number of secondary radiators not only improves the quality of the curved surface profile measurement, but also significantly reduces the probability of the “phantom” solutions.
In the article, the problem of bridge surface deflections determination was solved for simplified conditions in the absence of radio waves reflection from the concrete part of the bridge surface and other parts, neglecting the influence of the steel elements of the reinforced concrete structure, etc. However, one should expect that the approach proposed in the article will not change. Indeed, in the process of the field amplitude measuring at the outputs of receiving elements of the array at an unloaded bridge, all the influencing factors which remain at a loaded bridge, will be taken into account. The difference between these fields appears only in the presence of bridge deflections in the second case. Hence the functional (6) will probably remain the same, that is, the method is expedient to implement in real conditions, too. However, the errors estimation for bridge surface deflections restoration in such conditions remains a challenging problem.
6. Conclusions
New methods for measuring surface deflection of bridges and other large objects were discussed in the paper. It is based on the processing of measurement information about the electromagnetic field amplitude which can be obtained from systems of secondary (passive) radiators (reradiators) or active radiators installed on the lower part of the bridge. The measuring information is obtained at the output of the receiving elements of a linear antenna array which can be installed at any convenient distance from the lower part of the bridge. Minimization of the functional developed in the study allows us to obtain numerical data on the movement of radiators, as well as the deflection of the entire surface of the bridge respectively. The paper defines the conditions under which the errors of deflections restoration in the process of the functional minimizing do not exceed the permissible ones. They depend on the electromagnetic wave length, the geometry of placement of the radiators and receiving elements, as well as on the level of noise in the measurement location. The application of a global random search of the functional extremum (using genetic algorithms) for the global minimum determination in certain situations leads to appearance of wrong (“phantom”) solutions when the genetic algorithm finds the minimums that are not global. Recommendations to limit the probability of obtaining “phantom” solutions to a value of zero were also discussed. A mathematical model of electromagnetic waves scattering was made according to a simplified scheme, which did not take into account the reflection from the concrete surface of the bridge and other elements. The consideration of these factors will not make any significant changes to the principle of surface deflection determination, since in any case surface deflections certainly lead to a change in the field amplitude in the observation point, and these changes are the basis for determining deflections. The sensitivity of the field amplitude to the displacement of secondary radiators is proved in the paper experimentally. The proposed method can be used for determination of deflections of other large objects.
Conflict of Interest
The authors declare no conflict of interest.
- Poliarus O. V., Poliakov E. O., Brovko Ja. S. “Measurement method of the object surface deflections using antennas theory”. – 2017 XI International Conference on Antenna Theory and Techniques ICATT’2017, May 24-27, 2017. – Kyiv, Ukraine, pp. 416-418.
- Yan Yu, Hang Liu, Dongsheng Li, Xingquan Mao, Jinping Ou. “Bridge Deflection Measurement using Wireless MEMS Inclination Sensor Systems”. – International Journal on Smart Sensing and Intelligent Systems, 2013, vol. 6, No1, pp. 38…57.
- Xuefeng Zhao, Hao Liu, Yan Yu, Xiaodong Xu, Weitong Hu, Mingchu Li. “Bridge Displacement Monitoring Method Based on Laser Projection”. – Sensing Technology. – Sensors, 2015, 15, pp. 8444…8463.
- Satoru Yoneyama and Hiroki Ueda. “Bridge Deflection Measurements Using Digital Image Correlation with Camera Movement Correction”. – Material Transactions, 2012, vol. 53, No2, pp. 285…290.
- Kuras, T. Owerko, Ł. Ortyl, R. Kocierz, P. Kohut, K. Holak, K. Krupiński. Comparison of methods for measuring deflection and vibration of bridges. – Proceeding of the Joint international symposium on Deformation monitoring: 2–4 November 2011, Hong Kong, China, 2011, pp. 1..8.
- Pacglite, A. Pacglitis. “The Dynamic Amplification Factor of the Bridges in Latwia”. – Journal Procedia Engineering, 2013, vol. 10, pp. 851…858.
- Brady S. P., O’Brien J. O., Znidaris A. “Effect of vehicle velocity on the dynamic amplification of a vehicle crossing a simply supported bridge”. – Journal of Bridge Engineering, 11 (2), pp. 241…249.
- Poliarus O. V., Barchan V. V. “Radio engineering system for estimating of the dynamic amplification factor of bridge structure”. – Kharkiv: Applied electronics, 2011, vol. 10, c.3, pp. 368…371. (in original:Полярус О. В., Барчан В. В. Радіотехнічна система оцінки коефіцієнта динамічності мостової конструкції. – Харьков: Прикладная радиоэлектроника, 2011, т. 10, No3.)
- Poliarus O. V., Barchan V. V., Poliakov E. O. “Method of accuracy increasing of vibrational displacements measurements for a machine on the basis of measuring system integration”. – Kharkiv: Technology of instrument making, 2012, No1, c. 25…29. (in original: Полярус О. В., Барчан В. В., Поляков Є. О. Методика підвищення точності вимірювань вібропереміщень машини на основі комплексування вимірювачів. – Харьков: Технология приборостроения, 2012, No1, с. 25…29 )
- Carmelo Gentile. “Application of Microwave Remote Sensing to Dynamic Testing of Stay-Cables”. – Remote Sensing, 2010, vol. 2, pp. 36-51.
- Patrick Paultre, Omar Chaallal, Jean Proulx. “Bridge dynamics and dynamic amplification factors – a review of analytical and experimental findings”. – Can. J. Civ. Eng., 1992, No19, pp. 260-278.
- Cheol-Hwan Kim, Byung-Wan and Jin-Taek. “Application of Laser Vibrometer to the Measurement and Control of Cable Tensile Forces in Cable-Stayed Bridges”. – International Journal of Distributed Sensor Networks, 2012, vol. ID 810682, 7 pages.
- Charles R. Farrar, Timothy W. Darling, Albert Migliori and William E. Baker. Microwave Interferometers for non-contact vibration measurements on large structures. – Los Alamos National Laboratory, 2000. – 14 p.
- Larry D. Olson, P. E. Olson. Recent advances in NDE and SHM of bridge superstructure with sonic and radar methods. – FHWA 2010, Nondestructive Evaluations of Bridges, 2010, pp. 1-12.
- Mayer, L., Yanev, B., Olson, L.D. and Smyth, A.W. “Monitoring of the Manhattan Bridge for Vertical and Torsional Performance with GPS and Interferometric Radar Systems”, Proceedings CD, Transportation Research Board 89th Annual Meeting, 2010.
- Piotr Olaszek. ”Investigation of the dynamic characteristic of bridge structures using a computer vision method”.- Measurement, 1999, 25, pp. 227–236.
- Shien Ri, Tatsuro Numayama, Masumi Saka, Kenichi Nanbara and Daisuke Kobayashi. “Noncontact Deflection Distribution Measurement for Large-Scale Structures by Advanced Image Processing Technique” – Materials Transactions, Vol. 53, No. 2, 2012, pp. 323…329.
- “Displacement Measurement of Burr Arch-Truss Under Dynamic Loading Based on Image Processing Technology”. – 6th International Conference on Advances in Experimental Structural Engineering 11th International Workshop on Advanced Smart Materials and Smart Structures Technology August 1-2, 2015, University of Illinois, Urbana-Champaign, United States.
- Kaloop Mosbeh, Li Hui. “Analysis of bridge movements and damage based on GPS monitoring technique”. – Интерэкспо Гео-Сибирь, 2010, вып. 1, т. 1, с.1-5.
- Poliarus O. V., Lebedynskiy A. V. “Methods of studying the antennas synthesis problem in practical lessons”. – X Anniversary International Conference on Antenna Theory and Techniques ICATT’2015, April 21-24, 2015.-Kharkiv, Ukraine. – pp. 87-89.
- Полярус О. В., Поляков Є. О. “Наближене розв’язання оберненої задачі вимірювань та його метрологічне забезпечення”: монографія . – Х. : Видавництво «Лідер», 2014. – 120 с. (in Ukrainian)
- Hirokazu Kobayashi, Yoshio Yamaguchi, Yi Cu. “Simple Near-field to Far-field Transformation Method Using Antenna Array-factor”. – Journal of Wireless Networking and Communications, 2012, No2(4), pp. 43-48.
- Harish A. R., Sachidananda M. “Antennas and Wave Propagation”. – Oxford University Press, 2007. – 411 p.
No related articles were found.