Data Exchange Strategies for Aggregating Geographical Distribution of Demands for Location-Dependent Information Using Soft-State Sketches in VANETs

Adv. Sci. Technol. Eng. Syst. J. 2(6), 175–185 (2017);
 DOI: 10.25046/aj020622
When we drive a car, we often want to know the circumstances of roads between the current location and the destination. Ishihara et al. proposed a Vehicular ad-hoc NETworks (VANET) -based information sharing system, called the Real-Time Visual Car Navigation System, in which a driver can obtain Location-Dependent Information (LDI), such as photographs or videos of his/her Point of Interest (PoI), by telling the onboard device, e.g., a car navigation device, the PoI. The simplest way to provide LDI to vehicles is to flood the LDI to all vehicles, but unneeded LDI may be disseminated, and network resources may be wasted. To disseminate LDI to many vehicles that demand it with low communication traffic, we have proposed a data dissemination scheme based on Demand maps (Dmaps). In this scheme, each vehicle has a Dmap, a data set representing the geographical distribution of the strength of demands for LDI. To keep the Dmap up to date, each vehicle exchanges a subset of data constituting a Dmap (Dmap Information: DMI) with other vehicles. Vehicles preferentially send new LDI or forwarded LDI strongly demanded to the area where the LDI is frequently demanded based on Dmaps. If vehicles frequently send DMI, the accuracy of the Dmap becomes high, however, communication traffic becomes large. In this paper, we propose strategies for controlling the frequency of sending DMI and strategies for selecting DMI to be sent to improve the Dmap accuracy with low communication traffic. Simulation results show that one of the proposed strategies, the LDI Transfer Zone (LTZ) strategy, achieves highly accurate Dmaps with a small amount of communication traffic.
1. Introduction
If a driver can visually know the current circumstances of roads on a route to his/her destination, such as traffic jams, roadwork, accidents, and beautiful sights, he/she may select a better (faster, easier, or more fun) route to the destination. Currently, there are some applications that inform a driver of traffic information to make driving more comfortable, such as Google maps and ETC2.0 [1] in Japan, etc. In addition, Pioneer has provided a cellular network-based system that allows a driver to visually know the current circumstances of roads predefined by the system [2]. However, to the best of our knowledge, there is no application that visually informs a driver of the current circumstances of roads that are designated by the driver.
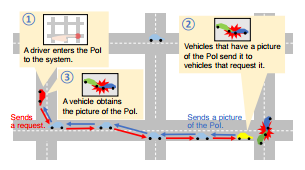 Figure 1. Real-Time Visual Car Navigation System
Ishihara et al. proposed a Vehicular Ad-hoc NETworks (VANET)-based road traffic information sharing system, called the Real-Time Visual Car Navigation System [3–5]. This system allows driver to obtain photographs/videos of his/her Point of Interest (PoI) that is inputted to an onboard device, e.g., a car navigation device. In this system, when a driver inputs his/her PoI to an onboard device, the vehicle sends a request message to vehicles in the vicinity of the PoI. Then, vehicles that have a photograph/video of the PoI send it to the requesting vehicle (Figure 1).
In this system, we assume that vehicles use only VANET to send request messages to vehicles in the vicinity of a PoI and to send photographs/videos of PoI to requesting vehicles. If we use a simple pull-based strategy for sending the photographs/videos in the Real-Time Visual Car Navigation System, a requesting vehicle sends request messages to vehicles in the vicinity of a PoI, and vehicles that received a request message respond by sending photographs/videos of the PoI to the requesting vehicle. With this strategy, it is difficult for vehicles to certainly send the photographs/videos to the requesting vehicles with low latency because the connectivity between vehicles is intermittent due to the high mobility of vehicles. Furthermore, if multiple vehicles that are close together demand photographs/videos of the same PoI at the same time, the same data and the same request messages are repeatedly sent to the same location at the same time. Consequently, network resources may be wasted. Cooperative caching techniques such as ones proposed in [6] can be used to mitigate this problem. Another problem of pull-based schemes is that it is difficult to constantly deliver newly generated LocationDependent Information (LDI) of PoI items to vehicles having interest in the PoI.
On the other hand, if all vehicles that have photographs/videos of the PoI send them based on a simple push-based strategy for certainly sending the photographs/videos to requesting vehicles, all vehicles send the photographs/videos whenever vehicles receive or generate them. Thus, unneeded data may be disseminated and limited network resources are wasted.
To ensure that newer LDI is sent to requesting vehicles with low communication traffic, Ishihara et al. have proposed a data dissemination scheme based on Demand maps (Dmaps) [4]. A Dmap is a data set representing the geographical distribution of the strength of demands for LDI. This scheme assumes that every vehicle has a Dmap. Vehicles grasp the geographical distribution of the strength of demands for LDI using a Dmap, and they send LDI to areas where it is strongly demanded via an efficient route. To keep Dmaps on vehicles up to date, each vehicle broadcasts several data constituting its Dmap (Dmap Information: DMI) with a beacon that it sends periodically. When vehicles receive other DMI, they update their Dmap by merging the received DMI with their own.
Since vehicles send LDI in accordance with Dmaps, the accuracy of Dmaps, i.e. the reproducibility of real geographical distribution of the strength of demands in Dmaps, should be high. Each vehicle should frequently update its Dmap by frequently exchanging DMI with other vehicles to make the accuracy of Dmaps high. However, if each vehicle frequently sends DMI, communication traffic becomes high. Therefore, strategies to increase the accuracy of Dmaps and control communication traffic are needed. In [4], Ishihara, et al. design the basic specification of Dmap-based data dissemination, however, they did not design the details of how to send DMI.
In this paper, to solve the tradeoff between Dmap accuracy and communication traffic, we propose strategies that control the frequency of sending DMI and strategies that each vehicle selects DMI to be sent. In addition, we evaluate the accuracy of Dmaps and communication traffic in the case that vehicles use the proposed strategies through simulations.
The contributions of this paper are summarized as follows.
1. We propose a strategy for controlling the frequencyof broadcasting DMI. In this strategy, each vehicle determines whether it sends DMI based on the frequency of updating its DMI.
2. We propose three strategies for selecting DMI to besent: i) the Recently Update First (RUF) strategy, which considers how new each DMI is, ii) the LDI Transfer Zone-based (LTZ) strategy, which considers the relation between each PoI and each location where requests occur, and iii) a hybrid strategy.
3. We evaluated the effectiveness of the proposed strategies through simulations and confirmed that the LTZ strategy most effectively reduces communication traffic and makes the accuracy of Dmaps high.
This paper is an extension of work originally presented in 2017 IEEE 31st International Conference on Advanced Information Networking and Applications (AINA) [7]. In this paper, we conduct simulations with more appropriate parameters, and provide a more detailed explanation of the proposed strategies and Dmap-based data dissemination. In addition, we improve the implementation of our proposed strategies in an existing simulator, and obtain more reliable simulation results. The description of related work is updated.
The remainder of this paper is composed as follows. In the next section, we review related work. In Section 3, we recapitulate the data dissemination scheme based on Dmaps and introduce the data structure of Dmap based on soft-state sketches. In Section 4, we propose strategies for sending DMI to improve the accuracy of Dmaps with low communication traffic. Then, in Section 5, we evaluate the effectiveness of the proposed strategies. Finally, we conclude this paper in Section 6.
2. Related Work
In Dmap-based data dissemination, we assume that a vehicle that has generated LDI appends the location where it generated the LDI. In addition, vehicles can know locations where the LDI is demanded based on their Dmap. Vehicles carry out the routing of LDI by referring to a location where the LDI is generated and locations where the LDI is demanded. This concept is similar to Named Data Networking (NDN). In NDN, vehicles give a name, e.g. a location where data item is generated, to each data item and deliver the data item to vehicles requesting the data item associated with that name.
In [8], Grassi et al. proposed Navigo, an interest forwarding scheme in NDN. In Navigo, each vehicle that has received or generated an interest forwards it based on the shortest path between the location where it exists and the location where many vehicles having the demanded data exist. This scheme aims to deliver interests to locations where many vehicles having the required data are. In Navigo, vehicles send requests (interests) to many vehicles having the required data by sending the requests to the locations of these vehicles. In the Dmap-based scheme, vehicles register their requests to their Dmap instead of sending requests to the PoIs. In addition, vehicles having LDI can know not only a request for the LDI, but also the geographical distribution of the strength of demands for the LDI, and utilize this information for efficiently routing the LDI.
In [9], Ahmed et al. proposed CODIE as a data dissemination scheme using NDN. In CODIE, vehicles that forward an interest append the hop count of the interest from the requesting vehicle, and vehicles having the required data forward the data in accordance with the hop count. In this scheme, the same LDI may be disseminated to the same region at the same time, and network resources may be wasted. On the other hand, in the Dmap-based scheme, each vehicle grasps regions where each LDI is highly desired as well as its distribution. Therefore vehicles may be able to disseminate demanded LDI to many vehicles with a small number of the LDI transfers. In addition, Bian et al. introduced the NDN architecture to VANETs and proposed forwarding and caching schemes [10].
In Dmap-based data dissemination, requesting vehicles register their requests to their Dmaps. In the publish/subscribe (pub/sub)-based approach [14], e.g. [15] and [16] , requesting vehicles register their interests and their IDs to broker nodes. We regard that Dmap-based data dissemination is a kind of pub/sub based approach. A Dmap can be regarded as information on subscription and subscriber, and locations where requesting vehicles exist can be regarded as subscribers. In the Dmap-based scheme, each requesting vehicle does not register their IDs to a Dmap. However, locations where it requests LDI and locations where the LDI is generated are registered to a Dmap when it demands LDI. By disseminating LDI based on locations where requesting vehicles exist, the Dmap-based scheme can efficiently disseminate LDI to requesting vehicles compared with disseminating LDI based on IDs of requesting vehicles.
In our scheme, each vehicle sends DMI with a beacon that is sent periodically. In this paper, we discuss controlling the frequency of sending DMI. Many schemes for controlling the frequency of sending beacons have been proposed for sharing traffic information with low communication traffic. Dynamic beaconing (DynB) [11], UV-CAST [12], and DV-Cast [13] control the frequency of sending beacons adaptively to the density of vehicles and communication condition. In this paper, we propose a strategy that vehicles control the frequency of sending DMI adaptively to the relationship between the frequency of updating their DMI and the frequency that neighboring vehicles update their DMI and sharing a Dmap with low communication traffic. Strategies that use density of vehicles and communication condition, such as DynB, UV-CAST, and DV-Cast can be applied to our strategy.
Dmap-based data dissemination proposed in [4] and [17] can be categorized into a kind of data dissemination system for sharing Location-Dependent Information (LDI) in VANETs. Traffic information is typical LDI treated in VANETs. Various applications for sharing traffic information in VANETs, such as SOTIS [18], Trafficview [19], CASCADE [20], and Zone Flooding [21] have been proposed so far. They have a function for aggregating LDI obtained in a distributed manner. For example, in SOTIS, vehicles periodically broadcast a packet including traffic information, e.g. their location, velocity, and direction. When a vehicle receives information from other vehicles, it aggregates all the known information on each road segment to one average value. In those applications, unneeded information may be sent because vehicles broadcast traffic information without considering how strongly the traffic information is required. On the other hand, Dmap-based data dissemination aims to reduce redundant information dissemination by disseminating strongly required information in accordance with a Dmap.
In this work, a Dmap is represented with soft-state sketches proposed in [22]. A soft-state sketch is a data structure to stochastically estimate the number of unique data for aggregating data and reducing communication traffic. A soft-state sketch is represented by an array of nonnegative values. In [22], soft-state sketches are used for counting the number of available parking spaces every load segment and sharing this information among vehicles. Vehicles use a set of soft-state sketches for estimating the number of available parking spaces in a load segment. In [22], each vehicle has a set of soft-state sketches every load segment. When each vehicle finds available parking spaces, it inputs the initial TTL of available parking spaces information to a soft-state sketch corresponding to the load segment where the vehicle exists. In addition, vehicles append sets of soft-state sketches to a beacon that is sent periodically, and update their information by merging their own soft-state sketches with received ones.
On the other hand, in this paper, we use soft-state sketches for counting the number of demands for LDI and sharing this information among vehicles. In our scheme, each vehicle has a set of soft-state sketches for every pair of each location where LDI is generated and each location where LDI is required. Then, each vehicle inputs the initial TTL to a soft-state sketch corresponding to its request when it requests LDI, and sends sets of soft state sketches as DMI with a beacon.
In [22], to reduce communication traffic for sending sets of soft-state sketches, a method for compressing soft-state sketches is proposed. However, we aim to reduce communication traffic by controlling the frequency of sending sets of soft-state sketches and selecting sets of soft-state sketches that vehicles should send.
3. A data dissemination scheme based on Demand map
In this section, we describe the details of the data dissemination scheme based on a Demand map (Dmap). In this scheme, each vehicle has a Dmap, which is a data set representing the geographical distribution of the strength of demands for LDI. Each vehicle forwards strongly demanded LDI items preferentially in accordance with its Dmap.
3.1 Demand map (Dmap)
A Dmap represents the geographical distribution of the strength of demands for LDI. We assume that the strength of demands for LDI is measured by the number of demands generated by vehicles. If multiple vehicles in geographically distant locations demand LDI of the same PoI, e.g. vehicles in the east end of a city and vehicles at the west end of the city require LDI of the city center, the routes for delivering the LDI to the vehicles in distant locations will be different. Thus, we divide an area into multiple regions, and a Dmap manages the strength of demands for LDI of each region every each region where demands are generated.
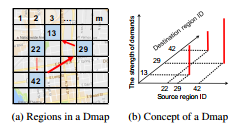 Figure 2. Demand map
A Dmap is created as follows. Vehicles divide an area supported by their Dmap into multiple small regions and give a unique ID to each small region as shown in Figure 2 (a). We refer to a region where a requesting vehicle exists as a source region, and refer to a region where the requested LDI is generated as a destination region. For instance, in Figure 2, if a vehicle in region 29 requires LDI of region 13, we call region 29 a source region and call region 13 a destination region. A Dmap records the number of demands, i.e. the strength of demands, every pair of each source region and each destination region. For instance, in Figure 2 (a), if the start point of an arrow is a source region, and the end point of an arrow is destination region, and width of an arrow indicates the strength of demands corresponding to the arrow, a Dmap is represented as shown in Figure 2 (b).
3.2 How vehicles use a Demand map for disseminating Location-Dependent Information (LDI)
A Dmap on each vehicle is used for decision of routing of LDI. When a Dmap is updated or each vehicle generates new LDI or receives LDI, each vehicle refers to its Dmap and knows the number of demands per pair of a source region and a destination region. In addition, the vehicle refers to LDI time stamps, and it preferentially selects LDI that was required many times from sets of LDI that are current. If vehicles that are far from a source region send LDI, it may become outdated during delivery, even though LDI should be new. Therefore, vehicles that are far from the source region do not send LDI.
LDI transfer zone
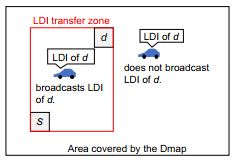 Figure 3. Disseminating LDI of s to d in accordance with a Dmap
In addition, LDI should be delivered from the destination region to source regions via a route as short as possible. To realize this, we defined a zone where LDI is delivered as an LDI Transfer Zone (LTZ). An LTZ is a rectangular zone that consists of a diagonal whose ends are a source region and a destination region (Figure 3). When a vehicle sends LDI, it determines whether it sends the LDI based on whether it is in the LTZ corresponding to the LDI. A vehicle sends an LDI item only when it is in the LTZ corresponding to the pair of the destination region and the source region of the LDI (Figure 3). If the vehicle is in one of the LTZs corresponding to LDI that is strongly demanded from many source regions, it aggressively broadcasts the LDI item.
LDI is delivered via many source regions. Thus, in the case that LDI is demanded from multiple source regions at the same time, if duplicate routes exist, LDI is not passed through the duplicate route multiple times, and redundant dissemination may be reduced compared with simple pullbased strategy. For instance, in Figure 4 (a), if yellow cars request LDI of A, the LDI is sent via routes represented by red arrows multiple times and duplicate dissemination occurs. However, in Figure 4 (b), if all cars have the same content of a Dmap, the LDI is sent via a route represented by red arrows once, then, duplicate disseminations do not occur.
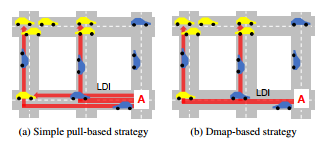 Figure 4. Comparison of Dmap-based strategy and simple pull-based strategy
We assume that vehicles send new LDI demanded by many vehicles to the area where the demanding vehicles exist so that the LDI can be delivered via a route satisfying the aforementioned requirements. A routing strategy based on a propagation function proposed in [23] can be used for this purpose.
By this operation, vehicles that want the LDI will be able to obtain the LDI with a low data delivery delay and a small amount of traffic. For achieving high reliability and low data traffic for delivering LDI, the behavior of neighboring vehicles that have the same LDI and potentially broadcast the LDI should be considered. The detailed design of data forwarding algorithms based on a Dmap and behavior of the neighboring vehicles is beyond the scope of this paper.
3.3 Data structure of Demand map
One main scheme to create a Dmap is to collect all log data concerning demands that are generated by all vehicles, e.g. source region ID, destination region ID, car ID, and Time to Live (TTL) of demands, etc. However, if vehicles create their Dmap in accordance with this main scheme, all vehicles broadcast all log data concerning demands, and data size that vehicles have to broadcast and manage in their local storage increase in proportion to the number of demands and the number of vehicles.This leads to low scalability. To reduce the required communication traffic for maintaining Dmaps and the required storage on vehicles, a Dmap should be represented by a suitable data structure and needs algorithms to handle the data that can aggregate many demands generated by different vehicles in different locations.
Therefore, in [4] and [17], Ishihara et al. proposed to represent a Dmap by using soft-state sketches proposed in [22], a data structure to aggregate data and stochastically count the number of unique data. In [22], soft-state sketches are used for managing observation of free parking spaces in the same area by multiple vehicles. Meanwhile, we use soft-state sketches for counting the number of demands for the same pair of source region and destination region.
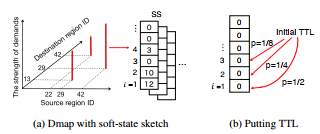 Figure 5. Soft-state sketches in a Dmap
To manage a Dmap, each vehicle has a set of h (h ≥ 1) sketches for a pair of source region and destination region (Figure 5 (a)). A sketch is an array of non-negative integers as shown in Figure 5 (a). Hereafter, we refer to a set of sketches as an SS for simplicity. Since an SS is used for representing DMI for a pair of source region and destination region, we will use these words interchangeably.
When a vehicle requires LDI of a PoI, it randomly selects a sketch from the SS corresponding to the pair of the vehicle’s current region, i.e. the source region of the demand, and PoI, i.e. the destination region of the demand (Figure. 6). Then, it puts the initial TTL for the demand into i-th element from the smallest index of elements in the
selected sketch with a probability of 1/2i (Figure 5 (b)).
The TTL value in each element is decremented as time progresses until the TTL value becomes 0. Since the probability that the TTL value is put into an element with a small index i is high and the probability that the TTL value is put into an element with a large index i is low, elements with a small index easily have non-zero values, but ones with a large index are hardly filled with a non-zero value. Therefore, the more demands occur, the more easily elements with large indexes are filled with non-zero values and the longer the run length of non-zero values from an element with the smallest index of a sketch is. Thus, the number of generating demands for a pair of source region and destination region, i.e. the strength of demands for the pair, is estimated based on the run length of non-zero values from an element with the smallest index of each sketch in an SS for the pair.
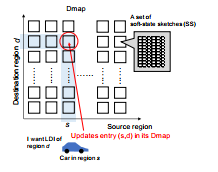 Figure 6. Behavior of a vehicle when it demands LDI
To keep Dmaps on vehicles up to date and share Dmaps among vehicles, each vehicle selects several SSs and sends them with a beacon that is sent periodically. When a vehicle receives SSs from another vehicle, it merges each of the received SSs with a corresponding SS in its Dmap. To merge the received SSs with the corresponding SSs in a local Dmap, the vehicle selects a larger value in the same element of the same index of sketches in each of received SSs and the corresponding SS in the local Dmap. Then the selected value is set to the element of the sketch of the SS in the receiver vehicle’s Dmap as shown in Figure 7.
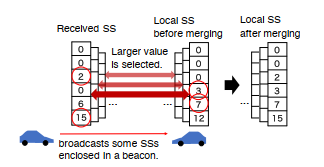 Figure 7. Merging with local SSs and other’s
The number of demands for a pair of a source region and a destination region recorded in an SS consisting of m sketches (S1,…,Sm) is estimated by the following formula presented in [22],
2Pmj=1 Z(Sj)/m − 2−κ·Pmj=1 Z(Sj)/m
C(S1,…,Sm) := m · , (1)
ϕ
with κ ∼ 1.75, ϕ ∼ 0.77351. Sj is a sketch in an SS, and m is the number of sketches composing an SS. Z(Sj) is the run length of non-zero values from an element with the smallest index in√Sj. In addition, the standard error of the estimate
is 0.78/ m. Therefore, the larger the number of sketches that compose an SS, the higher the accuracy of the estimate. However, data size that each vehicle has and sends increases in proportion to the number of sketches that compose an SS.
4. Strategies for efficiently sending DMI
In this section, we propose a strategy that controls the frequency of sending DMI and strategies that select DMI that vehicles should send for sending DMI with making the accuracy of Dmap high and making communication traffic low. To reflect current demands in a Dmap certainly, i.e. to improve the accuracy of a Dmap, it is desirable for each vehicle to frequently receive SSs for all pairs of all source regions and all destination regions from many vehicles and make its local Dmap up to date. However, if all vehicles frequently send all SSs that they have, the communication resource will be wasted because unneeded SSs may be sent and vehicles may send duplicate SSs. Therefore, we propose strategies for making the accuracy of Dmap high with low communication traffic.
4.1 Strategy controlling the frequency of sending DMI — Frequent strategy
We propose selecting frequently updating vehicles strategy, a strategy that controls the frequency of sending DMI (= SSs), to reduce the communication traffic for sending SSs without deteriorating the accuracy of Dmaps. Hereafter, we refer to this strategy as Frequent strategy for simplicity. Based on this strategy, when a vehicle sends a beacon, it determines whether it sends SSs with a beacon. The key idea of this strategy is that vehicles that frequently receive and update SSs may have SSs that certainly reflect the actual number of demands. On the other hand, vehicles that rarely receive and update SSs may have SSs that incorrectly reflect the actual number of demands. In addition, vehicles that frequently generate demands and update their SSs may have many SSs that are still not reflected in the SSs of other vehicles. Therefore the vehicles should send their SSs frequently. Therefore, in the Frequent strategy, vehicles that frequently update their SSs have a high priority to send SSs. Here, updating an SS means that one of the elements in a sketch of the SS is overwritten by putting a larger value due to a new demand generation or receiving a corresponding SS that has at least one larger value for any of elements in sketches in the receiver vehicle’s SS from a neighboring vehicle.
In this strategy, each vehicle counts the total number of updates to its SSs during a certain past period, τu. We refer to the number as the Total Count of Updating Sketches (TCUS), for simplicity. In this strategy, vehicles whose
TCUS is large are regarded as vehicles that frequently update their SSs. Vehicles whose TCUS is larger than one of their neighbor vehicles have a higher priority to send their SSs.
The operation of vehicles in this strategy is summarized follows. Each vehicle sends its TCUS with a beacon periodically. When a vehicle receives a beacon from another vehicle, it stores the received TCUS with the ID of the vehicle that has sent the TCUS. When a vehicle sends a beacon, it sorts TCUSs received from vehicles in the vicinity and its TCUS in descending order. Then, if its TCUS is in the top-k group of TCUSs, it decides to send SSs with a beacon (Figure 8). Otherwise, it does not send any SSs.For instance, as shown in Figure 8, if TCUS of car A is 4th from the largest TCUS and k > 4, car A sends SSs.
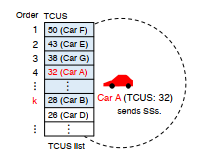 Figure 8. Frequent strategy
4.2 Strategies for selecting DMI that vehicles send
Each vehicle should select SSs to send so that Dmaps on vehicles, including itself, can achieve high accuracy with low communication traffic by eliminating redundant information that will not update the SSs of other vehicles. To achieve this, we propose three strategies, the Recently Updated First (RUF) strategy, the LDI Transfer Zone (LTZ) strategy, and the RUF + LTZ Hybrid strategy.
4.2.1 Recently Updated First (RUF) strategy
Recently updated SSs may have a large TTL value and may update SSs on vehicles that receive them, while SSs that are updated long ago may have a small TTL value and may not update SSs of the receiver vehicles. Sending SSs that will not update SSs of other vehicles wastes limited communication resources.
Therefore, in the RUF strategy, we give a high priority to recently updated SSs. When a vehicle updates an SS, it records the current time with a pair of a source region ID and a destination region ID. If a vehicle decides to send SSs with a beacon, it selects top-q recently updated SSs from its local SSs that have been updated so far (Figure 9 (a)).
However, if each vehicle selects SSs only based on the last update time of them, SSs that have the same pair of source region and destination region may frequently be sent and SSs that have other pairs will lose a chance to be sent. For instance, if an SS for a pair of source region s and destination region d is the most recently updated SS in a vehicle, the vehicle sends the SS. Then, when neighbor vehicles receive and update the SS, the SS for a pair of s and d becomes the most recently updated SS in the vehicles and the vehicles will send it. The SS for a pair of s and d is repeatedly sent and SSs for other pair are rarely sent. Consequently, for some pairs of a source region and a destination region, the transition of the number of demands on a vehicle may not be reflected in SSs, and the Dmap accuracy may become low.
To provide the opportunity for not only the most recently updated SSs to be sent, in this strategy, each vehicle randomly selects up to n SSs from the top-q recently updated SSs and sends them (Figure 9 (b)).
A list of SSs last updated time A list of SSs last updated time
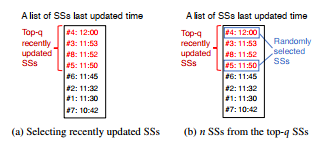 Figure 9. RUF strategy
4.2.2 LDI Transfer Zone (LTZ) strategy
In Dmap-based data dissemination, we assume that vehicles send LDI for a pair of source region s and destination region d only when they are in the LTZ corresponding to s and d, as mentioned in Section 3.2. Therefore, vehicles in the LTZ corresponding to s and d should certainly know the number of demands for LDI for the pair of s and d. On the other hand, vehicles that are not in the LTZ do not have to know the number of demands for LDI. If the SSs for the pair of s and d are sent by only vehicles in the LTZ corresponding to s and d, the SSs are exchanged among only vehicles in the LTZ. As a result, the accuracy of the number of demands only for a pair of s and d composing an LTZ containing a vehicle holding the Dmap becomes high because noisy unneeded SSs are not sent and SSs that affect other vehicles SSs for a pair of s and d composing the LTZ are sent.On the other hand, exchanging SSs among vehicles outside the LTZ is not effective because vehicles do not need SSs that they will not use when they disseminate LDI.
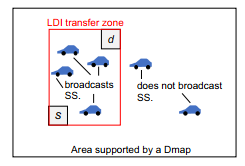 Figure 10. LTZ strategy
In the LTZ strategy, vehicles send SSs for the pair of s and d only when they are in the LTZ corresponding to s and d, and vehicles do not send the SSs when they are not in the LTZ. To this end, when each vehicle decides to send SSs, it first selects only SSs whose pair of source region s and destination region d satisfies P ∈ As,d. Here, P denotes the vehicle’s current region, and As,d denotes the LTZ for the pair of s and d (Figure 10). If the number of selected SSs is larger than the maximum number of SSs that can be included in a beacon packet, the vehicle randomly selects up to n SSs from the selected SSs.
4.2.3 RUF + LTZ Hybrid strategy
To leverage the advantages of both the RUF and LTZ strategies, we propose the RUF + LTZ Hybrid strategy. In this strategy, each vehicle sends more recently updated SSs only when it is in the LTZ corresponding to the SSs. Each vehicle selects and sends SSs as described below. If a vehicle v decides to send SSs with a beacon, it selects the top-q recently updated SSs from its local SSs that have been updated so far, like in the RUF strategy. Note that a vehicle selects SSs only based on whether SSs are more recently updated in this phase. We refer to the set of these SSs as Lv. Then, it selects SSs whose pair of source region s and destination region d satisfies P ∈ As,d from Lv. We refer this set of selected SSs as L0v. Finally, v randomly selects up to n SSs from L0v and broadcasts them. This algorithm is shown in Algorithm 1.
Algorithm 1 RUF + LTZ strategy
When vehicle v attempts to send some sets of sketches
Lv,L0v ← φ
Lv ← top q recently updated sets of sketches on v for all (s,d) of a set of sketches in Lv do
if Pv ∈ As,d then
add Sv,s,d to L0v
end if
end for select n items randomly from L0v
5. Evaluation of strategies for efficiently sending DMI
In this section, we evaluate the effectiveness of the proposed strategies through simulations. We focus on the accuracy of Dmaps and communication traffic required for sending DMI in this evaluation.
5.1 Simulation settings
5.1.1 Simulation scenario
In each scenario of our simulations, each vehicle broadcasts SSs to update and to share their Dmap using only VANET. We used Scenargie [24], a network simulator developed by Space-Time Engineering, and we implemented our proposed strategies and comparative strategies described later. In our scenarios, there are 14 double lane roads in a square area that has 2 km on each side as shown in Figure 11 (a).
All intersections have traffic lights.
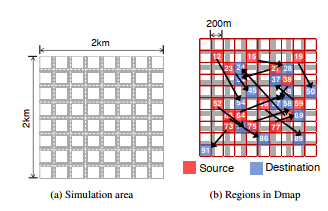 Figure 11. Simulation area and regions for a Dmap
All vehicles move on the roads in the simulation area by a mobility log generated using the SUMO road traffic simulator [25]. In addition, we conducted simulations of vehicle mobility by changing the inter-vehicle arrival rate. These vehicle mobility simulation logs are used for evaluating how the density of vehicles affects the accuracy of Dmaps and the effectiveness of the proposed strategies.
Table 1. Pairs of source region ID and destination region ID of demands generated in the simulations
Source Destination Source Destination
12 54 23 45
19 50 15 28
52 74 63 86
56 89 27 34
38 57 73 91
75 58 77 69
59 37 64 48
68 24
Table 2. Simulation parameters
Parameters Values
Inter-vehicle arrival rate [/h·lane] 100, 300
Interval of sending beacons [sec] 1
Tx power [dBm] 10
Interval of generating demands [sec] 1
The effective period of a demand 63
Simulation time [s] 900
MAC Protocol IEEE802.11p
Propagation model ITU-R P.1411
App. max. data size [bytes] 500
Size per SS [bytes] 192
τu 30
k 10, 17
q 7
n 2
p 0.8
We divided the simulation area into small square regions 200×200m2 and gave an ID to each small region for creating a Dmap of each vehicle Figure 11 (b). In Figure 11 (b), vehicles in blue regions demanded LDI of red regions corresponding to the blue regions. Table 1 also summarizes pairs of a source region and a destination region of demands that vehicles generated in the simulations. Vehicles in each source region shown in Table 1 demanded LDI of the destination region corresponding to the source region every second when they were moving towards the direction of the destination region. For instance, a vehicle in region 12 demanded LDI of region 54 every second only when it was moving eastbound or southbound.
We repeated simulation runs ten times with different random number seeds. Table 2 summarizes parameters used in the simulations. We determined the values of n, k and the interval of sending beacons based on preliminary simulations. We selected values of these parameters so that communication traffic could be as small as possible and the reproducibility of real demands in Dmaps (the ratio of coincidence described later) could be high based on the results of the preliminary simulations using the same scenarios.
5.1.2 Comparative strategies
To evaluate the effectiveness of proposed strategies, we used three comparative strategies, the All strategy, the Random Timing (RandT) strategy, and the Random Selecting (RandS) strategy. The All strategy and RandT strategy are for controlling the frequency of sending SSs and used for evaluating the effectiveness of the Frequent strategy. The RandS strategy is for selecting SSs to be sent, and used for evaluating the effectiveness of the LTZ strategy, RUF strategy, and RUF + LTZ Hybrid strategy.
In the All strategy, all vehicles do not control the frequency of sending SSs and send SSs with every beacon. In the RandT strategy, each vehicle decides to send SSs with a probability of p when it sends a beacon. In the RandS strategy, vehicles that send SSs randomly select n SSs to send from SSs that have been updated so far.
5.2 Simulation metrics
We evaluated the performance of the proposed strategies focusing on the accuracy of a Dmap in each vehicle and communication traffic required for sending DMI (= SSs). Here, the accuracy of a Dmap means the reproducibility of the actual number of demands in the Dmap. Since vehicles send LDI based on the estimated number of demands given by the Dmap, the reproducibility of the actual number of demands in the Dmap should be high. The reproducibility of the actual number of demands should be evaluated by using a relative metric because the influence of the error is different according to how the actual number of demands is. Therefore, for evaluating the accuracy of Dmaps, we use the ratio of coincidence between the actual number of demands and the estimated number of demands in Dmaps, M.
M for a pair of source region and destination region is defined as follows.
M = 1 − min{1,|R − D|/R} (0 ≤ M ≤ 1). (2)
where D denotes the estimated number of valid demands (TTL > 0) that are generated in a source region for a destination region, and R denotes the actual number of valid demands for the same combination of a source region and a destination region as D. In addition, we assume that R is not 0 in this formula. The closer M is to 1, the higher the accuracy of the Dmap. As mentioned above, only vehicles in an LTZ for the pair of source region s and destination region d should surely know the number of demands for LDI for the pair of s and d because we assume that vehicles send the LDI only when they are in LTZ corresponding to s and d. Therefore, we evaluated M for the pair of source region s and destination region d in a Dmap in only vehicles that are in the LTZ for the pair of s and d at the time point of the data analysis.
We also evaluated the communication traffic required for sending SSs. It is the average value of the product of the data size of an SS and the total number of broadcasted SSs in each simulation.
5.3 Simulation results
5.3.1 The ratio of coincidence M
Figure 12 shows the CDF of M calculated 800 seconds after the start of the simulation with vehicle traffic of 300 vehicles/lane·hour when the All strategy is used for controlling the frequency of sending SSs, and we evaluated the performance of the proposed strategies for selecting SSs. The vertical axis is the ratio of vehicles that have an SS representing M below each M on the horizontal axis. Each curve in the graph corresponds to a pair of a source region and a destination region of demands shown in Table 1.
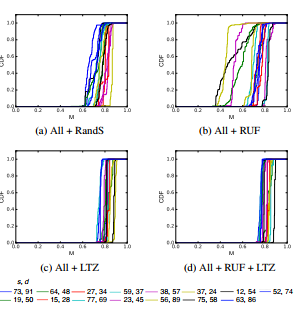 Figure 12. CDF of the Dmap accuracy (M) at 800 sec (inter-vehicle arrival rate: 300 vehicles/lane·hour)
As shown in Figure 12, the LTZ strategy and the RUF + LTZ strategy outperform the other strategies. When the RandS strategy is used, M of pairs of s and d (Hereafter, we call them sd-pairs) ranges from 0.6 to 0.86. With the LTZ strategy and the RUF + LTZ strategy, M of sd-pairs is improved compared with M when the RandS strategy is used. M of sd-pairs when the LTZ strategy or the RUF + LTZ strategy is used ranges from 0.7 to 0.86. This is because SSs for the pair of s and d are preferentially sent in LTZ corresponding to the SSs. The reason why M in the LTZ strategy is similar to M in the RUF + LTZ strategy is summarized as follows. SSs are frequently sent in their corresponding LTZ if the LTZ strategy is used, then the time stamp of the SSs on vehicles in the LTZ is frequently updated. Therefore, SSs are frequently sent in the LTZs when vehicles select recently updated SSs in RUF + LTZ strategy. Therefore, similar SSs are selected both in the LTZ strategy and the RUF + LTZ strategy. Consequently, M in the LTZ strategy is similar to M in the RUF + LTZ strategy. On the other hand, when only the RUF strategy is used for selecting SSs, M is deteriorated. The reason is that SSs of the same sd-pairs tend to be sent repeatedly and transmission of SSs of other sd-pairs is suppressed.
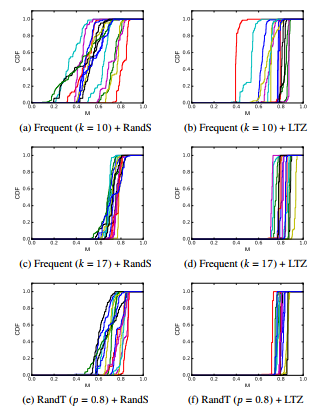 Figure 13. CDF of the Dmap accuracy (M) at 800 sec (inter-vehicle arrival rate: 300 vehicles/lane·hour)
Figure 13 shows the CDF of the Dmap accuracy (M) when the Frequent strategy and the RandT strategy were used for controlling the frequency of sending DMI (= SSs) with the RandS strategy or the LTZ strategy for selecting SSs. When vehicles use the RandT strategy and the RandS strategy, M is deteriorated compared to that in the case when the All strategy and the RandS strategy are used. This is simply because the number of exchanged SSs is decreased. However, when vehicles use the RandT strategy and the LTZ strategy, M is similar to one in the case when the All strategy and the LTZ strategy are used. The reason is that SSs are frequently exchanged in LTZ corresponding to them when the LTZ strategy is used even if the small number of vehicles send SSs. When the Frequent strategy with k = 10 is used, M is more deteriorated than that in the case when the RandT strategy is used. The reason is that the number of vehicles that send SSs is excessively restrained in the Frequent strategy with k = 10. On the other hand, when the Frequent strategy with k = 17 is used, M approximated M in the cases when the All strategy is used because the number of vehicles that send SSs was hardly not restrained.
Figure 14 shows CDF of M calculated at 800 seconds from the start of the simulation with 100 vehicles/lane·hour vehicle traffic. Compared with Figure 12 (a)–(c), we can see that M is deteriorated when the vehicle density is low. This is because a sufficient number of SSs is not exchanged due to lack of connectivity between vehicles. Interestingly, even with poor connectivity, the LTZ strategy outperforms other strategies and most of the sd-pairs achieve high M around 0.8. The reason is that SSs are easily updated in LTZ corresponding to the SSs because SSs are frequently sent in the LTZ.
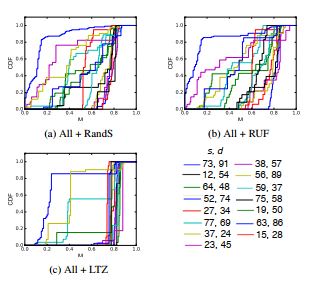 Figure 14. CDF of M at 800 sec (inter-vehicle arrival rate: vehicles/lane·hour) 100
5.3.2 Communication traffic
Figure 15 shows communication traffic in each combination of strategies when vehicle traffic is 300 vehicles/lane·hour. We can see that the LTZ strategy most effectively reduces communication traffic among strategies for selecting SSs. The reason is that each SS is sent only in the LTZ corresponding to the SS and is not sent outside the LTZ.
Concerning strategies for controlling the frequency of sending SSs, the Frequent strategy (k = 10) most effectively reduces the communication traffic. However, when the Frequent strategy (k=10) is used, M becomes low as shown in Figure 13 (a), (b) because SSs are rarely updated due to the limited chance to send SSs.
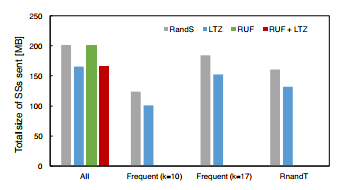 Figure 15. Communication traffic (Inter-vehicle arrival rate: 300
vehicles/lane·hour)
Summarizing the simulation results of the ratio of coincidence M and communication traffic, we can conclude that the LTZ strategy is the most useful to improve both the Dmap accuracy and communication traffic needed for exchanging SSs. The reason is that this strategy increases the frequency of SS exchange in their corresponding LTZ and reduces the frequency of exchanging them outside the LTZ. Concerning strategies for controlling the frequency of sending SSs, the Frequent strategy reduces the communication traffic. However, it deteriorates the Dmap accuracy. Therefore, the Frequent strategy does not solve the tradeoff between the Dmap accuracy and communication traffic. In addition, when both the LTZ strategy and RandT strategy are used, communication traffic and the Dmap accuracy is most effectively improved.
6. Conclusions
In this paper, we proposed a strategy for controlling the frequency of sending DMI (SSs) and strategies for selecting SSs that vehicles should send for improving the accuracy of a soft-state sketch-based Dmap on vehicles used for Dmapbased location dependent data dissemination services on VANETs, such as a real-time visual car navigation system. The simulation results revealed that one of the proposed strategies for selecting SSs, the LTZ strategy, effectively reduces communication traffic and achieves high Dmap accuracy, i.e. the reproducibility of the actual number of demands in Dmaps. The key feature of the LTZ strategy is that it is designed in consideration of where the exchanged information, i.e. SSs, may be used. In this strategy, vehicles send SSs in only locations where SSs may be used and do not send SSs in locations where SSs may not be used. Thus, it can reduce communication traffic and improve the accuracy of SSs in locations where SSs is used. On the other hand, the strategy for controlling the frequency of sending SSs, the Frequent strategy, which gives a high priority to vehicles frequently updating SSs, deteriorates the Dmap accuracy, while it drastically reduces communication traffic required for exchanging SSs.
The demand generation patterns used in the evaluation in the paper is limited. Thus, the performance evaluation of various demand generation patterns and realistic demand generation patterns are needed because there are many demand generation patterns in real life. For example, a demand generation pattern that frequency of demands change as time progress or change depending on a distance between a source region to a destination region should be considered. The mobility pattern of vehicles will also affect the performance of sharing Dmap information. For example, if an isolated vehicle has important Dmap information of a distant area, giving a high priority to exchanging the important Dmap information will contribute to that many vehicles knowing the distributions of demands for LDI. If many vehicles in the distant area want to obtain LDI of an area that has low connectivity from them in terms of store-carryforward-based data delivery, such demand information will be carried by isolated vehicles.
For delivering LDI based on Dmaps, additional information is needed for each vehicle to determine whether it forwards an LDI item or not. For example, if its neighboring vehicle has sent the same LDI item recently, it should
not forward the LDI item to reduce the redundant data transmission without loss of the reliability of data delivery. Besides, if there are multiple isolated routes between the PoI and the destination of the LDI item, whether selecting one of the routes or using all the routes will affect the reliability of the LDI data delivery. In addition, we should design a criterion for selecting LDI that vehicles send, a method for calculating efficient forwarding routes based on Dmaps, etc. Our proposed strategies are important factors in the routing of LDI because vehicles disseminate LDI based on Dmaps in Dmap-based data dissemination. The design of a data forwarding algorithm based on Dmaps and additional information remains as our future work.
Acknowledgment
This work was supported by JSPS KAKENHI Grant Number 15H02689.
- MLIT Ministry of Land, Infrastructure, Transport and Tourism: ITS, http://www.mlit.go.jp/road/road_e/p1_its. html#a2 (Accessed 14th September 2017)
- Pioneer news release: Pioneer introduces new CYBER NAVI car navigation systems for Japan Market, http://pioneer.jp/ en/news/press/index/1617/May2013.
- Okamoto and S. Ishihara, “Distributing location-dependent data in VANETs by guiding data traffic to high vehicle density areas,” in Vehicular Networking Conference, 2010. https://doi.org/10.1109/VNC.2010.5698248
- Ishihara, N. Nakamura, and Y. Niimi, “Demand-based Location Dependent Data Dissemination in VANETs” in the 19th annual international conference on Mobile computing & networking, 2013.https://doi.org/10.1145/2500423.2504580
- Nakamura, Y. Niimi, and S. Ishihara, “Live VANET CDN: Adaptive data dissemination scheme for location-dependent data in VANETs” in Vehicular Networking Conference, 2013. https://doi.org/10.1109/VNC.2013.6737595
- Yin and G. Cao, “Supporting cooperative caching in ad hoc networks” IEEE Trans. Mobile Computing, 5(1), 77–89, 2006. https://doi.org/10.1109/TMC.2006.15
- Yamada and S. Ishihara. “Data Exchange Strategies for Aggregating Geographical Distribution of Demands for Location-Dependent Information Using Soft-State Sketches in VANETs” in Advanced Information Networking and Applications, 2017 IEEE 31st International Conference on, 2017. https://doi.org/10.1109/AINA.2017.42
- Grassi, D. Pesavento, and G. Pau, “Navigo: Interest forwarding by geolocations in vehicular Named Data Networking” in World of Wireless, Mobile and Multimedia Networks, 2015 IEEE 16th International Symposium on a, 2015. https://doi.org/10.1109/WoWMoM.2015.7158165
- H. Ahmed, S. H. Bouk, and M. A. Yaqub, “CODIE: Controlled Data and Interest Evaluation in Vehicular Named Data Networks” IEEE Trans. Vehicular Technology, 65(6), 3954–3963, 2016. https://doi.org/10.1109/TVT.2016.2558650
- Bian , T. Zhao, X. Li , W. Yan, “Boosting named data networking for data dissemination in urban VANET scenarios” Vehicular Communications, 2(4),195–207, 2015. https://doi.org/10.1016/j.vehcom.2015.08.001
- Sommer, S. Joerer, M. Segata, “How shadowing hurts vehicular communications and how dynamic beaconing can help” IEEE Trans. Mobile Computing, 14(7), 1411–1421, 2015. https://doi.org/10.1109/TMC.2014.2362752
- Viriyasitavat, O.K. Tonguz, and F. Bai, “UV-CAST: an urban vehicular broadcast protocol” in Vehicular Networking Conference, 2010. https://doi.org/10.1109/VNC.2010.5698266
- K. Tonguz, N. Wisitpongphan, and F. Bai, “DV-CAST: A distributed vehicular broadcast protocol for vehicular ad hoc networks” IEEE Wireless Communications, 17(2), 47–57, 2010. https://doi.org/10.1109/MWC.2010.5450660
- Th. Eugster, P. A. Felber, R. Guerraoui, and A. M. Kermarrec. “The many faces of publish/subscribe” ACM computing surveys, 35(2), 114–131, 2003. https://doi.org/10.1145/857076.857078
- Leontiadis and C. Mascolo, “Opportunistic Spatio-Temporal Dissemination System for Vehicular Networks” in the 1st international MobiSys workshop on Mobile opportunistic networking, 2007. https://doi.org/10.1145/1247694.1247702
- Pandey, D. Garg, and M.M. Gore, “Publish/subscribe based information dissemination over VANET utilizing DHT” Frontiers of Computer Science, 6(6), 713–724, 2012. https://doi.org/10.1007/s11704-012-1154-7
- Niimi and S. Ishihara, “Demand map-based data dissemination scheme for location dependent data in VANETs” in Mobile Computing and Ubiquitous Networking, 2015 Eighth International Conference on, 2015. https://doi.org/10.1109/ICMU.2015.7061047
- Wischhof, A. Ebner, H. Rohling, “Information dissemination in self-organizing inter-vehicle networks” IEEE Trans. Intelligent Transportation Systems, 6(1), 90–101, 2005. https://doi.org/10.1109/TITS.2004.842407
- Nadeem, S. Dashtinezhad, C. Liao, L. Iftode, “TrafficView: traffic data dissemination using car-to-car communication” ACM SIGMOBILE Mobile Computing and Communications Review, 8(3), 6–9, 2004. https://doi.org/10.1145/1031483.1031487
- Ibrahim, M.C. Weigle, “Accurate data aggregation for VANETs” in the fourth ACM international workshop on Vehicular ad hoc networks, 2007. https://doi.org/10.1145/1287748.1287761
- Bronsted, L.M. Kristensen, “Specification and performance evaluation of two zone dissemination protocols for vehicular ad- hoc networks” in Specification and performance evaluation of two zone dissemination protocols for vehicular ad-hoc networks, 2006. https://doi.org/10.1109/ANSS.2006.43
- Lochert, B. Scheuermann, and M. Mauve, “A probabilistic method for cooperative hierarchical aggregation of data in VANETs” Ad Hoc Networks, 8(5), 518–530, 2010. https://doi.org/10.1016/j.adhoc.2009.12.008
- Sormani, G. Turconi, P. Costa, D. Frey, M. Migliavacca, and L. Mottola, “Towards Lightweight Information Dissemination in Inter-Vehicular Networks” in the 3rd international workshop on Vehicular ad hoc networks, 2006. https://doi.org/10.1145/1161064.1161069
- Space-Time Engineering, https://www.spacetime-eng. com/ (Accessed 28th September 2017)
- SUMO — Simulation of Urban Mobility, ttp://sumo.dlr.de/wiki/Main_Page (Accessed 28th September 2017)
No related articles were found.