Clean Energy Use for Cloud Computing Federation Workloads

Adv. Sci. Technol. Eng. Syst. J. 2(6), 1–12 (2017);
 DOI: 10.25046/aj020601
Cloud providers seek to maximize their market share. Traditionally, they deploy datacenters with sufficient capacity to accommodate their entire computing demand while maintaining geographical affinity to its customers. Achieving these goals by a single cloud provider is increasingly unrealistic from a cost of ownership perspective. Moreover, the carbon emissions from underutilized datacenters place an increasing demand on electricity and is a growing factor in the cost of cloud provider datacenters. Cloud-based systems may be classified into two categories: serving systems and analytical systems. We studied two primary workload types, on-demand video streaming as a serving system and MapReduce jobs as an analytical systems and suggested two unique energy mix usage for processing that workloads. The recognition that on-demand video streaming now constitutes the bulk portion of traffic to Internet consumers provides a path to mitigate rising energy demand. On-demand video is usually served through Content Delivery Networks (CDN), often scheduled in backend and edge datacenters. This publication describes a CDN deployment solution that utilizes green energy to supply on-demand streaming workload. A cross-cloud provider collaboration will allow cloud providers to both operate near their customers and reduce operational costs, primarily by lowering the datacenter deployments per provider ratio. Our approach optimizes cross-datacenters deployment. Specifically, we model an optimized CDN-edge instance allocation system that maximizes, under a set of realistic constraints, green energy utilization. The architecture of this cross-cloud coordinator service is based on Ubernetes, an open source container cluster manager that is a federation of Kubernetes clusters. It is shown how, under reasonable constraints, it can reduce the projected datacenter’s carbon emissions growth by 22% from the currently reported consumption. We also suggest operating datacenters using energy mix sources as a VoltDB-based fast data system to process offline workloads such as MapReduce jobs. We show how cross-cloud coordinator service can reduce the projected data- centers carbon emissions growth by 21% from the currently expected trajectory when processing offline MapReduce jobs.
1 Introduction
Over the past decade, cloud-based systems have been required to serve an increasing demand from users work flows and data. Cloud-based systems may be classified into two categories: serving systems and analytical systems. The former provides low-latency read or write access to data. For example, a user requests a web page to load online or requests video or audio streaming. The latter provides batch-like compute tasks that process the data online that are later sourced to the serving systems. The service level objectives (SLO) for serving jobs are on the order of fractions of a second, while the SLO for analytical jobs are on the order of hours, sometimes days.
Today, public cloud service providers (CSP) attempt to process both of these workloads with a rich platform that guarantees cost and SLO to their clients. Cloud computing is an emerging infrastructure with limited regulation and compliance requirements [1]. Recently the Office of Management and Budget issued a Federal Data Center Optimization Initiative that promotes increasing use of Green Energy and increased utilization efficiency for all US Federal datacenters [2]. Specific target numbers are set for the end of fiscal year 2018. This publication addresses how those federal requirements may be attained and how federated cloud computing is a key enabler for attaining those performance targets.
Beginning in 2013, the US government initiated a carbon-tax on IT organizations to encourage major CSPs to pursue green energy opportunities for their datacenters operations [3]. US datacenters are projected to consume approximately 73 billion kWh by 2020 [3] with a corresponding increase greenhouse gases. Green energy generation growth is expected to triple by 2040 [4]. However, there is no cohesive system existing to coordinate the rising datacenter energy demand with rising green energy supply. This chapter utilizes Cloud-Federation as a multi-cloud resource coordination system that matches computational resource demands with available energy supply to maximize the utilization of green energy for processing cloud-workloads.
Most CSPs seek more market share in competition with other CSPs. One outcome of such competition is an evergrowing infrastructure in the form of new datacenters across the globe with no countervailing forces to meet user demand more efficiently and satisfy societal environmental and energy requirements. This sub optimum use of infrastructure increases the carbon footprint attributable to cloud computing services and also drives up costs to CSP’s. The following sections investigate two types of workloads, serving and analytical systems. This chapter will focus on two workload types, On-demand streaming as a representation of serving systems. It will also investigate analytical systems and present a unique model that allows optimal clean energy usage.
1.1 Enabling Green Content Distribution Network by Cloud Orchestration
On-demand streaming constitutes up to 85% of Internet traffic consumption [5]. On-demand streaming content is managed and distributed by content service providers. It then cached and distributed by Content Delivery Networks(CDN) located at the edges of the Internet network close to the consumers. Because streaming constitutes such a large fraction of Internet resource consumption, this paper will, of necessity, focus on methods to employ green energy to better operate CDN instances of on-demand streaming jobs, which include both video and audio content.
Meeting the Federally mandated approach of maximizing the utilization of green energy to operate CDN instances (for government with recommendations for private sector use as well) requires an energy source-demand coupling scheme that insures SLO levels of power availability but is structurally biased towards green energy sources over hydrocarbon fueled energy sources. A system to accomplish this will have to provide seamless failover in the case of sudden interruption of green energy to grid-energy sources or vice versa i.e., fallback from grid-energy to green energy when surplus green energy is available.
User expectations in on-demand streaming requires different service level requirements than other serving systems workloads. Serving systems workloads are comprised of interactive sessions that pivots on minimum latency. However, low latency is less critical in analytical on-demand streaming since application clients use buffering techniques to mitigate long latency effects. Therefore, ondemand streaming workloads fits, more closely than interactive workloads, with the observed intermittent and varying green energy availability characteristics.
Green energy supply is unpredictable and requires a complex, adaptable, resource allocation system to provide CDN services with steady energy supplies while concurrently seeking minimal carbon footprint. This dynamic availability of green energy resources in a smart grid requires real time communication of both short term and predictive energy needs from cloud service providers to green energy providers. The green energy providers need to disclose availability dynamically to CSPs, who, in turn, disclose their changing energy demands for near term computing. SPs can then better maximize the use of green energy for on-demand streaming processing.
This is a classical resource management and coordination problem [6, 7]. The following approach builds upon prior work that was done in this area [8, 9], specifically that done on alleviating the sudden lack of green energy to meet low-latency workloads. The approach herein employs an application-buffering scheme that better allows for opportunistic, green, on-demand streaming processing. It requires an extended, cohesive, federated system that aggregates supply and demand across multiple geographic locations employing the smart grid command and control infrastructure to achieve an optimal dynamic matching of green energy sources and computing loads.
This chapter proposes an implementation that utilizes a control component in a federated cloud that coordinates and optimizes the resource allocation among the participant CDN providers. It treats the volatile nature of green energy resources as a resource allocation problem, the solution of which is a resource orchestration system that is optimized with the goal to operate increasingly near to the limit of supply by green energy sources constrained by SLO reliability requirements. This system will be demonstrated by modeling a prototype that simulates resource allocation in a micro federated cloud eco-system to achieve an energy supply-computation demand match optimized within seconds.
Since the focus of this work is on green energy utilization in a federated cloud, the scheduling algorithms and resource management issues, while important, are discussed only to the extent necessary to help the reader understand the required architecture for heterogeneous energy compute clustering. This work is meant both as a case study in energy utilization, and a presentation of a novel method of coordinating high-velocity data streams, and extended to a unified orchestration system, to optimize the performance of federated cloud systems.
The chapter starts, with the on-demand streaming economics, increased green energy utilization and anticipated smart grid progressions as applied to on-demand streaming. Then it discusses the green energy utilization problem is analyzed. Finally, we present a cloud coordinator prototype that is built on Kubernetes [10, 11], an open source cluster manger, and extend that prototype to discusses the need for and requirements of a unified system that orchestrates cluster compute resources in a federated cloud.
1.1.1 On-Demand Streaming and CDN
Over the last decade, video and audio traffic became the dominant segment of consumer internet traffic. Cloud service-providers such as Netflix, Amazon Instant and YouTube disrupted the prior linear TV data distribution model. Also, video streams delivered by mobile terminals grew as mobile connectivity improved [12]. Video streaming is expected to constitute up to 85% of Internet consumers traffic [5] within a few years. The US portion of video streaming is 14%[1] and the number of US Unique IPv4 connected addresses is 17% [12]. The streaming workload is comprised of live streaming and on-demand streaming, with the relative fractions of 6% and 94% respectively [5]. Other predictions support similar ratios, 12% livestreaming and 88% for on-demand.
A key driver for the rapid expansion of streaming video was the shift from specialized streaming protocols and infrastructures such as RTSP, and RTMP [13] to a simple HTTP progressive download protocol. This led to a shift from proprietary streaming appliances to commodity servers. In turn, this change removed a barrier for CDN’s to process on-demand workloads. Most present day, CDN service providers support a seamless integration with cloudbased object storage that pipelines the digital content from the organization site to the CDN instance that runs at the Internet provider edge[2]. Furthermore, the HTTP chunk-based streaming protocol support in a CDN allows the client application sufficient time to detect the optimal CDN instance to handle user workload. The optimal CDN instance assignment is done by the cloud control plane resource manager.
The prototype described below will demonstrate such optimal resource allocation.
We used server utilization and power metrics from [3, 12] to design the prototype. Most of these sources we considered have limited utilization rates and server utilization distribution. Also, utilization and power consumption do not scale linearly [14]. However, for clarity, in the interest of maintaining focus on the larger goal of the paper, CDN resource management systems for green energy utilization, we assumed linear relationships and accepted the risk of loss of accuracy in our estimates. High fidelity simulation accuracy is not critical for the goal of this chapter.
1.1.2 Energy Saving Potential in Operating a Distributed CDN Resource Management System
The approach is to aggregate the required traffic for ondemand workload processing, and use standard compute
device specification to assess the electrical energy and carbon footprint that will be required by that workload[3].
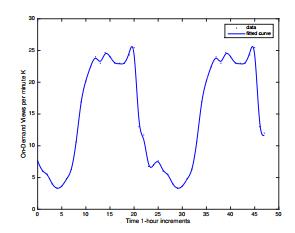 Figure 1: On-Demand Video views observed throughout 48 hours with 1-hour increments. Data was fitted with smoothingspline for curve and surface fitting [5]
The estimated data rate for streaming is given as S total = 63000PB/mo (where PB is Petabytes). Figure 1 shows users workload pattern of 9 busy hours in which the workload spans throughout 13 hours a day which yield 126PB/sec/mo/ The on-demand streaming portion is estimated as 78% across four main US regions denoted by k = 4, the number of region used, for the purposes of this paper although k can be varied depending upon the degree of granularity desired in the simulations. S on−demand denote the on-demand portion.
S on−demand = S total · 78% = 49140PB/mo nhours/day denotes the number of effective hours in a day
for streaming.
nhours/day = nbusy + k = 13
S on−demand
Drate = = 126PB/sec/mo
nhours/day
Nmax denotes the estimated number of required servers in maximum CPU capacity. Nmax is bounded by the maximum network throughput a single server can ingest. Standard commodity servers can handle up to 8.5Gbps i.e.
uopt denotes the CPU utilization factor so servers has sufficient capacity to handle management tasks. We estimate 60% utilization factor uopt = 100/60.
Nopt = Nmax · uopt = 118588235.3 · = 197647058.8
Es denotes the midrange server energy consumption for various server types s. We consider three types of servers:(1) compute server(5kWh/server), (2) digital storage server(1.7kWh/server) and (3) network server(1kWh/server). Storage server acts the digital storage controller. The network server acts as the router and switch. The compute server is the server that processes the on-demand streaming.
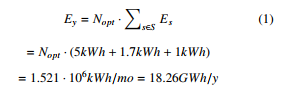
The saving potential from running on-demand video streaming using green energy resources is 18.26GWh a year based on current on-demand consumption and expected to grow 89% by 2019 [4]. i.e. 34.5GWh per year for on-demand streaming. The next sections will explain the challenges in utilizing green energy followed by a method that addresses some of these challenges and thereby maximizes the utilization of green energy.
1.2 Coordinating Green Clouds as DataIntensive Computing
The following paragraph focuses on analytical systems workloads that typically comprise 48% of the cloud workload [15]. Also, some of the workloads patterns can be predicted as recurring jobs [16] and the deadlines for analytical jobs are more liberal by an order of magnitude than the serving jobs. Finally, one of the ways to handle offline workloads is to process the data streams offline through a highly scalable data-parallel frameworks like MapReduce by submitting jobs to a control plane [17].
This chapter proposes a component in a federated cloud that will optimize the resource allocation and coordination among the participant CSPs. It will also focus on addressing the time and power volatile nature of renewable energy resources as a fast date problem. It will present a resource management system with a goal to increase the utilization of data-centers, and to operate increasingly to the limit of supply by renewable energy sources. Finally, a prototype is built to simulate resources allocation in a micro federated cloud eco-system to achieve a supply demand optimized match within seconds.
Clean energy sources are time and power volatile and require complex resource allocation and coordination systems to maintain highly available data-center service with steady energy at a minimal carbon footprint. Further, availability of clean energy resources in a smart grid can be pushed from a variety of energy sources deployed across the nation as can the pull needs of data-service centers. Thus, CSPs will publish their compute resources availability, and service providers (SP), will publish their changing energy demands for near term computing. These streams of data include both high-volume and high-velocity characteristics termed a fast-data problem [18]. Our proposal uses as a base previous work that was done in this area [8, 19, 20]. However, previous work treated clean energy within a single data-center operated by a CSP. The proposal below suggests an extended cohesive system that aggregates supply
and demand across multiple geographic locations employing the smart grid sense command and control to achieve an optimal match.
1.2.1 Optimum Clean Energy Utilization is a FastData Problem!
This study suggests that efficient, clean energy utilization requires three consecutive steps: (1) Clean energy resource availability signals. (2) Exploration and analysis of prior years seasonal solar data and current weather reports and evolving green energy capacity availability planning. (3) Acting fast enough based on the predictive analysis. The last step is the key component in solving the optimum allocation problem.
We judge that clean energy utilization is different from the classic big-data problem such as the Hadoop MapReduce Method. Big-data solutions solve the case where the data is at rest, not fully consistent (aka eventual consistency) and require liberal SLO that is later provided as computing trends, and other business intelligence applications. However, our case handles data in motion that requires consistent, real-time aggregation, and transaction processing. That is per-event decision making using both real-time contextual and historical data as dual guides for proper algorithms. Finally, we argue that based on the clean energies’ volatile nature, processing streams of compute demand and clean energy supply requires that a need for a compute resources can be addressed with a currently available demand.
1.3 Why is Green Energy Utilization Hard?
The following section describes why utilizing green energy for compute purposes, while a justifiable goal, is limited by SLO reliability. It will present a scenario where balancing time-varying energy generation patterns with changing dynamic energy demands of cloud computing sometimes conflict. The green energy time varying generation patterns considered by us focuses on wind and solar generation. Figure 4 show historical data on dynamic nature of green energy sources and Figure 5 shows the dynamic cloud energy demand.
1.3.1 Frequency Stability in Wind-Power Generation
The daily wind power variation characteristics will be employed as a metric that illustrates the duration and level for a given amount if wind energy availability. The electricity generation process from wind is comprised of a wind turbine extracting a kinetic energy from the air flow. The wind is rarely steady; it is influenced by the weather system and the ground surface conditions, which are often turbulent [21]. Also, the generation process must happen at the same instant it is consumed [22] unless it is stored in grid level battery banks. Unfortunately, grid level energy storage technology is not keeping up with grid level energy generation technology.
Sample wind and power generation data were obtained from NREL [22]. We used datasets from 2006-2012 across different regions in the US and aggregated more than 600 observations. Finally, the data were fit using smoothing splines[5]. The usable power generated from a wind turbine is generally described by a Rayleigh distribution [21]. It defines three main points in the wind power generation process: (1) the cut-in is the minimum viable wind speed for electricity generation from a wind turbine. (2) the rated level, describes the point where the power reached its local maximal capacity without adverse effects on the turbine life by too strong a wind. (3) Cut-Off, is the term for the local minimum for the generation cycle. Beneath that speed, there is not enough power for viable electricity generation. Thus, if the wind velocity is too low, the data-server gets no wind energy. Figure 2 shows wind generation variations that crudely fit a Rayleigh distribution with b = 300 assuming the form of the Rayleigh Probability Distribution Function is:
x −x2 f(x|b) = e2b2 b2
The measured generation cycles range between 140 and 180 minutes per cycle. Equation 2 expresses the generated power by a wind turbine, given a wind velocity. The function g describes a viable electricity generation given a wind power. The wind power availability indications will be generated by a wind turbine and fed into the coordinator database as a potential power source to datacenters in a region. Our prototype will assume wind power availability indications as the wind tuple {region,cut-in,rated,cut-off} indications.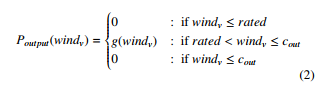
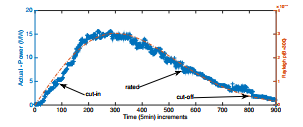 Figure 2: Aggregated wind power measurements between 2007-2012 that fits Rayleigh Distribution with b=300
1.3.2 Efficiency and Daily/Hourly Availability in SolarPower Generation
Photovoltaic solar (PV) energy availability is defined by the solar power intensity denoted by s(Watts/m2), which varies with local daylight hours and the clear or cloudy sky conditions [22]. Moreover, the PV cells are most effective at lower temperatures [23]. The PV cells electrical power generation, defined by Equation 3, is a function of the solar intensity denoted by ηsolar. Solar power generation also depends on the PV power efficiency denoted by s. It encapsulates both the predicated temperature,the sky conditions, the solar cell efficiency, and the DC to AC inverter efficiency. The solar cell area denoted by a(m2).
![]() Our prototype will assume solar power availability indications as the solar-tuple {region,power-efficiency}. Based on the solar generation pattern presented in figure 3, the generation prediction utilizes the the local time in a region and the given power-efficiency
Our prototype will assume solar power availability indications as the solar-tuple {region,power-efficiency}. Based on the solar generation pattern presented in figure 3, the generation prediction utilizes the the local time in a region and the given power-efficiency
 Figure 3: Aggregated solar power generation between 2008-2011 taken in Palm Springs CA, Prescott Airport CPV, AZ and Nevada Solar One, NV, indicating on a stable and fixed solar-based power [22]
1.3.3 Optimum Green Energy Utilization for OnDemand Streaming is a Resource Management Problem!
This study suggests that efficient; green energy utilization for on-demand video streaming workloads has three main requirements: (1) efficient compute resource discovery, (2) efficient load balancing among the provisioned compute resources and (3) smart failover mechanism that mask failover events from green CDN-edge instance to grid CDN-edge instance while end-users stream on-demand video [24]. These are discussed below.
Compute Resources Discovery. This assessment comprises both internal and external discovery. Internal discovery refers to CDN-edge instances that run in compute pods that must be able to be easily discovered and connected to control-plane endpoints consistently regardless of which cloud-service-provider is hosting the CDN-edge. External discovery refers to the ability of end-users discovering CDN-edge instances through DNS services for HTTP(S) on-demand video streaming.
Optimal Load Balancing is the seeking of the ”best” CDN-edge, based on optimization criteria, for any given the workload processing. After initial discover and connection, clients should be served by the optimal instances based on proximity from the end-users, current load factor, and the availability of green energy resources. e.g., session requests originated from New Jersey should be served by US East as oppose to US West to avoid latency and signal loss.
Efficient Failover is a main component for on-demand video streaming based on green energy. If the endpoint becomes unavailable, in this case due to a sudden lack of green energy, the system must failover the client to another available endpoint that manages the streamed content. Also, failover must be completely automatic i.e. the clients end of the connection remains intact, and the end-user oblivious to the failover event, which means that the end-user’s client software requires no support handling failover events. Finally, multiple CDN-edge instances co-located in a region should be accessible by end-users through Domain Naming Service (DNS), as most clients-streaming (browsers) software supports DNS resolutions for finding available CDNedges.
The green energy utilization model for processing on-demand video streaming is different than the classic scheduling problem where classical optimal resource allocation techniques are applied [25, 26]. We argue that based on the green energies’ volatile nature and the on-demand video streaming workload characteristics, the optimal resource allocation approach should be opportunistic. It requires an effective resource management system for processing on-demand video streaming workloads. Our prototype will employ a Kubernetes flavor ”Ubernetes” that implements the three main requirements above.
2. Clean Energy Mix Evaluation for Online On-Demand System
In the following section we evaluate a compute load coordination system component that harmonizes on-demand streaming job demands with available compute resources, with priority given to those powered by green energy sources. Such resources will be published to the coordination system through a resource availability tuple {region,cut-in,rated,cut-off,power-efficiency}, where region indicates the geographic availability region. powerefficiency indicates solar or wind based energy power efficiency. cut-in, rated and cut-off the values appropriate to those energies.
On-demand streaming job demand includes the specific region, total-job workload, load-factor, as well as contract deadline SLA. The load-factor indicates the required number of CPU cores per the total-job-workload. The geographic region indication will be used to optimize the match between the supply and demand. Also, the total-jobworkload and the deadline will be compared against the cutin,rated, cutoff time for wind or power-efficiency for solar, based on the published load-factor.
We suggest a hybrid datacenter that does not deviate from the common datacenter architecture. The core difference lies on an automatic transfer switch (ATS) that switches between different available power sources: generator, grid or green energy when available. In both cases the datacenter design does not change and requires incremental changes only by adding green energy power sources to the datacenter’s ATS’s (Figure 6).
We suggest two types of compute clusters, greenclusters powered by green energy and grid-clusters powered by the electrical grid. Figure 6 shows a simplified datacenter power distribution that supports green energy sources. In such datacenter, both serving and analytical systems deployed in grid clusters. Further, for incoming analytical workloads, few clusters use green resources when there are a viable green energy and mostly standby. As a mitigation strategy, a compute live migration procedure will be available in case of unpredicted lack of renewable resources during a workload processing which presents a risk for SLO violation.
2.1 Experiment Planning
Below is simulation of a cross-regional platform that is comprised of control-plane, workload-plane and coordinating components. This will be embodied in a resource allocation system (Kubernetes). This system will: (1) provision resources to be neared users; (2) optimize utilization by prioritizing the use of underutilized resources; and (3) seamlessly remove malfunctioning hardware from the system. The control-plane will enable an effective compute resource provisioning system that spans across different public cloud providers and regions. The coordinating components will accept user-workload demands as well as green energy availability from various regions and opportunistically seek to process streaming workloads using compute resources provisioned by green energy resources. The workload-plane will be comprised of edge streaming servers that process the end-user on-demand video streaming. It will built of standard Apache HTTP[6] servers that runs on the edge location.
The control-plane software infrastructure is based on Kubernetes [10], it facilitates internal discovery between CDN instances so instances can connect across different cloud boundaries and regions. Further, end-users can discover the optimal CDN-edges that are (1) nearby, (2) less loaded and (3) healthy. Finally, the Kubernetes automation framework allows the failover mechanism with no dependency upon the end-user client. In particular, we will exploit the livenessProbe option that automatically removes green-compute pods, a set of CDN-edge instances, in case of a sudden lack of green energy.
The coordinator component accepts incoming supply and demand traffic, calculates a potential match, within minutes, and notifies back the CSP and the SP for transaction completion. We use Redis[7] as the in-memory data store as the database that stores the system supply and demand calls originated by the end-user workload. The workload is generated by Jmeter instances[8]. The workload generated based on the on-demand video views observed by [12] depicted in Figure 1. Green energy availability simulated based on the known regional patterns depicted by Figure 2 and Figure 3.
We count the number of matches i.e. on-demand video streaming processed by CDN-edge instances operating on green energy. Also, we measure the false-positive cases where a match was suggested but did not met the SLO’s deadline due to a violation that caused by a sudden lack of green energy resources. We use the data to extrapolate the possible energy (kWh) that could be generated by the using green CDN-edge instances depicts in Equation 1.
2.2 Execution – The Preparation
The prototype experiment included the setup of three virtual datacenters deployed in different regions: (1) Central US, (2) West US and (3) East US. The clusters were sized based on US population distribution[9] by regions i.e. 20% for West US, 40% for East US and 40% Central US. The cluster sizes for West US, Central US, and East US are 3, 7 and 7 machines respectively. Each machine is standard 2CPU cores with 7.5GB of memory. Also, the user demand simulation will rely on the US population distribution. Finally, the green energy supply simulation will be based on wind or solar availability observed in the various regions.
The control-plane is comprised of docker API server and controller-manager. The controller coordinator component will need to allocate resources across several geographic regions different cloud providers. The API server will run a new federation namespace dedicated for the experiment in a manner such that resources are provisioned under a single system. Since the single system may expose external IPs it needs to be protected by an appropriate level of asynchronous encryption[10]. For simplicity, we use a single cloud provider, Google Container Engine, as it provides a multi-zone production-grade compute orchestration system. The compute instances that process the user workloads are deployed as Docker containers that run Ubuntu 15 loaded with Apache HTTP server. For simplicity, we avoid content distribution by embedding the video content to be streamed in the Docker image. We run 52 Docker containers that span across the three regions and act as CDN-edges. Green CDN-edge instances differ from grid CDN-edge instances by Kubernetes labeling. The simulation of the hybrid datacenter is depicted in Figure 6.
A coordination database system that aggregates green energy, solar or wind, availability, was built in software. When energy sources manifest the cut-in patterns depicted by Equation 2 and Equation 3, the coordination system starts green CDN edges in the availability regions. Also, when green energy availability reaches cut-off rates, the coordination system turns off green CDN edge instances.
2.3 Baseline and Variability of Workloads
The baseline execution included data populations of both green energy availability and user demand for video streaming. The data population was achieved by the Kubernetesbased Jmeter batch jobs. The loader jobs goal is to populate the coordinator database with green energy supply based on using a Weibull distribution, which is a generalization of the Rayleigh distribution described above for wind and a normal distribution for solar. Also, the user demand was populated according to the observed empirical patterns depicted by Figure 1.
We simulated the availability and unavailability of green energy using Jmeter-based workload plan against the coordination system. Our implementation starts green CDNedge instances opportunistically upon green energy availability. Once a CDN-edge instance declares its availability it processes live workloads.
We use the Kubernetes livenessProbe for communication between CDN-edge instance pool and its loadbalancer that divert traffic to its pool members. Finally, another workload Jmeter-based simulator generates ondemand streaming calls. This workload simulates end-user
demand. It includes HTTP progressive download calls to pre-deployed video media in the CDN-edges.
2.4 Main Execution
In each of the three regional CDN-edge clusters the Kubernetes Jmeter batch jobs that generated green availability traffic to the coordination component were executed. The simulation is comprised of availability indication that are based on Figure 2 and Figure 3. We randomized solar production by using a factor of α = 0.2 based on collected data between 2008-2011 in Palm Springs CA, Prescott Airport CPV, AZ and Nevada Solar One, NV [3]. Also, we randomized the wind production by a factor of β = 0.4 based on collected data between the years 2007-2012 [22]. The demand simulations included a set of calls to the coordinator component spread across 48 hours. The calls originated from three different timezones. The supply simulations consist of wind and solar-based energy time and power windows.
The experiment executions generated two main data traces that we used for the resulting generation computation. The first trace is the simulators logs. The simulator logs includes the demand and supply records. Demand records stored in the Redis key-value store under the key ”DemandEvents” followed by timestamp, region and the required compute capacity. The supply calls were stored in the Redis key-value store under the key ”SupplyEvents” follows by timestamp, region and supply phase i.e. cutin, cutout or rated. For query simplicity the loader ingested three types of records for each supply and demand the by the keys: (1) supply or demand (2) timestamp, and (3) by region. This approach optimized the coordinator queries by timestamp and regions for green CDN-edge instances allocation.
The second trace is the actual allocation logs. It is generated by the coordination system that invokes the Kuberenetes command for green CDN-edge instances initialization and disposal. This was used to determine the green energy utility translated into energy (kWh) that did not use grid energy sources.
2.4.1 Limitations
Every supply and demand was recorded three times to ease the query process. This approach was used since Redis provided limited query abilities by different keys. This approach might suffer data inconsistency issues where a supply metric was successfully committed to one key recode but missing on other key. Production systems should add extra safety gates when ingesting data. We used Redis because of its popularity in the Kubentese community. However, our approach is not limited to Redis or other database systems for that matter.
When measuring the green energy overall utility, we used the container initialization and disposal as indication that green energy utility was used. Specifically, we used the ‘kubectl logs POD‘ command based on the assumption that the coordination system invocation commands are tightly coupled with green energy availability. It is likely that collecting the actual video streaming traces through the various Apache access logs of the CDN-edges will be more accurate.
In the case of a sudden lack of green energy while streaming video a failover occurs. Such failover event relies on domain naming services (DNS), the impact of DNS caching was not included since that might cause streaming delay on the user side. Also, when the coordinator algorithm determines there is enough green energy available it will take grid pods down and activate green pods up in a controlled fashion e.g., one at a time so that no requests are lost during the transition phase. For simplicity, the algorithm avoid that.
2.5 Analysis
The green energy supply simulation plotted in Figure 4 shows the energy generation in MW for both wind and solar sources. The simulated amounts were adjusted to the amount observed in the traces between 2007-2012 [22].
The user workload simulation plotted in Figure 4 follows the observed user patterns depicts in Figure 1. Also, it shows the aggregated green energy availability for each region. The cloud-coordinator uses these data sets to determine if there is enough green energy available before provisioning green-pods and possibly taking grid-pods down.
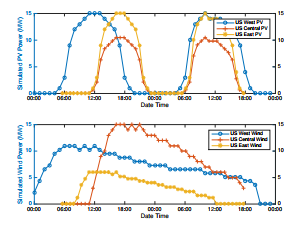 Figure 4: Green energy availability simulated in MW across three regions.
Amounts are adjusted to NERL measurements i.e., wind generation in West US moderate, Central US outstanding, East US fair. For solar generation in West US strong, Central US moderate-high, and East US low.
The utility of the green energy was calculated based on the cases where sufficient green energy was available to run the green-CDN pods within the same region. Otherwise cross-regional latencies might degrade the on-demand video experience. The measurements in Figure 5 were adjusted to the estimates of required energy (kWh) for operating the green compute pods. The case where there was negative green energy available it was considered as a miss in the overall utility reckoning.
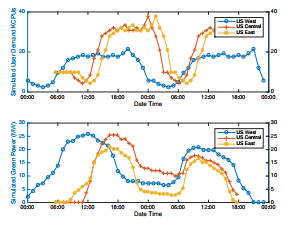 Figure 5: Video on-demand user workload per region adjusted with user population opposed to aggregated green energy availability, solar and wind energy.
2.6 Discussion on Energy Mix when Processing CDN Workloads
The scenario described above simulated the usage of green 801.3 kWh out of total 3642 kWh to process the video ondemand streaming workload. i.e. 22% by opportunistic matching. When counting the utility per region West US used 42% of the green energy. Central US used 28% of the simulated green energy. East US utilized only 18% as the initial ratio between user demand and green energy availability was relatively low. Although West US reached 40% utilization it contributed nationally only to the 20% portion it contains from the entire experiment test set. By way of comparison, Jeff Barr of AWS noted that their data centers utilize a 28% cleaner power mix[11]. Extrapolating the simulation results to the initial assessment in Equation 1 yields to a saving of:
(18.26(GWh)·1.89)·0.1($/kWh)·22% = $759,250.8/year
3. Clean Energy Mix Evaluation for Offline System
In the following section we evaluate a coordination component that harmonizes analytics jobs demands with available compute resources powered by green energy resources. Such resources will be published to the coordination system through a resource availability tuple {region,cutin,rated,cut-off,power-efficiency}, where region and powerefficiency indicates solar or wind based energy and region, cut-in, rated and cut-off of those energies.
Analytics job demand includes the specific region, totaljob workload, load-factor, as well as contract deadline stermed tuple. The load-factor indicates the required number of CPU cores per the total-job-workload. The region indication will optimize the match between the supply and demand. Also, the total-job-workload and the deadline will be checked against the cut-in-rated, cutoff time for wind or power-efficiency for solar, based on the published loadfactor.
sources through client simulator with a Java-based application that generates pseudo demand traffic to the coordinator service. The coordinator service will run on separate resources pool than the virtual-data-centers and the client simulator.(Figure 7)
The data collected includes customer workload for jobs processing and jobs deadline. Also, the number of matches
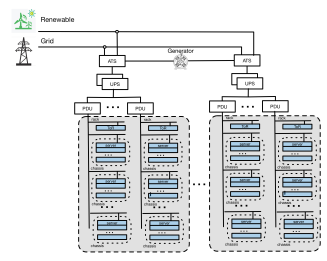 Figure 6: Datacenter Architecture – Compute server clusters aggregated by racks and chassis. Racks are fed by separate Power Distribution Unit (PDU) that connects to Uninterruptible Power Supply (UPS) that connects to the primary power source through Automatic Transfer Switch (ATS).
3.1 Experiment Planning
We wish to simulate an isolated group of computing resources so it can operate by various energy resources, especially available green ones. We use a group of leased resources from existing cloud providers to form a virtualdata-centers set that operates in a federated scheme. Each virtual-data-center includes with internal arbitrator component that collects and aggregates internal signals about its utilization and availability. The arbitrator then reports to the central coordination system. We use Apache Mesos[12]for the virtual-data-center abstraction.
Also, we build a highly available coordination component that accepts incoming supply and demand traffic, calculates a potential match, within minutes, and notifies back the cloud-service-provider and the service-provider for transaction completion. We use VoltDB[13] as the database and application server for the coordinator component.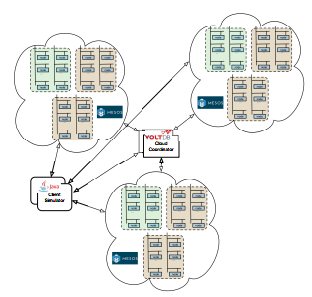
Figure 7: Experiment Architecture – Three virtual clusters deployed on a public cloud services located in a different regions grouped by Apache Mesos. A single VoltDB instance as the coordinator service. Finally, Client simulator that generates pseudo demand that sends data to process.
green clusters without SLO. Finally, we measure the falsepositive cases where a match was suggested but not met the SLO’s deadline due to a violation that caused by a sudden lack of clean energy resources. We use the data to extrapolate the possible carbon-footprint that could be generated by the used virtual clusters.
The research goal is to show a significant improvement in the carbon emission generation by data-centers. Let MtCO2e denote the carbon emission. Electrical usage can be consumed by the Consumers set: {cooling, storage, servers, CPU, power} systems and denoted by EU measured in kWh. The average regional carbon dioxide emissions measured in lbs/kWh and denoted by REco2. Therefore, the total electrical usage is:
![]()
![]() As the experiment uses virtual data-centers, we do not have access to the power consumption by the cooling, power and storage system. The results capture compute jobs durations measure in server CPUcoretime and use the average Thermal Design Power (TDP) of 200W per core (0.2kW). ci and ti denotes the number of cores and time used per job respectively. The electric usage by server (EUservers) will be the sum of the electric utilization of the executed jobs that was matched by the coordinator component (Equation 6)
As the experiment uses virtual data-centers, we do not have access to the power consumption by the cooling, power and storage system. The results capture compute jobs durations measure in server CPUcoretime and use the average Thermal Design Power (TDP) of 200W per core (0.2kW). ci and ti denotes the number of cores and time used per job respectively. The electric usage by server (EUservers) will be the sum of the electric utilization of the executed jobs that was matched by the coordinator component (Equation 6)
jobs
![]() We assume a linear relation between the power utilization of the cooling, power and storage systems with the servers power utilization. (Equation 4)
We assume a linear relation between the power utilization of the cooling, power and storage systems with the servers power utilization. (Equation 4)
3.2 Execution – The Preparation
The Preparation for the execution included the setup of the three virtual data-centers each with 6 machines D4 series with 8 Intel(R) Xeon(R) CPU E5-2660 0 @ 2.20GHz cores, 10Gbps NICs, 28 GB memory and run Ubuntu 15.0. Each virtual data-center is located in a different geo-location. The virtual data-centers were simulated by Mesosphere cluster with three jobtracker(Mesos masters) and three tasktracker(Mesos slaves). We installed Hadoop Cloudera CDH 4.2.1-MR1 on the takstrackers. The Coordinator Database run on a separate resource pool with 1 machine D series similar to the virtual data-centers specification. Finally, the loaders run on a 3 D2 series machines with 2 cores Intel(R) Xeon(R) CPU E5-2660 0 @ 2.20GHz cores, 10Gbps NICs, 7 GB memory and run Ubuntu 15.0. Apache Hadoop ships with a pre-built sample app, the ubiquitous WordCount example. The input data file was created using /dev/urandom on the takstrackers hosts[14]. The input data file was copied to the HDFS directory that was created as part of the Hadoop preparation (/user/foo/data).
Anticipated Required Deviations from the original job plan. The original plan was to simulate the scenario where the customer keeps his data at a different location than it might be processed. We plan on using a job migration scheme that was originally designed for workload migration across different geo-location[20]. The suggested method optimizes the bandwidth costs of transferring application state and data over the wide-area network. Our experiment generated the data file at the loader host and did not include the job migration. We believe that including the job migration aspect could impact the presented results. However, the job migrations proven efficiency and later studies minimize that deviation.
3.3 Baseline and Variability of Workloads
Baseline. The execution baseline included a load that runs without the coordinator component i.e. loaders generated load to the virtual data-centers resources for 48 hours. The load scenario included a single file generation that was submitted to one of the tasktrackers. The output of each executed jobs included the CPU time spent for each execution. The data collection included the execution log of the command: Hadoop jar loader.jar wordcount /user/foo/data /user/foo/out.
Variability of Workloads. The workload comprises of data files with words that need to be counted using the Hadoop WordCount. The load complexity depends on two factors, the file randomness level, and its size. We rely on the native operating system randomness, and our virtual data-centers and loaders are homogeneous. Therefore, the size is the remaining factor for differentiating workload types. We evaluated the federated-cloud coordinator by generating three load types simultaneously. The three types intend to cover the following cases (1) A match was found between workload and sufficient green energy resources. (2) A match was found, but there was not enough power to complete the job with no SLO deadline violation. (3) Like the former but with SLO deadline violation. The three types will be uniquely distributed across wind and solar based virtual data-centers.
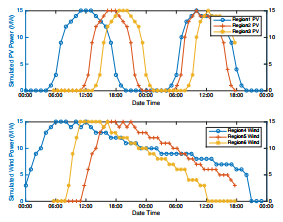 Figure 8: Green Energy availability simulated across six different timezones, three for PV power and the bottom three for wind. These indications are fed, in near-time, to the coordinator database that runs a temporal stored procedure that seeks for match with pending registered jobs.
3.4 Main Execution Issues
In each jobtracker host in a virtual data-center, we executed a simulator that generated green availability traffic to the coordination component. The simulation comprises of availability indication that are based on figure 2 and figure 3. We randomized solar production by using a missing factor of α = 0.2 based on collected data between 2008-2011 in Palm Springs CA, Prescott Airport CPV, AZ and Nevada Solar One, NV [22]. Also, we randomized the wind production by a missing factor of β = 0.4 based on collected data between the years 2007-2012 [22]. The demand simulations included a set of calls to the coordinator component spread across 48 hours triggered by a Monte Carlo simulation inspired by [27]. We built a Rayleigh-based distribution model in the Monte Carlo simulation using Matlab Statistics and Machine Learning Toolbox[15]. The calls originated from three different timezones. Each call comprises of the tuple {region,total-job-workload, load-factor, contract deadlines}. The supply simulators are comprised of the wind and solar-based energy time and power windows. Supply call to the coordinator includes the tuple {region,cutin,rated,cut-off,power-efficiency}. The coordinator runs a temporal stored procedure that find a match between the supply and demand data. When a match found, the coordinator generates an assignment call to the jobtracker in the corresponded virtual data-center to execute the jobs. The execution will fetch the data to be processed and report temporal statuses to the coordinator. Every status call generates a check against the current demand levels in the particular region. If the demand changed, and the request cannot be fulfilled, the job considered as false-positive. If the jobs are completed successfully, the request counted as success along with the Core/hour saved.
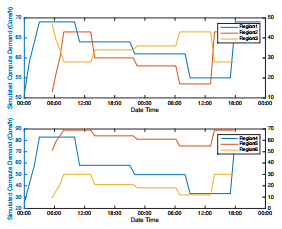 Figure 9: A Monte-Carlo-based simulated compute demand across six different timezones, three for PV power and the bottom three for wind. These indications are fed, in near-time, to the coordinator database that runs a temporal stored procedure that seeks for match with available green energy.
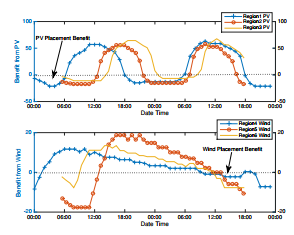 Figure 10: Job placement ranges denoted by the doted line in both the PV and the Wind plots. Any values above the zero levels indicate on potential benefits. However, assigned jobs might not be able to fully processed when unpredicted drop in the availability.
3.5. Analysis
The experiment executions generated three core data logs that we used for the result generation. The first data set is the simulators logs. The simulator logs comprise of the demand records. Demand records stored in the Demand VoltDB table. The supply calls were stored in the Supply
VoltDB table. The match transactions stored in the Jobs VoltDB table with status and the number of cores/hour used for the job. Status values can be Success or False-Positive. Figure 9 shows the two supply indications. Both signals were generated based on Equation 2 and Equation 3. The demand data was generated based on known usage patterns that are spread across three timezones.
3.6. Discussion on Energy Mix when Processing Offline Workloads
The experiment simulated the usage of green 708 kWh out of total required 3,252 kWh for analytical systems workload processing i.e. 22% less carbon emission (Equation 5). 1822 kWh, 50% of the total workload consumption, was processed by brown energy because of false-positive events i.e. the coordinator assigned a job with no sufficient green recourses to process the job. We believe that optimizing the coordinator algorithm can improve the footprint reduction up to 50%.
Figure 10 shows the job placement ranges denoted by the dotted line in both the PV and the Wind plots. Any values above the zero levels indicate on potential benefits. However, such cases are subject to false positive events that can occur when an unpredicted drop in the availability. Further, such cases utilize the hybrid datacenter power scheme describes in figure 6.
4. Conclusions
The future growth of cloud computing will increase its energy consumption as a fraction of grid power and will cause a significant addition to the ever growing carbon emission since 70% of US power is generated by hydrocarbon fired power plants. Using rapidly emerging green energy for processing cloud computing workloads can limit the anticipated carbon emission growth. However, balancing time varying green energy utilization with time varying energy demands of cloud computing is a complex task that requires sophisticated command and control prediction algorithms beyond the scope of this paper but are emerging in the form of a smart grid system of systems [28]. Our study shows that green energy utilization for on-demand streaming workload is best described as a resource management problem. The solution presented demonstrates real time balance of green resource supply and cloud computing workload demand and utilizes Ubernetes, an open source container cluster manager. The results approximate within 21% those observed in a single cloud instance in the field. Our study also shows that green energy utilization for offline workload processing is a fast data problem. Its solution best utilizes VoltDB, an in-memory database, to allow near-time response for green resources supply and workload demand. Our future work will focus on optimizing the false-positive ratio, to further reducing the cloud computing carbon footprint by up to 50%.
Conflict of Interest The authors declare no conflict of interest.
- Mell, P.; Grance, T. Department of Energy 2011,
- Rao, L.; Liu, X.; Xie, L.; Liu, W. Minimizing electricity cost: Optimization of distributed internet data centers in a multi-electricity-market environment. INFOCOM, 2010 Proceedings IEEE. 2010; pp 1–9.
- Shehabi, A.; Smith, S.; Sartor, D.; Brown, R.; Herrlin, M.; Koomey, J.; Masanet, E.; Horner, N.; Azevedo, I.; Lintner, W. Data Center 2016,
- Outlook, A. E. Department of Energy 2010, 92010, 1–15.
- Krishnan, S. S.; Sitaraman, R. K. Understanding the effectiveness of video ads: a measurement study. Proceedings of the 2013 conference on Internet measurement conference. 2013; pp 149–162.
- Liu, X.; Dobrian, F.; Milner, H.; Jiang, J.; Sekar, V.; Stoica, I.; Zhang, H. A case for a coordinated internet video control plane. Proceedings of the ACM SIGCOMM 2012 conference on Applications, technologies, architectures, and protocols for computer communication. 2012; pp 359–370.
- Biran, Y.; Collins, G.; Dubow, J.; Pasricha, S. Coordinating Green Clouds as Data-Intensive Computing. 2016: 3rd Smart Cloud Networks & Systems Conference (SCNS’16). 2016; pp 1–8.
- Lim, N.; Majumdar, S.; Ashwood-Smith, P. Engineering resource management middleware for optimizing the performance of clouds processing mapreduce jobs with deadlines. Proceedings of the 5th ACM/SPEC international conference on Performance engineering. 2014; pp 161–172.
- Biran, Y.; Collins, G.; Liberatore, J. Coordinating Green Clouds as Data-Intensive Computing. 2016 IEEE Green Technologies Conference (GreenTech). 2016; pp 130–135.
- Burns, B.; Grant, B.; Oppenheimer, D.; Brewer, E.; Wilkes, J. Communications of the ACM 2016, 59, 50–57.
- Biran, Y.; Collins, G.; M, B. J.; Dubow, J. Advances in Science, Technology and Engineering Systems Journal 2017, 2, 553–561.
- Nygren, E.; Sitaraman, R. K.; Sun, J. ACM SIGOPS Operating Systems Review 2010, 44, 2–19.
- Maier, G.; Feldmann, A.; Paxson, V.; Allman, M. On dominant characteristics of residential broadband internet traffic. Proceedings of the 9th ACM SIGCOMM conference on Internet measurement conference. 2009; pp 90–102.
- Barroso, L. A.; Clidaras, J.; Holzle, U. Synthesis lectures on computer architecture 2013, 8, 1–154.
- Abolfazli, S.; Sanaei, Z.; Ahmed, E.; Gani, A.; Buyya, R. IEEE Communications Surveys & Tutorials 2014, 16, 337–368.
- Ferguson, A. D.; Bodik, P.; Kandula, S.; Boutin, E.; Fonseca, R. Jockey: guaranteed job latency in data parallel clusters. Proceedings of the 7th ACM European conference on Computer Systems. 2012; pp 99–112.
- Dean, J.; Ghemawat, S. URL: http://static. googleusercontent. com/media/resear ch. google. com (diunduh pada 2015-05-10) 2004, 10–100.
- Lam, W.; Liu, L.; Prasad, S.; Rajaraman, A.; Vacheri, Z.; Doan, A. Proceedings of the VLDB Endowment 2012, 5, 1814–1825.
- Liu, Z.; Lin, M.; Wierman, A.; Low, S. H.; Andrew, L. L. ACM SIGMETRICS Performance Evaluation Review 2011, 39, 62–66.
- Buchbinder, N.; Jain, N.; Menache, I. NETWORKING 2011 2011, 172–185.
- Deshmukh, M.; Deshmukh, S. Renewable and Sustainable Energy Reviews 2008, 12, 235–249.
- Energy, G. NREL Subcontract Report 2010, 1–13.
- Tiwari, A.; Sodha, M. Solar Energy 2006, 80, 751–759.
- Abdelbaky, M.; Diaz-Montes, J.; Parashar, M.; Unuvar, M.; Steinder, M. Docker containers across multiple clouds and data centers. Utility and Cloud Computing (UCC), 2015 IEEE/ACM 8th International Conference on. 2015; pp 368–371.
- Beloglazov, A.; Abawajy, J. Future generation computer systems 2012, 28, 755–768.
- Zhang, Q.; Zhu, Q.; Boutaba, R. Dynamic resource allocation for spot markets in cloud computing environments. Utility and Cloud Computing (UCC), 2011 Fourth IEEE International Conference on. 2011; pp 178–185.
- Feijoo, A. E.; Cidras, J.; Dornelas, J. G. IEEE transactions on Energy Conversion 1999, 14, 1582–1588.
- Biran, Y.; Collins, G.; Azam, S.; Dubow, J. Federated Cloud computing as System of Systems. Computing, Networking and Communications (ICNC), 2017 International Conference on. 2017; pp 711–718.