Analysis of Learning Development With Sugeno Fuzzy Logic And Clustering

Adv. Sci. Technol. Eng. Syst. J. 2(5), 26–30 (2017);
 DOI: 10.25046/aj020505
In the first journal, I made this attempt to analyze things that affect the achievement of students in each school of course vary. Because students are one of the goals of achieving the goals of successful educational organizations. The mental influence of students’ emotions and behaviors themselves in relation to learning performance. Fuzzy logic can be used in various fields as well as Clustering for grouping, as in Learning Development analyzes. The process will be performed on students based on the symptoms that exist. In this research will use fuzzy logic and clustering. Fuzzy is an uncertain logic but its excess is capable in the process of language reasoning so that in its design is not required complicated mathematical equations. However Clustering method is K-Means method is method where data analysis is broken down by group k (k = 1,2,3, .. k). To know the optimal number of Performance group. The results of the research is with a questionnaire entered into matlab will produce a value that means in generating the graph. And simplify the school in seeing Student performance in the learning process by using certain criteria. So from the system that obtained the results for a decision-making required by the school.
1. Introduction
The quality of education is largely determined by the ability of schools to manage the learning process and more specifically the learning process that takes place in the classroom. In particular students who are still in junior high school who have adolescence, adolescence is a critical period in the development cycle of a person, where at this time there are many changes, both biological changes, psychological and social changes. This phase of change often leads to conflict between adolescents with themselves and conflicts with the surrounding environment. If the conflict cannot be resolved properly then in its development can bring negative impact, especially on adolescent character maturation and not infrequently trigger the occurrence of mental disorders.
Mentally and emotional disorders such as depression, behavior problems and substance abuse among children and adolescents cause a heavy burden for families, nations and themselves. For that required an expert to diagnose developmental learning disorders in children by knowing the graph of learning disorders of the learners themselves. By knowing the graph of the level of learning disorders of students, teachers and parents can find out how to educate and more to control the level of patience in educating children.
The data used for the diagnosis of developmental learning disorders categorized mental emotional problems and learning behavior is from the problem below:
1. Behavior
2. Feelings
3. Relationships
4. Individuals who never mature
From the above variables, the authors analyze by applying the fuzzy logic method, because it is very flexible and has a tolerance to data that is not appropriate and based on natural language.
And also the author tries to add the processing in the analysis of Student Learning Performing Grouping by applying Clustering method by assessing:
1. Material
2. Discipline
3. Attitude
2. Research Methods
In order to obtain the data that can be in this study, then held the factors that affect student learning disorders is a factor in everyday life. Learning disorder factors are acceptable in a variable that is:
Table 1. Types of Bounce Emotions and Behavior Problems in Learning Information:Here the author previously explained in the table above that categorized:1. Borderline learning problems describe the behavior and disorders of children who are changing.2. And if abnormal learning problems are excessive child’s behavior and disorder.
3. Discussion
Illustrations to clarify the notion of a fuzzy rule system. Suppose we want to build a system to control the storage tool, then the process is needed:
3.1. Fuzzification
The input of truth value is certain (crisp input) is converted to fuzzy input form, which is linguistic value whose semantic is determined based on membership function.
3.2. Inference
To distinguish from Firs-Order logic, syntax, a fuzzy rule is written as IF antecendent THEN consequent.
3.3. Defuzzification
At this stage of defuzification we calculate the average (Weight Average / WA) of each predicate on each variable using the following equation:
Information:αn = the value of the predicate rules to-n
Zn = index to the output value -n
4. General Needs
Emotional and mentality problems that are not resolved properly, it will have a negative impact on the development of adolescents in the future, especially on the maturation of his character and not infrequently trigger the occurrence of emotional and behavioral mental disorders that can be high-risk behavior. This shows that 80% of adolescents aged 11-15 years are said to have exhibited risk behaviors such as misbehavior in school, substance abuse, and anti-social behavior (stealing, fighting, pulling, or ditching) and 50% of them also show behavior Other high risk factors such as drunk driving, sexual intercourse without contraception, and minor criminal behavior.
Motivation of teachers to work will encourage to achieve the success of teaching and learning activities. One measure of the success of teaching and learning can be seen from the value obtained from students didikannya.
From the results of questioning based on the questionnaire can be retrieved important data available to be re-managed into information that will be used as source based on the criteria or variables contained in the questionnaire.
Start the fuzzy logic toolbox on matlab by typing fuzzy on the commad window. Next will appear FIS Editor window view with sugeno type. To start the FIS with the usual sugeno type start by adding and adjusting the input and output.
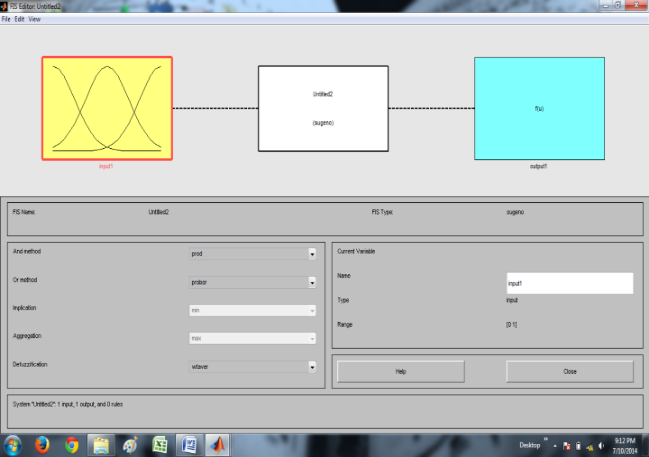 Figure 1. FIS Editor
The next step is to add the desired number of parameters of behavior, feelings, relationships, individuals who never mature.
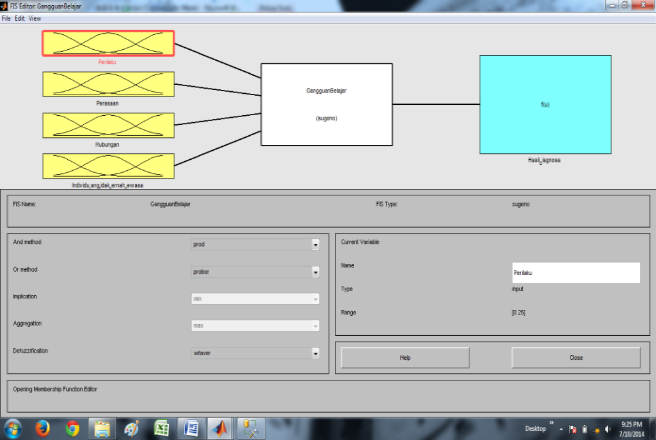 Figure 2. FIS Editor Tipe Sugeno
Description, picture above is Variable in Sugeno type. Each input parameter has a certain value, each being a membership function (MF) that has a different type.
For category I using type zmf, category II using type zmf, category III using type zmf and category IV using type zmf. The output variables in the form of results have two categories of MF, namely Borderline (changing nature) and Abnormal (hard and excessive bars). Both categories use tippet zmf.
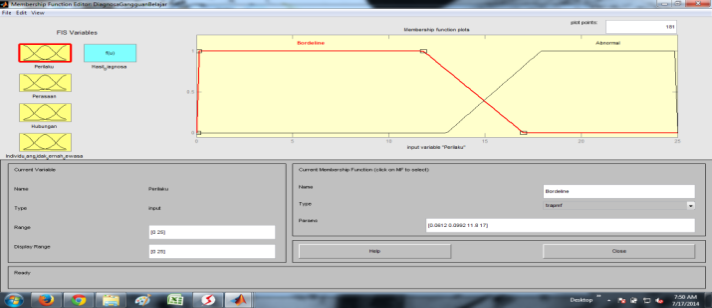 Figure 3. Membership Function Behavior
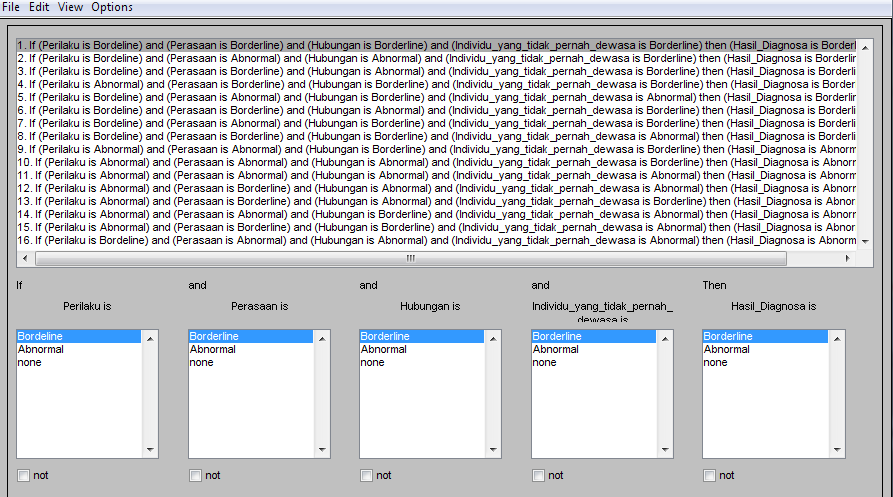 Figure 4. Rule Editor
The above picture is the Membership Function (MF) of each variable inputted in the Sugeno type. The use of four input variables with each variable has three MF, then made the rule as much as 16 pieces with the algorithm as follows:
In full, the entire algorithm is created in the Rule Editor by using operand and in determining the result value. As seen in the picture.4 Rule Editor.
Description, the picture above is Rule-rule that will determine the final result in Sugeno type.
The algorithm created in Rule Editor can be visualized by using Rule Viewer, which by using the input parameter values will get the output value.
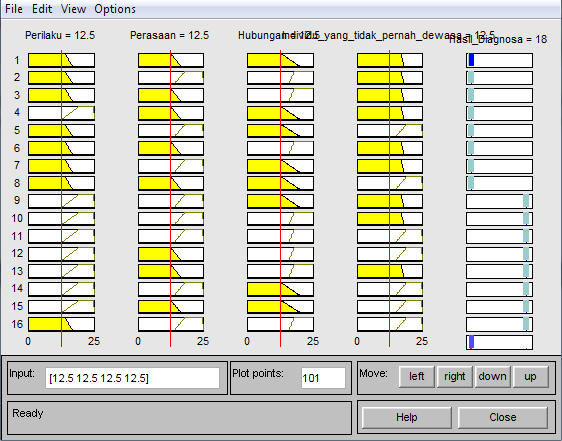 Figure 5. Rule Viewer TipeSugeno
Description, picture above is Rule Viewer in sugeno type. The result of algorithm created in rule editor can be shown in graphical form by using surface viewer. That is shown below.
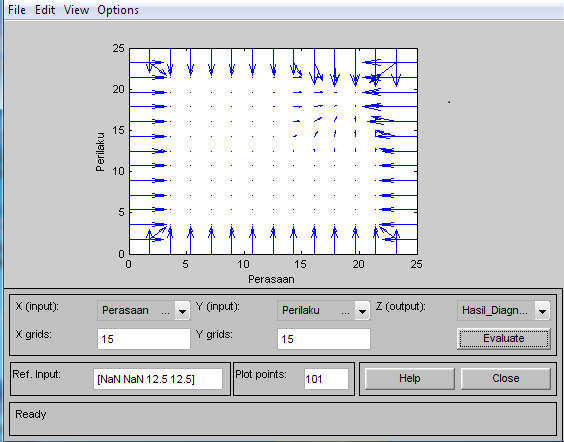 Figure 6. Surface Viewer Tipe Sugeno
The conclusion of the results at the input is:
Table 2. Diagnosis of rule input into Matlab
But in subsequent processing using Clustering Grouping Method. To facilitate the school in seeing Student performance in the learning process by using certain criteria. So from this system obtained the results for a decision-making required by the school.
Here is a flow chart drawing of K-Means algorithm :
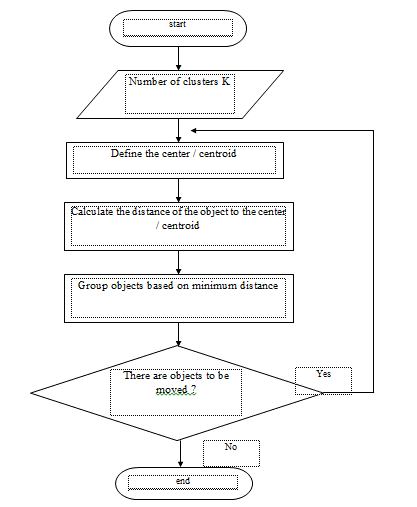 Figure 7. Flow chart of K-Means
Information:
1. First select the number of clusters k. The initialization of this cluster center k can be done in various ways. The random way is often used, the cluster centers are scored with random numbers and used as the starting cluster center.
2. Calculate the distance of each data that exists on each cluster center.
3. Determine the cluster with the closest distance to each data.
4. Reassemble each object using the new cluster center. If the cluster center has not changed again, then the clustering process is complete. When changed, then go back to step no.3 until the cluster center does not change anymore.
To form a group of objects, the first thing to do is to measure the euclidean distance between two points or objects or items X and Y defined as follows:
| Deuclidean (X,Y) =
|
Table.3 Distance Determination
| Student | Material | Discipline | Attitude |
| X | Y | Z | |
| A | 3,15 | 3,83 | 3,75 |
| B | 3,63 | 3,88 | 3,95 |
| C | 2,98 | 3,88 | 3,75 |
| D | 3,63 | 3,95 | 3,90 |
| E | 3,35 | 3,88 | 3,93 |
| F | 3,33 | 3,88 | 3,95 |
| G | 3,83 | 3,95 | 3,93 |
| H | 3,30 | 3,95 | 3,85 |
From the results of the above data then grouping group can be seen in the table below:
Table.4 Group Determination
Group Search / Determination:
1. If the shortest distance is in C1 then Will be entered into group 12. If the shortest distance is in C2 then Will be entered into group 23. If the shortest distance is in C3 then Will be entered into group 3
From the results of the above table, the centroid for the second iteration is determined as follows:
Centroid 1
X=(3,15+3,63)/2 = 3,39
Y=(3,83+3,88 )/2 = 3,86
Z=(3,75+3,95 )/2 = 3,85
Centroid 2
X=(2,98+3,30)/2= 3,14
Y=(3,88+2,95)/2= 3,42
Z=(3,75+3,85)/2= 3,80
Centroid 3
X=(3,63+ 3,35+ 3,33+ 3,83)/4= 3,54
Y=(3,95+3,88+ 3,88 + 3,95)/4= 3,92
Z=(3,90+3,93+ 3,95 + 3,93)/4= 3,93
From the results of the above analysis, the results obtained as shown in Figure 8 below:
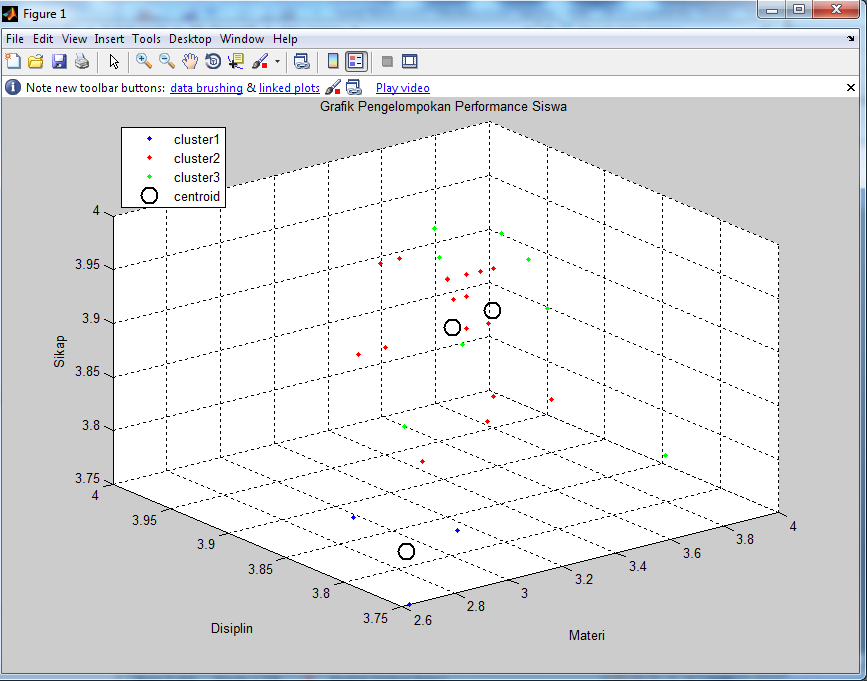 Figure 8 Display Clustering Results
5. Conclusions
From the results of testing the system has been done, it can be taken several conclusions including the following:
1. The system is expected to help users to analyze developmental learning disorders in children.
2. By using the method of data mining will be easy in doing grouping ability or student performance.
3. Data processing is done with the help of matlab program (matrix laboratory) which can calculate the calculation with decludean formula.
4. Utilization of this technology as auxiliary tool to diagnose developmental learning disorders enough to assist the task of a teacher expert (guidance and counseling) and other teachers.
- Yusuf Munawir dkk , Pendidikan Bagi Anak Dengan Problem Belajar, Surakarta : Tiga Serangkai Pustaka Mandiri, 2003.
- Prof. Dr. Martini Jamaris, M.Sc.Ed, Kesulitan Belajar, Jakarta : Ghalia Indonesia, 2013.
- Prof. Dr. H. Prayitno, M.Sc.Ed.dkk, Dasar-dasar Bimbingan dan Konseling, Jakarta : Rineka Cipta, 1994.
- H. Mohammad Asrori, .Pd, Penelitian Tindakan Kelas, Bandung : CV Wacana Prima, 2008.
- Jogiyanto HM, Analisis & Desain Sistem Informasi : Pendekatan Terstruktur Teori dan Praktik Aplikasi Bisnis, Yogyakarta : Andi, 2005.
- Kusrini dan Luthfi Emha Taufiq, Algoritma Data Mining, Yogakarta: Andi, 2009
- Berry dan Linoff, Data Mining Tecnicque for marketing Sales and Customer Support, Yogyakarta:Andi Publisher, 2008
- Kusuma Dewi Sri, Artificial Intelligence (Teknik dan Aplikasinya), Yogyakarta: GRAHA ILMU, 2003.
- Naba Eng Agus, Belajar Cepat Fuzzy Logic Menggunakan MATLAB, Yogyakarta:
Andi, 2009.