Pixel-Based Unsupervised Classification Approach for Information Detection on Optical Markup Recognition Sheet
Pixel-Based Unsupervised Classification Approach for Information Detection on Optical Markup Recognition Sheet
Volume 2, Issue 4, Page No 121-132, 2017
Author’s Name: Enoch Opanin Gyamfia), Yaw Marfo Missah
View Affiliations
Kwame Nkrumah University of Science and Technology-Kumasi, Department of Computer Science, Ghana
a)Author to whom correspondence should be addressed. E-mail: enochopaningyamfi@outlook.com
Adv. Sci. Technol. Eng. Syst. J. 2(4), 121-132 (2017); ![]() DOI: 10.25046/aj020417
DOI: 10.25046/aj020417
Keywords: Contrast Limited Adaptive Histogram Equalization (CLAHE), Standard Hough Transform (SHT), Predictive Accuracy Rate (PACC), Precision Predictive Value (PPV), Negative Predictive Value (NPV)

Export Citations
This paper proposed an Optical Markup Recognition (OMR) system to be used to detect shaded options of students after MCQ-type examinations. The designed system employed the pixel-based unsupervised classification approach with image pre-processing strategies and compared its efficiencies, in terms of speed and accuracy, with object-based supervised or unsupervised classification OMR systems. Speed and accuracy were tested using asymptotic running time and confusion matrix, respectively. The study began by involving the ideas of 50 sampled students in the design of an OMR template to be used by the proposed system. The study used six accuracy parameters to compute the effects of the three image pre-processing strategies, two-dimensional median filtering, contrast limited adaptive histogram equalisation, scanlines and standard Hough transform techniques. These strategies proved to increase the accuracy rates of the proposed system. The study finally proposed strategies to detect shaded circle bubble with its centre and block neighbouring pixels within it. These labels were stored in row-by-column one-dimensional array matrices. The study then concluded that the proposed pixel-based untrained classification OMR algorithm, is statistically fast and accurate than the object-based untrained classification OMR algorithms.
Received: 16 June 2017, Accepted: 28 July 2017, Published Online: 20 August 2017
1. Introduction
Optical Mark Reading (OMR) is a novel technology in pattern recognition that can be used for several purposes, but most especially, for collecting information from Multiple Choice Questions (MCQs) paper sheets. This paper investigated into faster, timely, and inexpensive image processing strategies that could be used to extract information from scanned optical markup sheet. Currently, OMR Machines, which does this kind of processing, are high speed accurate scanners, having built-in data processing software. Some popular brands include AXIOME, SEKONIC, DARA, DATAWIN, EKEMP and Scantron. However, in Africa, more specifically in Ghana, Scantron brand-type OMR Machines are common. Their physical sizes are huge. For example, a high-volume Scantron’s iNSIGHT OMR scanner takes up a space area of about 83.9×50×90.7’ inches. Their prices are also very high. Again, it necessitates the use of special sheets. For instance, a large volume Scantron iNSIGHT® scanner which can process up to 15,000 custom-designed sheets per hour can be bought at a minimum price of USD 19,500. A typical custom-design OMR paper sheet is also about USD 12. These two disadvantageous features in terms of cost and size, motivates software and algorithm developers, to mimic the exact functions of these OMR Machines through software developments. Software developers thus, tend to develop low-cost, simple and accurate alternate solutions to these OMR Machines. It is with these background issues, that this paper proposed a simple and cost-effective but accurate, Graphical User Interfaced (GUI) OMR system, which used an ordinary scanner and a computer to detect information on scanned OMR sheets. Technically, the paper investigated into the viability of using pixel-based unsupervised or untrained classification approach to detect and classify patterned bubbles on OMR sheets. The performance of the algorithm, in terms of speed, accuracy and cost-effectiveness, was then tested and compared to other object-based supervised or unsupervised OMR algorithms published in literatures.
2. Literature Review
Three major generic development modules for recognition systems have been proposed in literatures. These were the template designing, the preprocessing and the classification modules [1, 2]. According to Addmen I.T. Solutions those recognition systems, more specifically, OMR systems, are at their utmost function when they are developed to evaluate on just a single style of sheet template layout. In this sense, the Addmen I.T. Solutions advocated that, users of the OMR sheet template should be consulted and their perceptions need to be sought before the template design process (www.addmengroup). On their website, they again highlighted certain standard ‘ISO-certified’ guidelines that need to be followed when designing OMR sheet template. Preprocessing modules were proposed to prepare images by reducing data variations to a minimum so that the images are more suitable for further processing phases [3, 4]. Image preprocessing is typically the essential first step in recognition system development [5]. According to reviewed literatures, skew detection or estimation [6, 7, 8, 9], skew correction or orientation [10, 11], layout analysis [12, 13], impulse noise filtering or removal [13, 14], contrast enhancement [15], pixel perfection or sharpening [16], basic thresholding for units extraction [5], segments generation [13, 17] and Region of Interests (ROIs) [5], were most prominently used preprocessing techniques in recognition system development. The classification design module in OMR development was used to extract features from the scanned OMR sheet images using decision rules [18]. On this basis, the two procedures in decision rule classification approaches where termed as pixel-based and object-based [18]. With the pixel-based, conventional classifier generate classes for particular signatures per single pixel forming the image [18]. With the object-based, classes were generated to represent united pixels that formed objects, like shapes, on the image. They could be either supervised or unsupervised [18]. The supervised classification approach involved using methods of known informational classifiers called training sets, while the unsupervised classification methods involved studying a large number of characterized unknown pixels and distributing them into classes [18].
There were two reviewed parameters for measuring the performance efficiencies of the OMR system, which were ‘Asymptotic Running Time Measurement’ using graphs as adopted by the study of Stewart [19], and ‘Accuracy Measurement Parameters’ as given by [20, 21 and 22]. In line with the study of Stewart, using graphs to measure the asymptotic time complexity of systems, typically involved the use of the algorithm’s function in the time complexity ‘T(n)’, calculated with the physical running time, T, and the total contiguous values of inputs ‘n’ received by the algorithm and tabulated during its several running times [19]. This paper also used the five accuracy parameters [20], which were the Predictive Accuracy Rate (PACC), Recall/True Positive/Sensitivity Rate (RR), Specificity/True Negative Rate (SR), Precision/Positive Predictive Value (PPV), Negative Predictive Value (NPV). The Matthews’ Correlation Coefficient (MCC) was also used [21]. They were calculated as follows:
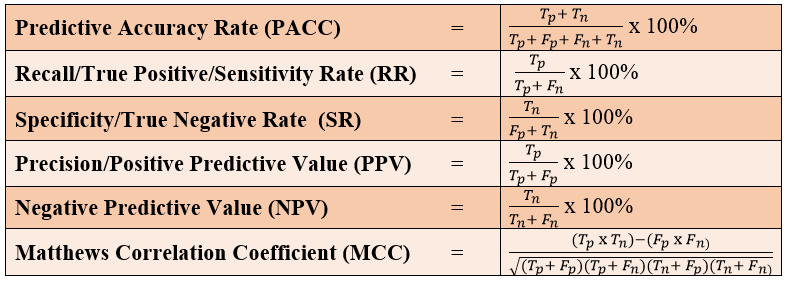 Figure 1: Accuracy Metric Parameters for Machine Binary Classification by [21] and [22]
whereby
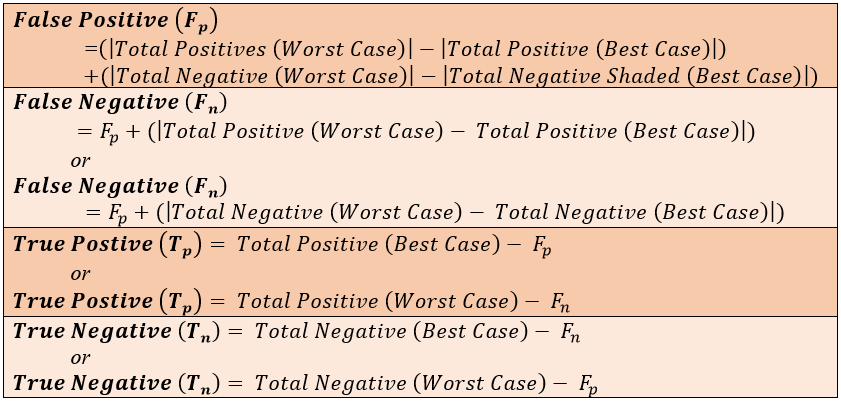 Figure 2: Classifiers to Measure Accuracy for Machine Binary Classification. [23]
Conferring to these equations, [23] incorporated them into their contingency confusion table. Their confusion matrix or contingency table was modified based on the definition given by Haralick [24]. The modified confusion matrix comprised of an array of probabilities whose rows and columns are both similarly categorized or designated by test and condition phases and which indicates the probability of a circle bubble being correctly identified as a member of any of the category phases as well as the probability of errors [24]. The modified confusion table of accuracy prediction is as follows:
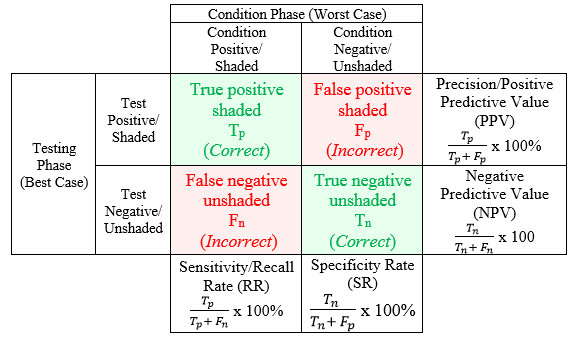 Figure 3: Modified Confusion Matrix Table for Accuracy Prediction of [24]
2.1. Review of Existing Algorithms to Detect Content on OMR Sheets
Studies on object-based supervised or unsupervised classification techniques in image processing were reviewed. Nine works have been done so far. However, only three [25, 26, 27], were reviewed, because, they had an extraordinary running times and predictive accuracy rates when compared to the other six. They were also easily implemented by using MATLAB®. Also, these three algorithms were current as they were designed not more than two years ago, when this research was being conducted (between 2015 to 2017). The other six algorithms [4, 28, 29, 30, 31 and 32], were proposed in earlier years (between 1999 to 2013), and they were outdated and hence unrealistic when implemented in MATLAB®
The first algorithm reviewed, the authors proposed an Optical Markup Reading strategy using Modified Multi-Connect Architecture (MMCA) technique [25]. This algorithm did not dwell on a training engine classifier. The algorithm also detected shapes instantly on the OMR sheets. Therefore, this algorithm applied the object-based unsupervised classification approach in image processing. Their strategy followed the generic conceptual procedures of any typical OMR software, whereby the software reads from a scanned or captured images, filled and unfilled small bubbles and output detected contents. However, they stored these contents in an MMCA. The MMCA functioned as an associative memory or weight matrix which was a multi-dimensional array table, that collectively stores generated shaded option labels on output (students’) test paper that corresponds to a given shaded option labels on an input (examiner’s) base paper [25].
The second algorithmic module reviewed, also implemented using the object-based unsupervised classification approach, identified shaded shape objects straight from scanned images without a training engine classifier [26]. Hui, Feng and Liang later characterized this algorithm as a low-cost OMR (LCOMR) technique, as the algorithm was expected to traditionally support a few number of examination sheets [33]. In their proposed methodology, scanned OMR sheets were converted from Red-Green-Blue (RGB) color type to Grayscale set, using combinations of the MATLAB® functions ‘gray2ind’ ‘mat2gray’ and ‘ind2rgb’ to strip hue and saturation from the image. Tanvi and Niket criticized this technique by perpetuating that the technique consumes a lot of computers’ processing time and simply proposed the use of the MATLAB® function ‘rgb2gray’ to produce similar results [34]. The algorithm then goes on to use thresholding, skew detection for angle straightening and region of interest (ROI) techniques in getting the marked portion on the sheets. The correct answer labels are stored in an array and crossed-compared with actual answers in a database also from a master scanned answer sheets [34].
The third reviewed novel OMR algorithm used Graphical User Interfaces (GUIs) [27]. This algorithm, just like the algorithm of AL-Marakeby [32], was a supervised classification algorithm because; it involved the training of default classifiers as a single dataset. The proposed algorithm was object-based in the sense that, it detected shape object at an instance. These authors developed a GUI-based OMR in Java which aided examiner to plan and design their own OMR sheet [27]. During the OMR template design, each default attributes (size, space, position, color) of objects on the template were trained to be used in subsequent processing. This proposed system, operated under three major processes. The first process was to ‘identify and find corner points of bounding box’. These corner points were used to straighten scanned images rotated more than a threshold of 110. The second module was to check orientation of the image’s region of interest. This process calculated the direction of tilting or rotating the slanted angle of scanned images after scanning. The last module of the algorithm had to do with the ‘reading of the marked fields’. In this process, the default attributes of objects on the template designed, were compared with the current attributes of the objects on the scanned templates. A rough value estimation of each attribute in the scanned images was made and a bubble could therefore be read by the algorithm as filled or unfilled when similarity was high.
2.2. Conceptual Framework of the Entire Study
The outline of the concepts backing this project is detailed in Figure 4. Different minutiae of the conceptual framework shown in Figure 4, presented an outline of concepts, assumptions and expectations of the research understudied.
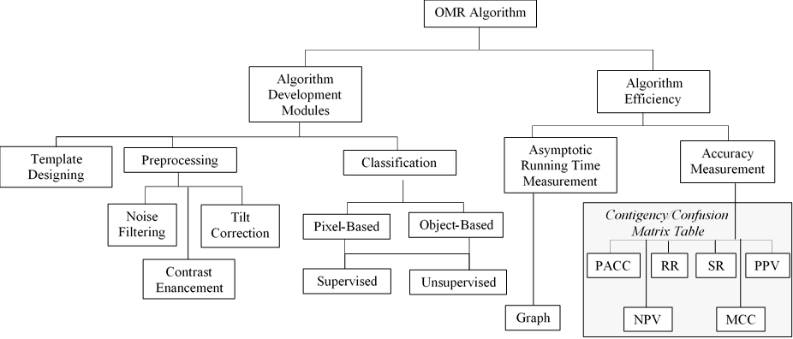 Figure 4: Conceptual Framework of the Study
3. Research Methodology
The project followed experimental research design combined with qualitative research approach. This combination aimed at forecasting the outcome of a OMR system development process through severally conducted conditional testing. An experiment was conducted on some reviewed algorithms to expose their detailed features. Following these exposed detailed features of the reviewed algorithm, they were then individually and completely developed into a software application using MATLAB®. These and other exposed features were also incorporated in developing the proposed algorithm. After that, the proposed algorithm was implemented using object-oriented code structure. Several testing and experiments were then conducted on it, to fine tune its performances until the intended outcome was achieved. The efficiency of in terms of predictive accuracy and running times of the reviewed algorithms as well as the proposed were then tested at execution. To do this, MCQ-type examinations were conducted, where students were grouped into classes, and each of the classes had a specified number of students. The number of OMR sheets filled corresponds to the number of students within a particular class. The filled OMR sheets were then scanned into folders on the primary hard disk, after which system analysis and diagnostic testing were conducted to achieve the intended outcome of the proposed method. Also, the said research design was accompanied with a qualitative research approach. The contact with qualitative data for this analysis was based on questionnaire and observation of software artifacts. Questionnaire item was used to collect data on students’ perception about the layout design of the OMR sheet template to be used by the proposed system. The study was purely an interpretive study which compared the performance of several algorithms with that of the proposed algorithms, through software testing. The procedure was in such a way that, after testing all these reviewed and proposed algorithms, descriptive presentations of their inputs sizes, physical running times and accuracy rates were made. Then with appropriate statistical approaches, comparative interpretations were also conducted on each of the presentations to come out with the algorithm which had the faster and more accurate results.
3.1. Study Population, Sample and Sampling Techniques
In designing the OMR template for the proposed system, all students of the Kwame Nkrumah University of Science and Technology (KNUST) were expected to participate in this research. However, the demographic data of the population used, was limited to only the students who were in the third or fourth year of their tertiary education. These students were assumed to be very familiar and very often exposed to the current OMR sheet being used in the university, and therefore could provide impute credible data appropriate to change the layout of the OMR template to be used by the proposed OMR system. There was the need to adopt a non-probabilistic convenience sampling technique. This haphazard convenience sampling technique adopted, selected third and fourth year undergraduate students under the Computer Science Department. Using Cochran’s equation [35], the sample size which was calculated at 0.85 confidence level, z-score value of 1.44, a standard deviation of 0.5, and a margin of error value being set to 0.1
Thus, in all, and through a convenient sampling technique, 50 Students were selected to respond to the questionnaire items.
4. Algorithm Implementation
The implementation of the proposed OMR algorithm was conducted in five major waves which are the template designing, document image scanning or capturing and digitization, image preprocessing stage, pixel-based unsupervised algorithm design, and lastly, presentation of the results.
4.1. Template Designing
In designing a suitable OMR sheet template for the proposed system, simple survey test questions were used. The responds from these questions posed to the students guided the subsequent design OMR sheet for the proposed system. When conducting this survey, five two-color grayscales (black and white) templates (template 1 through to template 5) were designed. The design of all these five templates followed the guidelines reviewed from the website of Addmen I.T. Solutions. Sessions of dummy MCQ-type examinations were then conducted whereby the sampled students filled the OMR template sheets. Questionnaire item was then distributed to solicit students’ views as to which of the templates they preferred most
Table 1: Most Preferred OMR Template as an Alternative to the Current OMR sheet (n=50)
| Variables | f | (%) |
| Template 1 | 1 | 2 |
| Template 2 | 1 | 1 |
| Template 3 | 44 | 88 |
| Template 4 | 1 | 2 |
| Template 5 | 3 | 6 |
From the Table 1, majority of the students (44 representing 88%), selected ‘template 3’ as their preferred choice. Suggestions from these students, about additional features yielded the following thematic views that were mutual among the students. They liked ‘template 3’ better mainly because; the instructions on that template were more adequate and clearer; the circle or oval shape of the options were more familiar; the sizes of circle shape bubbles were large and noticeable enough; the spaces between the circle bubbles were adequately evened and; the layout of contents on the template was pleasing and well-aligned
4.2. Scanning and Digitization OMR Sheet Template
The second step in our markup recognition, ensured digitization. Thus, the shaded OMR sheets were then scanned and digitized, with an EPSON® PERFECTION 2480 PHOTO scanner docked with an Automatic Document Feeder (ADF) hardware device. The output resolution of the scanner was set to as high as 300dpi. So scanned images were of high resolution quality. The scanned filled OMR sheets are then stored in a folder on a secondary storage device and the next step is to import the folder into the designed OMR software for processing
4.3. Preprocessing
After scanning and digitizing OMR sheets, they are imported into the system. Then, preprocessing phase was started. This phase of the algorithm used three techniques to enhance the image and to prepare the image to be digitally suitable for the next phase of processing. These three image preprocessing techniques used were the pixel sharpening or perfection, noise removal or filtering and image alignment or straightening. Specifically, Contrast Limited Adaptive Histogram Equalisation (CLAHE) [36, 37] technique was used to clearly sharpen the pixels of the image. Again, Two-Dimensional Median Filtering (2D MF) [38, 39] technique was used to smoothen the pixels of the image and remove or filter speckle noise particles on scanned images. Furthermore, during image alignment or straightening was used to estimate the skew angle of the scanned document and adjust it accordingly. These techniques were necessary to address situations when examiners placed any OMR document at an improper angle relative to a given angle. Two techniques were thus, performed during the document straightening process. These techniques were the skew angle detection and skew correction relative to a suitable angle.
During the CLAHE, and the 2D MF, MATLAB® functions, adapthisteq() [36] and medfilt2() [38], were applied respectively. During skew angle detection, the algorithm began by drawing two bounding boxes around the baselines (two deep-thickened straight lines) drawn at the top and bottom portions on the OMR sheet. The bounding boxes were rectangular boxes bounding together regions of connected black pixels from the topmost or bottommost sides of the scanned images. The objective of drawing these bounding boxes was to form area around the distinct straight lines on the scanned documents that are slanted, skewed or tilted. The bounding boxes therefore formed the initial concentration area of pixels, at which skewed angles are estimated and corrected to effect the new positions of all other pixels on the digitized image. In drawing the bounding boxes, the algorithm scans through the image from the top and bottom, until it encounters two first black pixels. These first black pixels, from the top and the bottom of the document are the tip edge pixels of the two top and baselines respectively. After that, all pixels forming the tip edges of the baselines were then detected. With this, bounding rectangular boxes could then be drawn around the baselines. The algorithm adopted in drawing these bounding boxes was similar to that of [40, 41].
Next, the algorithm drew scanlines which vertically divide the area within the bounding boxes into a number of over-lapping regions called slabs. The width of each slab was 100 pixels. But if the width of the bounding box, which was divided into slabs, was not a multiple of 100 pixels, the width of that slab, which will be mostly the last slab, will then smaller than 100 pixels. The reason for choosing 100 pixels as the slab’s width size was to divide the bounding box into at least 10 to 11 slabs. Through experiments with different slab widths setting the slab’s width at any value between 80 to 120 pixels produced relatively similar results, but setting the slab’s width below or above this range increases the overall processing time complexity of the algorithm. Thus, inside each bounding rectangular box, about 10 or 11 vertical scan lines were casted. This idea was inspired by the work of [8]. The algorithm then remembered all the hit juncture points and regression lines were drawn through these juncture points. These juncture points are the pixels at which the scanlines touched or joined the tip edge baselines. Finally, the angle slopes of the baselines were detected. These strategies are graphically illustrated in Figure 5.
The Standard Hough Transform (SHT) strategies [42] were then used to detect the actual baselines in the scanned image After the angle as well as the actual straight lines forming the baselines on the image, has also been detected, the algorithm then speculated the angle at which the pixels forming the straight line (baseline) can be mapped to correct its skewness. This part of the algorithm was inspired by the approaches of [43] as cited in [41]. All other pixels on the image were skewed correctly to lie horizontally on the scanned page. In this, correct values for pixels at a location in the skewed corrected image were calculated by weighting the true original position of the pixels with the calculated skew angle of the baseline. Some pixels are given white values, if the newly calculated location lies outside the original image. The experiments discussed here differ from those of previous investigations in that, with all these techniques combined, the algorithm could correct skewed angle up to 400.
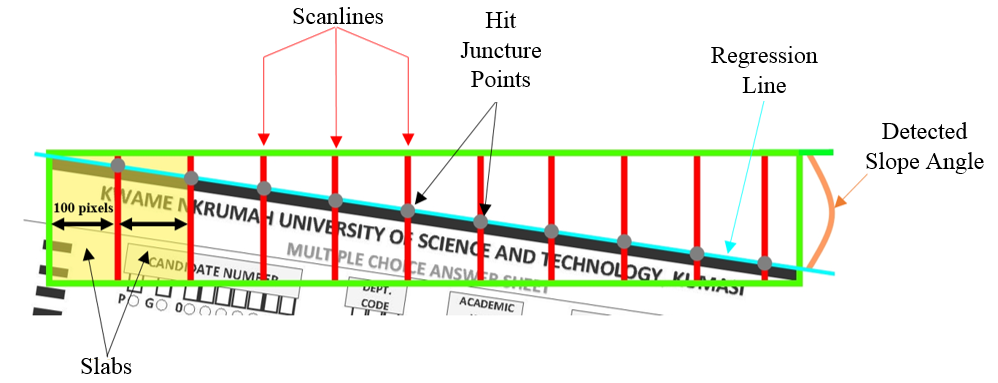 Figure 5: Skew angle detection using scanlines
4.4. The Design of the Unsupervised Pixel-Based OMR Algorithm
The circle bubble options on the custom designed OMR sheets were structurally organized, taken into consideration that, there were only two forms of grouped data to be collected. As a results, the first form of grouped data collected ‘Student Details’ while the second form of grouped data collected the actual ‘Answers to the Multiple Choice Questions (MCQs)’. This resulted in two directional (column-wise/vertical and row-wise/horizontal) styles of shading being programmatically interpreted into software instructions and being accordingly considered using divide-and-conquer algorithm design paradigm [44]. As one sole aim of this study was to develop an untrained pixel-based classification algorithm in OMR, and to do this, locations of pixels needed to be identified on the OMR sheet. The center positions of the left most corner first circle bubble (first circle) as well as the positions of the two sequentially perpendicular (first-down) and parallel (first-right) circle bubbles, under a corresponding grouped data on the OMR Sheet, were read using MATLAB® function ‘ginput ( )’ or by clicking on the desired position with the ‘Data Cursor’ command in the MATLAB® toolbox figure.
The x-coordinate and y-coordinate VDU Cartesian values of these center pixels within the first three consecutive bubbles were stored and strategically subtracted from each other, using the ‘Euclidian Metric’ distance norm. All center pixels and its few surrounding neighbor pixels were now estimated with computed distance value. A thresholder pixel value of 150 was set and if the located center pixel value is less than the thresholder, then the circle bubble is classified as ‘shaded’ or ‘dark’ while, on the other hand the circle bubble is classified as ‘unshaded’ or ‘bright’ if the located center pixel value is greater than the thresholder. All shaded’ or ‘dark’ pixels are then mapped to binary number ‘0’while unshaded’ or ‘bright’ pixels are mapped to binary digit ‘1’. The mapped binary numbers (0s and 1s) created a results array which is then used to compare either a vertical or horizontal 1-D array matrix. Vertical 1-D array matrices were used to store labels characters of the circle bubble options to be shaded as ‘Student Details’, while a horizontal 1-D array matrix was used to store labels characters of the circle bubble options to be shaded as ‘Answers to Multiple Choice Questions (MCQs)’.
The next step in the algorithm carefully considered the two directional (column-wise/vertical and row-wise/horizontal) styles of shading. As with the case of the grouped data that collected personal ‘Student Details’, and whereby shading followed vertical or column-wise direction, extraction of results array was also made column-wisely and therefore, the comparison between column-extracted results array and vertical 1-D label array matrices, was made in a column-wise logic. For the other grouped data that collected the actual shaded ‘Answers to the Multiple Choice Questions (MCQs)’ and which followed the horizontal-right directional form of shading, a row-wise extraction was made from the created results array and therefore a row-wise comparison was made between the results array and the horizontal 1-D array matrix. In comparing, extracted results array were used to compare with the 1-D array matrix, after which any index position within the extracted results array that held the ‘0’ binary number was associated with the same index position that held a consequent label character in the 1-D array matrix. The algorithm then stored the actual label character at that particular index position in a spreadsheet file.
| Steps | |
| 1. | START OMR ALGORITHM |
| 2. | Store in 1-D arrays, the label characters under corresponding sections on the OMR Sheet |
| 3. | Label all circle bubbles under corresponding sections on the OMR Sheet |
| 4. | Detect approximated center/middle pixel positions for first, second (first-down) and third (first-right) bubbles |
| [x, y] ← ginput (1); | |
| [next_x_Right, y] ← ginput (1); | |
| [x, next_y_Down] ← ginput (1); | |
| 5. | Estimate the Euclidian distances between all the selected center/middle pixel of all the circle bubbles. |
| ed_Space_x ← (next_x_right – x) + (y-y); | |
| ed_Space_y ← (next_y_bottm – y) + (x-x); | |
| 6. | Apply nested loop structure for the Column-wise/Vertical directional style of shading |
|
for i←1: length of the subgroup data to be collected sy ← y + (i – 1) * ed_Space_y for j←1: length size of the 1-D array corresponding to the subgroup sx ← x + (j – 1) * ed_Space_x; end for loop end for loop |
|
| 7. |
Declare pixel thresholder variable pixel_Thresholder ← 150; //Set pixel thresholder to classify circle bubbles |
| 8. | Repeat ‘Step 6’ for the Row-wise/Vertical directional style of shading |
| 9. | //Classify pixels of Column-wise/Vertical group based on a set pixel thresholder |
|
for i←1: length of the subgroup data to be collected for j←1: length size of the 1-D array corresponding to the subgroup if ((i(next_Pixel_y, next_Pixel_x) <= pixel_Thresholder)) c (i, j) ← 0; //Pixel Classified as Shaded else c (i, j) ← 1; //Pixel Classified as Unshaded end if end for loop end for loop |
|
| 10. | Repeat ‘Step 9’ to classify pixels of Row-wise/Vertical group as Shaded based on a set pixel thresholder |
| 11. | Display/Return actual bubble labels that corresponds to the shaded pixels |
|
for h=1:length (c) //Length of array storing classified binary pixels values shaded ← c == 0; //Counting of ‘0’s (shaded area) in matrix ‘c’ unshaded ← c == 0; //Counting ‘1’s (unshaded area) in matrix ‘c’ if (c (i, j) == 0) //Condition to check pixel as shaded in matrix ‘c’ student_Details ← [student_Details_Array (find (c == 0))]; end if student_Details(h) ← Full_Student_Details; end for return Full_Student_Details |
|
| 12. | Display/Return actual bubble labels that corresponds to the shaded pixels |
|
for i←1: length size of the 1-D array corresponding to the number of MCQs m ← 0; //Set initial counter for unshaded pixels for j=1: length size of the array for options of each single MCQ if (c (i, j) == 0) option_Shaded_MCQs ← [option_Shaded_MCQs option_Label_MCQs] else m=m+1; //Increase counter for unshaded pixels by one end if end for loop if (m == 5) // Condition to check if all five bubbles are unshaded pixels option_Shaded_MCQs ← [option_Shaded_MCQs ‘x’]; end if end for loop |
|
| 13. | END OMR ALGORITHM |
5. System Implementation
A Graphical User Interface (GUI) software application was then implemented with this algorithmic flow, to use the OMR template layout preferred by the students, thus template 3. The development stages of the GUI-based OMR software application however, followed the Unified Modelling Language procedures.
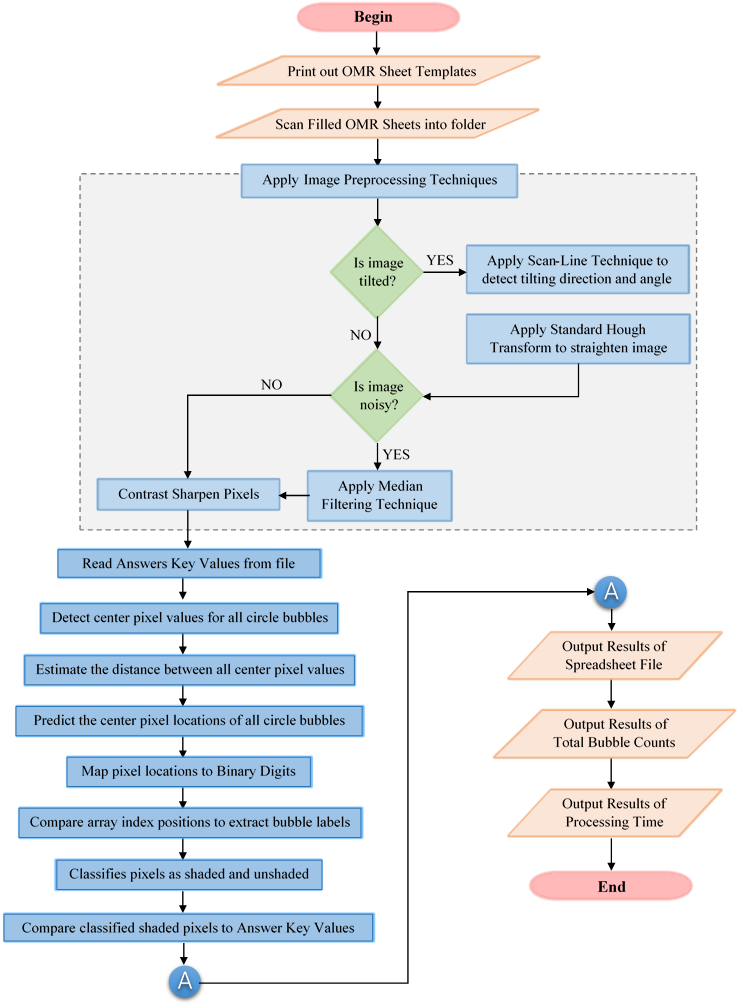 Figure 6: Flowchart of the proposed OMR System
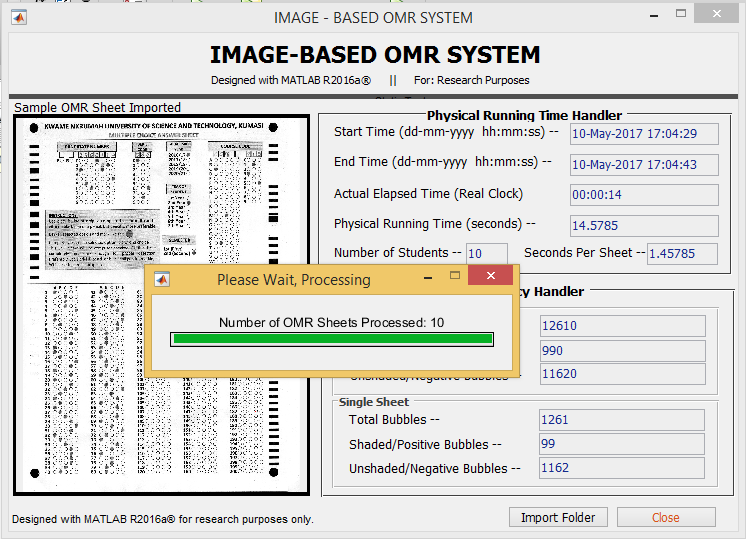 Figure 7: GUI Interface of the Image-Based OMR System (After Processing)
The Flowchart model is drawn in Figure 6. Based on the sketched flowchart unified model, a graphical user specification was developed to present shaded scores in Microsoft Excel® 2016 spreadsheet application. The Graphical User Interface (GUI) of the proposed application is shown in Figure 7.
After the proposed GUI system was developed, the dummy MCQ-type examinations were conducted to test the efficiency of the proposed OMR system, in terms of speed and efficiency. The study used two computable parameters to measure the efficiency, which were Asymptotic Running Time Measurement and Accuracy Measurement. The efficiencies of the proposed pixel-based unsupervised classification algorithm and the reviewed object-based supervised or unsupervised classification algorithms [25, 26 and 27], were then compared. Figure 7 illustrates the first physical running time comparisons between the proposed algorithm and that of [25], and then a summary of the comparisons between the proposed algorithm and the other two reviewed algorithms are presented in Table 2.
From the Figure above, the asymptotic time functions of the proposed pixel-based unsupervised (Figure 7(a)) and [25] object-based unsupervised (Figure 7(b)) classification algorithms were T(n)=38.779n0.5914 and T(n)=60.355n0.6457, respectively. Both the running time functions have positive intercept values (38.779 and 60.355) interprets that, as the number of sheets increased, the number of time taken, in seconds, to evaluate these increased in sheets, also increased. However, the positive intercept value of 38.779 construed that the proposed pixel-based unsupervised algorithm could have used 38.779 seconds to evaluate 40 OMR sheets whilst the reviewed object-based unsupervised algorithm of [25] could have been estimated to use and 60.355 seconds. Also, based on this equation, the trendlines’ positive slope (gradient) values were 0.5914 for the proposed algorithm, 0.6457 for the reviewed algorithm, meaning that in any average case scenario, the proposed pixel-based unsupervised classification algorithm could have used approximately 0.5914 seconds to evaluate a single OMR sheet whilst the reviewed object-based unsupervised could have used 0.6457 seconds for the same purpose. A summary was then made on the comparative analysis of the asymptotic running time complexity functions between the proposed pixel-based unsupervised classification and the reviewed object-based unsupervised classification approaches to OMR algorithm design.
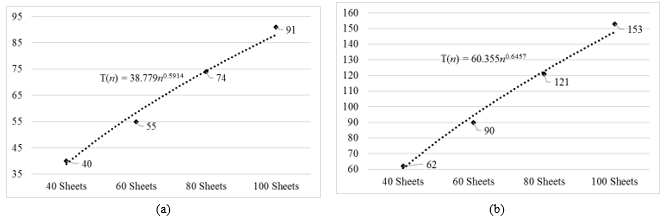 Figure 8: Comparing Physical Running Times Complexity Functions between (a) the proposed algorithm and (b) [26]
Table 2: Summary of Comparisons in Asymptotic Running Time Function
| Categories | Algorithm Classification Approaches | |||
| Pixel-Based Unsupervised | Object-Based Unsupervised | Object-Based Supervised | ||
| Proposed from this Study | [26] | [27] | [28] | |
|
Asymptotic Running Time Function T(n)= c.nk |
38.779n0.5914 | 60.355n0.6457 | ||
| 28.973n0.7616 | 29.996n0.8217 | |||
| 28.649n0.9661 | 57.996n1.0004 | |||
|
Estimated Initial Running Time (in seconds) (c – ‘intercept’) |
28.649 | 60.355 | ||
| 38.779 | 29.996 | |||
| 28.973 | 57.996 | |||
| 28.649 – 38.779 | 29.996 – 60.355 | |||
|
Estimated Running Time Per Sheet (in seconds) (k – ‘slope’) |
0.5914 | 0.6457 | ||
| 0.7616 | 0.8217 | |||
| 0.9661 | 1.0004 | |||
| 0.5914 – 0.9661 | 0.6457 – 1.0004 | |||
Table 2 summarized the comparisons between time complexity functions of the proposed pixel-based unsupervised classification approach and the reviewed object-based supervised or unsupervised approaches. From the table, the proposed pixel-based unsupervised classification approach to OMR algorithm design yielded an initial physical running time estimates between 28.649 and 38.779 seconds whilst all the three reviewed object-based supervised or unsupervised classification approaches yielded an initial physical running time estimates between 29.996 and 60.355 seconds. Similarly, the proposed OMR algorithm was estimated to use between 0.5914 and 0.9661 to evaluate a single OMR sheet whilst the three reviewed OMR algorithm was estimated to use between 0.6457 and 1.0004 to evaluate a single OMR sheet. An indication that, the proposed algorithm used little physical time to evaluate a single or a bulky number of OMR sheets when compared to the three reviewed OMR algorithms.
Two trial test phases were used to measure the accuracy efficiency of the proposed algorithm. These phases were termed as the ‘Condition Phase’ and the ‘Testing Phase’. In the ‘Testing Phase’ recordings were made on the usual physical running times of the algorithm’s execution under standard and stable situations whilst in the ‘Condition Phase’ recordings were made on the situational physical running times of the algorithm’s execution under unfavorable, hostile, unfriendly and worst case conditions, such that, the scanned OMR sheets were haphazardly folded or mishandled, tilted slightly more than the specified maximum threshold angle of 400 and filled with the speckled particles forming vast distortion noise levels. These amounts of information derived at the testing and condition phases were then compared and presented in a classification table or the confusion matrix table. The confusion matrix was drawn using recordings on the number of circle bubbles that are capable of being detected by the proposed algorithm when tested under both phases. This confusion matrix, as modified by [24] with the six parameters of [20] and [21], is shown in Figure 8.
In line with Figure 3, in Figure 8, the columns signified recordings derived from conditional phase while rows indicated results derived from testing phase. From Figure 8, Precision Predictive Value (PPV) was as high as 94.87%, Negative Predictive Value (NPV) was also high as 99.75%, Recall Rate (RR) was 92.50% and Specificity Rate (SR) was 99.83%. Computed results for Predictive Accuracy (PACC) rate and Matthews Correlation Coefficient (MCC) were 99.60% and 0.93, respectively. Error Rate (ER) which is calculated using the formula ‘(1-PACC)×100’, was therefore 0.40%. The high accuracy rates for all the parameters pointed to the fact that lots of actually shaded option bubbles were accurately detected by the algorithm. Thus, the algorithm provided high reliable results when detecting correctly shaded and unshaded options on OMR sheets. Next, the accuracy level of the proposed algorithm was tested with each of the ten classes. This is presented in the second column of Table 3.
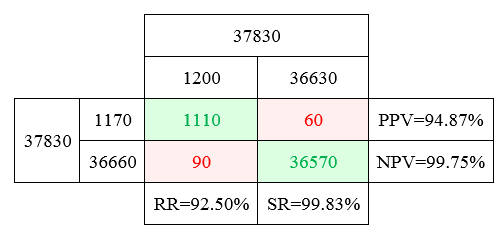 Figure 9: Confusion Matrix Table with Numerical Recordings from the Proposed OMR System
Table 3: Accuracy Rates Comparisons between Literatures and the Proposed OMR Algorithm
| Accuracy Rates | Pixel-Based Unsupervised | Object-Based Un/Supervised | ||
| Proposed Algorithm | [26] | [27] | [28] | |
| PACC (%) | 99.28 | 93.72 | 94.43 | 97.60 |
| RR (%) | 85.66 | 85.09 | 84.36 | 84.95 |
| PPV (%) | 92.82 | 77.08 | 76.59 | 90.24 |
| SR (%) | 99.77 | – | 95.87 | – |
| NPV (%) | 99.49 | 95.94 | – | – |
| MCC | 0.891 | – | – | 0.762 |
Performance accuracy raters recorded high and commendable values even when the algorithm was tested under worst case situations. It is noted from Table 3 that, in testing the accuracy of the proposed algorithm on ten different classes of diverse OMR sheets as input size, all the six accuracy rate parameters decreased in insignificant ratio, as the number of OMR sheets increased from 30 to 150 OMR sheets. For example, PACC, RR and PPV decreased from 99.60% to 98.82%, from 92.50% to 76.23% and from 94.87% to 89.91%, respectively. As shown in Table 3 the yielded average values of PACC, RR, SR, PPV, NPV and MCC were hence, 99.28%, 85.66%, 99.77%, 92.82%, 99.49% and 0.89 respectively. These accuracy rates were also compared to the accuracy rates of the reviewed object-based unsupervised or supervised classification algorithms [25, 26, and 27].
As illustrated in the Table 3, there were concrete significant gaps, in favour of the proposed OMR algorithm, between pixel-based unsupervised and the object-based unsupervised or supervised classification approaches. For example, the trainable object-based supervised algorithm proposed by [27] produced the average highest predictive accuracy rate value (PAAC=97.60%) and the Precision Predictive Value (PPV=90.24%), when compared to the other algorithms of the two authors [25] and [26]. However, these PACC and PPV values were lesser than that of the proposed pixel-based unsupervised OMR algorithm (PACC=99.28%, PPV=92.82%). The same was applicable for the computed RR, SR, NPV and the MCC accuracy parameters.
6. Key Findings of the Study
Based on the results of this study, the following are the main findings.
- The results showed that using circles (elliptical or ovals) shape as bubbles instead of the Blocks (double open squared brackets) economized space area on OMR sheet at the same time made its contents very visible to be shaded and read by the OMR system. Also, using only two grayscale (black and white) colors reduced the cost involved in printing and photocopying these sheets and required personnel with very little knowledge in computing and office duties, when implemented in real life.
- In achieving a speedy OMR system, pixel-based unsupervised classification approach was exploited in such a way that, center pixels and its few neighboring pixels rather represented circle shape options. Thus, within the algorithm, about 2 to 8 pixels centered within a circle bubble were detected and processed on, as a representative for the whole circle bubble. Current literatures used all pixels, sometimes about 250 pixels, together to form a single circle shape bubble.
- The algorithm also used throughout its processing, the row-by-column one-dimensional (1-D) array matrices either in vertical (transpose) or horizontal representations. In several literatures, array matrices were suggested to be the fasters and easiest data structures that could be implemented within any algorithm. Again, the compared literatures used associative weight memory matrices, multi-dimensional array tables and trained classifiers as their data structures. This research thus, proved these data structures to be slower
- The algorithm was designed in such a way to separately consider the two major structural groupings of circle bubbles on OMR sheet. With this effect, the algorithm utilized the divide-and-conquer algorithm designs paradigm, as segments of the algorithm were broken down to process only specific parts of the OMR sheets.
- The results showed that in achieving a more accurate level of detection on the inputted scanned OMR sheets, preprocessing techniques has to be duly considered before the algorithm goes further to classify circle bubbles using its intended pixel-based unsupervised classification method. Although, several literatures suggested numerous image preprocessing techniques, it was found out that, the three (2D median filtering technique, Contrast Limited Adaptive/Adjusted Histogram Equalization (CLAHE), and the Scan-line and Standard Hough Transform (SHT)) that were used, resulted in a high accuracy rate even when the algorithm was tested under hostile conditions.
- The results showed the output efficiencies of the proposed pixel-based unsupervised classification OMR algorithm, in terms of speed and accuracy, was better, as the number of OMR sheet inputs got large or increased. In terms of speed, the asymptotic running time complexity of the proposed pixel-based unsupervised classification algorithm was small at initial input size of OMR sheet, and increased as the number of OMR sheet increased. However, an exceptionally lesser speed was used to evaluate single OMR sheet when compared to object-based supervised or unsupervised classification algorithm. In terms of accuracy, the amount of useful and relevant information detected by the proposed pixel-based unsupervised classification algorithm were estimated be very much adequate and the amount of valueless and irrelevant information detected were predicted to be insignificant, even under very unfavorable conditions. The observed higher percentage of accuracy raters attested to this finding
7. Conclusions
The primary intention of the test results of this study was to categorize the proposed pixel-based unsupervised classification OMR algorithm as either desirable or undesirable in terms of speed and accuracy. Per the outcome of the results, the proposed OMR algorithm is concluded to be more fast and accurate when compared to the object-based unsupervised or supervised classification OMR algorithm. From a more technical perspective, the study examined the effect of three algorithm development modules, template designing, image preprocessing and content classification, on the cost, speed and accuracy of an OMR algorithm. As these algorithm development modules favoured the algorithm, the algorithm concluded to be ‘good’ or ‘efficient’. It can be concluded that, an OMR algorithm that used the pixel-based unsupervised classification approaches and preprocessed scanned OMR sheets with noise filtering, contrast enhancement and tilt correction techniques ended up being faster and more accurate.
8. Recommendations/Future Research
8.1. Implications of this Study to Research
This study offered some important implications to research in the areas of OMR, OCR, classification approaches and image processing techniques.
- This proposed OMR system was tested in one real life application, MCQ-type examinations, but in future, researchers can extend the implementation of similar modules in this research to other real-life scenarios like the automatic attendance marking system, lotteries, consumer and community surveys, voting and product evaluation, university admission form evaluation, to mention a few.
8.2. Implications of this Study to Algorithm Developers
This study provided some implications to OMR and even OCR algorithm developers:
- Algorithm developers can investigate into how other data structures, apart from arrays, but like linked lists, stacks, queues, trees and even graphs, could be used in storing detected label characters and results and at the same time increasing its computational efficient in terms of speed and accuracy.
- Algorithm developers can research into other pixel-based supervised approaches that use training datasets as the basis of its classification.
- As the proposed OMR algorithm strictly limited itself to a single OMR sheet layout, algorithm developers could build upon this algorithm to be more scalable for classification, even using severally different or user-specified OMR sheet layouts.
- Algorithm developers can study into how pixel-based classification approaches can work best for low resolution data, as this study could not test the effects of resolution scalar features of scanned images on accuracy or speed of the algorithm
- Algorithm developers can also look into areas whereby OMR sheets could be snapshotted with a digital camera or even a smartphone camera. In this logic, and in future, further developments could be made on this proposed approach to be implemented on a mobile phone instead of on a computer.
- Wagenheim, M., “Grading Biology MCQ Exams at a Large State University”. Retrieved from http://www.remarksoftware.com. on 24th December, 2016.
- Palmer, R. C. The Basics of Automatic Identification. Canadian Data systems, 21 (9), 30-33, 2009
- Brown, M. K., and Ganapathy, S. Preprocessing techniques for cursive script word recognition. Pattern Recognition, 16(5), 447-458, 1983
- Spadaccini, A., and Rizzo, V., A Multiple-Choice Test Recognition System based on the Gamera Framework. arXiv preprint arXiv:1105.3834, 2011
- Han, C. C., Cheng, H. L., Lin, C. L., and Fan, K. C., Personal authentication using palm-print features. Pattern recognition, 36(2), pp. 371-381, 2003
- Chinnasarn K. and Rangsanseri Y., “The Skew Estimation of Printed Documents”, Ladkrabang Information Journal 3, pp. 14-21, 1998.
- Gatos, B., Papamarkos, N., and Chamzas, C., Skew detection and text line position determination in digitized documents. Pattern Recognition, 30(9), 1505-1519, 1997
- Chou, C. H., Chu, S. Y., and Chang, F., Estimation of skew angles for scanned documents based on piecewise covering by parallelograms. Pattern Recognition, 40(2), 443-455, 2007
- Yu B., and Jain A. K., A robust and fast skew detection algorithm for generic documents, Pattern Recognition 29 (10) pp. 1599–1729, 1996
- Yan H., Skew correction of document images using interline cross-correlation, CVGIP: Graphical Models and Image Process. 55 (6) 538–543, 1993
- Le D. S, Thoma G. R., Wechsler H., Automated page orientation and skew angle detection for binary document images, Pattern Recognition 27 (10) 1325–1344, 1994
- O’Gorman L., The document spectrum for page layout analysis, IEEE Trans. Pattern Analysis Machine Intelligence. 15 (11), pp. 1162–1173, 1993
- Kasturi, R., O’gorman, L., and Govindaraju, V., Document image analysis: A primer. Sadhana, 27(1), 3-22., 2002
- Fan, K. C., Wang, Y. K., and Lay, T. R., Marginal noise removal of document images. Pattern Recognition, 35(11), 2593-2611, 2002
- Celik, T., Two-dimensional histogram equalization and contrast enhancement. Pattern Recognition, 45(10), 3810-3824, 2012
- Pal, S. K. and Pal, A., Pattern recognition: from classical to modern approaches, World Scientific, ISBN No. 981-02-4684-6, Singapore, 2001
- Pornsiriprasert N. Design and development of page segmentation program for character recognition. Master’s Thesis, Chulalongkorn University, 2002
- Pooja K, Sonam S., and Sonu A., A Survey on Image Classification Approaches and Techniques, International Journal of Advanced Research in Computer and Communication Engineering (2)1, 1005-1009, 2013
- Stewart J., Data Structures and Algorithm Analysis – Estimating Asymptotic Complexity by Experiment using Graphs, Oxford, England: Clarendon Press, 1998
- Bradley, A. P., The use of the area under the ROC curve in the evaluation of machine learning algorithms. Pattern recognition, 30(7), 1145-1159, 1997
- Désir, C., Bernard, S., Petitjean, C., and Heutte, L., One class random forests. Pattern Recognition, 46(12), 3490-3506, 2013
- Powers, D. M. W., “Evaluation: From Precision, Recall and F-Measure to ROC, Informedness, Markedness and Correlation”. Journal of Machine Learning Technologies. Volume: 2, Issue: 1, pages: 37–63., 2011
- Fawcett, T., An introduction to ROC analysis. Pattern recognition letters, 27(8), 861-874, 2006
- Haralick, R. M., Glossary and index to remotely sensed image pattern recognition concepts. Pattern Recognition, 5(4), 391-403, 1973
- Rusul H. and Emad I. A. K., An Image Processing Oriented Optical Mark Reader Based on Modify Multi-Connect Architecture MMCA, International Journal of Modern Trends in Engineering and Research-IJMTER-PP 414-423, 2015
- Sumitra B. G., Image Processing Based OMR Sheet Scanning. International Journal of Advanced Research in Electronics and Communication Engineering (IJARECE), Volume 4, Issue 3, PP. 519-522, 2015.
- Garima K., Hemant R. R., Rana, Ishu M., Kashif O. and Narendra S., “Implementation of OMR Technology with the Help of Ordinary Scanner”, International Journal of Advanced Research in Computer Science and Software Engineering (IJARCSSE), Volume 3, Issue 4, pp 714-719, 2016
- Chinnasarn, K. and Rangsanseri, Y., An image-processing oriented optical mark reader. Applications of digital image processing XXII, Denver CO., 1999.
- TienDzung D. N., Quyet, H. M. and Phuong B. M., Efficient and reliable camera based multiple-choice test grading system. International Conference on Advanced Technologies for Communications, 2011.
- Rakesh S, Kailash A., and Ashish A., “Cost Effective Optical Mark Reader” International Journal of Computer Science and Artificial Intelligence, Vol. 3 Issue 2, PP. 44-49, 2013
- Nutchanat, S., “Test Scoring for Non-Optical Grid Answer Sheet Based on Projection Profile Method”. International Journal of Information and Education Technology, Vol. 3, No. 2, 2013
- AL-Marakeby A., Multi-Core Processors for Camera based OMR, International Journal of Computer Applications (0975 – 8887) Volume 68– No.13, 2013.
- Hui D., Feng W., Liang B., “A Low-Cost OMR Solution for Educational”, An International Journal of Advances in Computational Research, 2016.
- Tanvi S. and Niket B., “Optical Mark Recognition with Simple Scanner”, An International Journal of Advances in Computational Research, 2016.
- Cochran, W. G., Sampling techniques (3rd ed.). New York: John Wiley and Sons, 1977
- Zuiderveld, K., “Contrast Limited Adaptive Histograph Equalization.” Graphic Gems IV. San Diego: Academic Press Professional, pp 474–485, 1994
- Kim, S. J., Min, B. S., Lim, D. K., and Lee, J. H., Determining parameters in contrast limited adaptive histogram equalization. In The 7th International Conference on Information Security and Assurance, Vol. 21, pp. 204-207, 2013.
- Lim, J. S., “Two-Dimensional Signal and Image Processing.”, Englewood Cliffs, NJ, Prentice Hall, pp. 469-476, 1990.
- Liu, Y., Noise reduction by vector median filtering. Geophysics, 78(3), V79-V87, 2013.
- Amin A., Mari J. F., Machine recognition and correction of printed Arabic text, IEEE Trans. Man Cybernet 9 (1) 1300-1306, 1989
- Amin, A., Recognition of printed Arabic text based on global features and decision tree learning techniques. Pattern Recognition, 33, 1309-1323, 2000.
- Duda R., Hart P., Use of the Hough transformation to detect lines and curves in pictures, Communication. Association for Computing Machinery (ACM) 15 11-15, 1992
- Paeth A., A fast algorithm for general raster rotation, Proceedings Graphics Interface Vision Interface, Canadian Information Processing Society, pp. 77-81, 1986
- Chen, C., Jacobsen, H. A., and Vitenberg, R., Algorithms based on divide and conquer for topic-based publish/subscribe overlay design. IEEE/ACM Transactions on Networking, 24(1), 422-436, 2016.