Precision Statistical Analysis of Images Based on Brightness Distribution
Precision Statistical Analysis of Images Based on Brightness Distribution
Volume 2, Issue 4, Page No 99-104, 2017
Author’s Name: Muzhir Shaban Al-Ani1, Khattab M. Ali Alheeti2, 3, a)
View Affiliations
1Department of Computer Science – College of Science and Technology, – University of Human Development – KRG – Iraq
2School of Computer Sciences and Electronic Engineering University of Essex, Colchester, United Kingdom
3University of Anbar, College of Computer Science and Information Technology, Anbar – Iraq
a)Author to whom correspondence should be addressed. E-mail: khattabheeti@yahoo.com
Adv. Sci. Technol. Eng. Syst. J. 2(4), 99-104 (2017); ![]() DOI: 10.25046/aj020413
DOI: 10.25046/aj020413
Keywords: Image analysis, Pattern analysis, Statistical measures, Brightness distribution, Intensity Measures

Export Citations
Study the content of images is considered an important topic in which reasonable and accurate analysis of images are generated. Recently image analysis becomes a vital field because of huge number of images transferred via transmission media in our daily life. These crowded media with images lead to highlight in research area of image analysis. In this paper, the implemented system is passed into many steps to perform the statistical measures of standard deviation and mean values of both color and grey images. Whereas the last step of the proposed method concerns to compare the obtained results in different cases of the test phase. In this paper, the statistical parameters are implemented to characterize the content of an image and its texture. Standard deviation, mean and correlation values are used to study the intensity distribution of the tested images. Reasonable results are obtained for both standard deviation and mean value via the implementation of the system. The major issue addressed in the work is concentrated on brightness distribution via statistical measures applying different types of lighting.
Received: 11 April 2017, Accepted: 24 June 2017, Published Online: 17 July 2017
1. Introduction
Color image processing can be described analogous to grayscale image processing, such as the study of algorithms and techniques for processing color information in a global three-dimensional scene and its conversion into two-dimensional image represent color in a trichromatic color model and digital color spaces [1], [2].
As with any other crime, the alteration of the image is inherent in the falsified image. Digital images are characteristics of the camera, the scene and the temporal characteristics of the pixel values. These characteristics will be different for the images taken in different configurations. These inconsistencies can be analyzed to detect the altered regions [3], [4].
Images processing play vital role in our daily life. In other words, it is the most important part in the analysis of images. The image analysis process is the extraction of meaningful information from images. In addition, image analysis can be divided into two main approaches which are: spatial domain and frequency domain approaches [5]. Statistical approach is situated within spatial domain approaches, in which can be measured many functions depending on the aim of the system [6].
The researchers are considered pattern recognition is one important part of this study in which existed many approaches that can be divided into two main categories [7]. These categories are: 1) Decision category that deals with pattern described utilised quantitative descriptors defined by length, area and texture. 2) Structural category that deals with pattern described qualitative descriptors defined by relational descriptor [8].
Brightness and intensity lead to major effect on image resolution and content. In some cases, it is not possible to compensate the incident light, so this causes big problems on the image quality. To avoid these problems, we must introduce additional step in the implemented system to show the effects raised according to incident light [9], [10].
Different statistical parameters for different aims can be applied on image processing. Image brightness and the light intensity has an important part of image quality. This approach concentrated on the statistical aspects to understand and analyze the brightness distribution of the object surface.
2. Statistical Measures
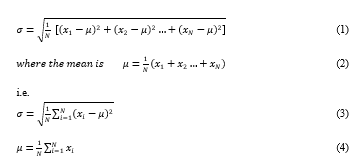
In this paper, statistical measures are employed to the different types on incident light. These statistical measures which are: standard deviation and mean values. These measures play an vital role in image processing filed including image analysis. In this research field, the standard deviation deals with the amount of variations in average. A low value indicates that data points tend to be very close to the mean, while a high standard deviation indicates that the data points are distributed over a wide range of values. In statistics and probability theory, standard deviation (σ) measures the amount of variation or dispersion from the average. A low standard deviation indicates that the data points tend to be very close to the mean. A high standard deviation indicates that the data points are spread out over a large range of values. The global mean value (µ) of an image is the average intensity of all the pixels in the image [11], [12], [13].
The standard deviation of a finite data set is given by:
3. Literature Review
The image analysis field is rich of literatures as well as the field of statistical measures is rich of studies. Combining of image analysis with statistical measures may empower the contribution approach. Below some of recently published papers are selected that were concentrated on both image processing and analysis with statistical measures:
- Al-Shayea et al., designed 3D object visualization via two dimensional images in which existed many object. This work is implemented to find the contour of the given object in each slice and then merging these contours to reconstruct the 3D objects. This approach is easy to use as well as it can be implemented on various type of images. The reconstruction process indicated a good resolution in this approach [14].
- Greve, et al., introduced a new approach for classification of image regions. This approach is based on wavelet standard deviation descriptor. The obtained results performed for about one thousand images with region segmentation in which provided reasonable results for general application domain [15].
- Fazal Malik et al., proposed a Content Based Image Retrieval (CBIR) algorithm which is based on the color histogram using Laplacian filter in order to reduce the noise and provides an enhanced image with more detail information. Color histogram of the filtered image is divided into bins. Mean and standard deviation are calculated for pixels in each bin to get feature vector which is used for image retrieval [16].
- Firas Jassim, implemented a novel method that combines between median filter and simple standard deviation to get an excellent edge detector used for image processing. The visual differences between the implemented edge detector and the standard edge detectors have been shown to support the contribution in this work [17].
- Ibrahem Raho, et al., constructed an efficient information algorithm that detects the direction of objects. This algorithm is implemented based on statistical measurements, entropy, histogram, moment and gradient. The obtained results indicate a good accuracy in object recognition. Many techniques are integrated to generate this approach which is efficient and effective approach [18].
- Rashid et al., provided a detailed study for selecting of image processing and computer evaluate performance then compared the results and gave a better evaluation trend. For the implemented study of restoration, and elimination of noise, adding noise, then they estimated of statistical results, a certain amount of different types of noise have been added to the image, and a filtering process is carried out for the examination of the effect [19].
- Hallil Binti Ismail et al., suggested an approach to calculate the contrast with the fixed block size independently of the spatial resolution of the input image. This approach try to resize the block size based on the spatial resolution of the input image to maintain the relationship between the block size and the image size similar to that of the sample images used in the development of the statistical model. The proposed method has been tested and demonstrated statistically to be effective in reducing inconsistency in the classification of images according to different spatial resolutions [20].
- Büyüksaraç et al., proposed system consists of three main steps. First, we apply segmentation of the facial and hand zone using Fuzzy C-means clustering (FCM) and Threshold. FCM is a grouping technique that uses the fuzzy partition, in an iterative algorithm. After the segmentation of the face and hands, the vectors of characteristics are extracts. Then are drawn vectors of features, which are used for recognition with discrete hidden Markov model (HMM). A precision of 94.19% was obtained [21].
- Intajag et al., proposed algorithm uses a generalized distribution of extreme values consisting of three parameters to adjust the balance of brightness and color by adjusting the location, contrast and tone granted, respectively, by the scale and shape parameters. The performance of the algorithm was evaluated using two sets of imaging data: retinal structure analysis and automated retinal image analysis. The results show that the improved histograms based on the generalized extreme value were given important characteristics to characterize the symptoms of macular degeneration [22].
- Zhang et al., studied and demonstrated the effect of high fluorescence on the brightness of the cell images. The optical properties are very important to for enhancement and detection of biomedical applications, and disease diagnosis. The obtained results indicated that the synthesized carbon nanodots are suitable to be used for sensitive detection [23].
- Gao et al. designed a specific approach for real time imaging. This approach synthesized successfully and applied in living image cells. Living cells is a real time application which is one of the big challenge here. The proposed approach leading to many advantages in addition to high brightness of images. This approach provides new efficient strategies compared with other algorithms [24].
- Oliva et al., introduced an image processing approach based on high influence of image analysis. Different techniques and thresholding and entropy are presented to perform image segmentation. Optimal strategy of thresholding is implemented by applying crow search algorithm. The obtained results, demonstrated that this approach obtains better results related to the quality and consistency [25].
The previous works concentrated in their approaches on the statistical measures as a main part of their works. In the proposed work, the statistical measures are implemented as a parameters to enhance the different types on incident light.
4. Methodology
4.1. Image Data Set Construction
The construction of image data set is required to be applied in the implemented approach. Several cases have been tried in order to access the appropriate images. Two set of images are performed via the arrangement of 20 coins; first set is built by square shape and the second set is built by circle shape. Via high resolution camera three types of light intensities are designed: normal light, sunny light and fluorescent light.
- Normal light indicated images with perfect light.
- Sunny light indicated images with sunny light.
- Fluorescent light indicated images with fluorescent light.
b. The Proposed Scheme
There are many approaches deal with the image analysis such as histogram analysis, feature extraction, image understanding, and statistical approach. This approach is concentrated on two parameters of statistical measures that are mean value and standard deviation value of image which reflect the intensities distribution in an image. The proposed approach is divided into five main steps as shown in Figure 1:
- The first step (Input color images): In this step, images are collected via high resolution camera to capture Red Green Blue (RGB) color images. The acquisition of color image with real color is an important part of the system to ensure the correct image resolution.
- The second step (Convert color image into gray image): In which color images are converted into grey scale images of eight bits. RGB images are converted into grey image with normal levels to reserve the image performance.
- The third step (Pre-processing): In this step, images are resizing and filtering to reduce noise and redundancies as possible. This is an important stage to prepare an image that is ready for the processing stage.
- The fourth step (Statistical measures): In this step, the mean, standard deviation values and correlation are calculated of grey and color images. These measurement deals with the variation of intensity of the image surface.
- The fifth step (Compare the results): In which compare the calculated results of mean and standard deviation values. This stage is realize the difference in values between various types of images.
| Normal Color Image Acquisition |
| Sunny Color Image Acquisition |
| Converting into Gray Scale |
|
Converting into Gray Scale
|
| Preprocessing |
| Preprocessing |
| Statistical Measures |
|
Statistical Measures
|
| Compare the Results |
| Final Decision |
 Figure 1 System Approach
5. Results and Analysis
Images are collected in three types of light intensities; normal light, sunny light and fluorescent light. Each image consists of 20 coins of money distributed in different ways as shown in Figures 2 and 3, which indicate both color and gray images of set_1 respectively. The objects in these images are arranged regularly into two forms; rectangular and circular. On one hand, Table 1 indicates that there is a similarity in standard deviation measures between images 1_1 and 1_2, images 1_3 and 1_4, images 1_5 and 1_6 because these set of images are related to the same type of lighting. On the other hand, similarities of mean values are nearly the same in all set of images. The values of mean, standard deviation and correlation are illustrated in Figure 4. The rectangular distribution of color images and gray scale image of set_1 are illustrated in figures 2 and 4. Table 2 indicates that the value of correlation approach to one when the correlation occurs with the same image and becomes approach to zero when the correlation occurs with the different image. Figures 5 and 6 indicate both color and gray images of set_2 in which objects are distributed randomly in circular form. In this case, there are no differences in the measures of standard deviation and mean values, but the difference is noted in the correlation values which are slightly larger that values obtained in images of set_1 as shown in Table 3 and 4 and demonstrated in Figure 7. This slightly difference of measured parameters values it could be because of the difference image intensities according to the controlling source of light.
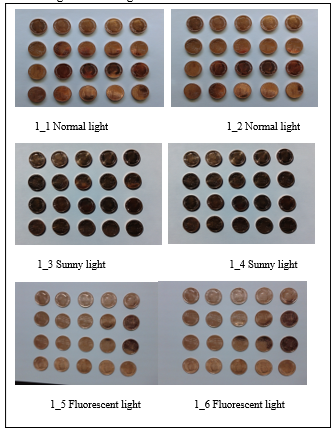 Figure 2 Original color images set_1
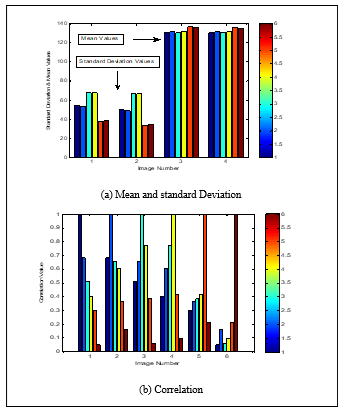 Figure 3 Gray scale images set_1
| Std. and mean | Im1_1 | Im1_2 | Im1_3 | Im1_4 | Im1_5 | Im1_6 |
| Std. Color | 54.4339 | 53.4629 | 67.8846 | 67.6199 | 36.8979 | 38.3637 |
| Std. Gray | 49.8961 | 48.9069 | 66.4916 | 66.4916 | 33.2746 | 34.7204 |
|
Mean Color |
130.8953 | 131.6831 | 130.8684 | 132.0300 | 136.8746 | 135.9786 |
|
Mean gray |
130.3743 | 131.5154 | 130.6480 | 131.7335 | 136.3183 | 135.3786 |
Table 1 standard deviation and mean values of set_1
Table 2 Correlation values of set_1
| Corr. value | Im1_1 | Im1_2 | Im1_3 | Im1_4 | Im1_5 | Im1_6 |
| Im1_1 | 1.0000 | 0.6830 | 0.5139 | 0.4059 | 0.3009 | 0.0521 |
| Im1_2 | 0.6830 | 1.0000 | 0.6540 | 0.6074 | 0.3669 | 0.1663 |
| Im1_3 | 0.5139 | 0.6540 | 1.0000 | 0.7699 | 0.3843 | 0.0586 |
| Im1_4 | 0.4059 | 0.6074 | 0.7699 | 1.0000 | 0.4123 | 0.0991 |
| Im1_5 | 0.3009 | 0.3669 | 0.3843 | 0.4123 | 1.0000 | 0.2141 |
| Im1_6 | 0.0521 | 0.1663 | 0.0586 | 0.0991 | 0.2141 | 1.0000 |
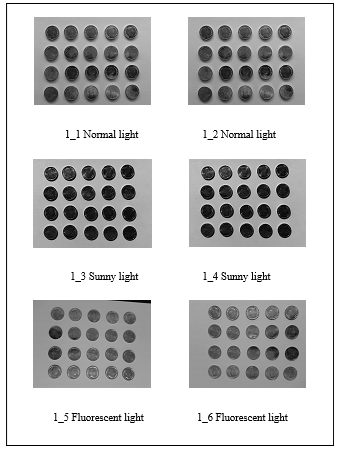 Figure 4 statistical measures of set_1
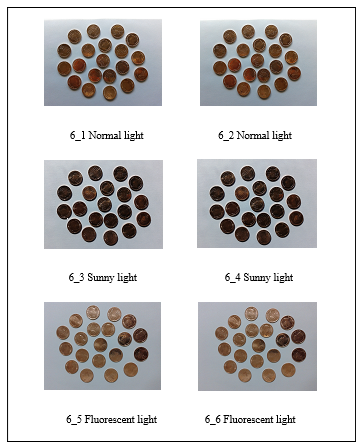 Figure 5 Original color images set_2
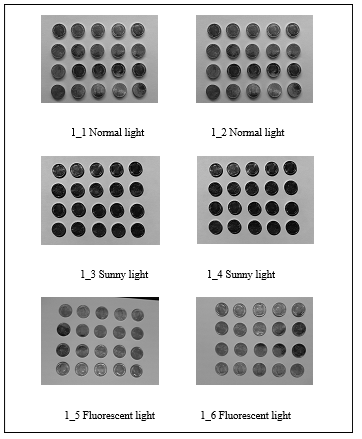 Figure 6 Gray scale images set_2
Table 3 Standard deviation and mean values of set_2
| Std. and mean | Im6_1 | Im6_2 | Im6_3 | Im6_4 | Im6_5 | Im6_6 |
| Std. Color | 62.1758 | 61.9500 | 73.3265 | 72.7418 | 43.9440 | 43.3678 |
| Std. gray | 58.4828 | 58.5388 | 72.0344 | 71.4614 | 40.0808 | 39.6336 |
|
Mean Color |
40.8195 | 44.2563 | 135.6616 | 135.8909 | 142.6736 | 144.1556 |
|
Mean gray |
140.7910 | 144.6220 | 135.2252 | 135.4476 | 142.7297 | 144.2394 |
Table 4 Correlation values of set_2
| Corr. value | Im6_1 | Im6_2 | Im6_3 | Im6_4 | Im6_5 | Im6_6 |
| Im6_1 | 1.0000 | 0.8486 | 0.7412 | 0.7403 | 0.4854 | 0.4294 |
| Im6_2 | 0.8486 | 1.0000 | 0.6233 | 0.6521 | 0.4785 | 0.3873 |
| Im6_3 | 0.7412 | 0.6233 | 1.0000 | 0.8015 | 0.4485 | 0.4020 |
| Im6_4 | 0.7403 | 0.6521 | 0.8015 | 1.0000 | 0.4244 | 0.3624 |
| Im6_5 | 0.4854 | 0.4785 | 0.4485 | 0.4244 | 1.0000 | 0.6088 |
| Im6_6 | 0.4294 | 0.3873 | 0.4020 | 0.3624 | 0.6088 | 1.0000 |
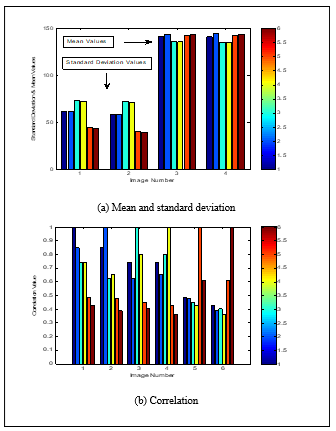 Figure 7 Statistical measures of set_2
6. Conclusions
Statistical analysis of images based on brightness distribution is implemented in this work. This simulation results show that each measure is of great importance as requirements. The selection of statistical measures is very important and should be done with caution. Using results, it is very easy to select statistics configuration before going to an image processing complex art. Statistical analysis of images is an important topic in the image analysis field. The implemented system heavily based on statistical approach by measuring standard deviation, mean, and correlation values. Various configurations of objects are arranged in each image to detect their brightness.
The main application of this approach is to achieve the image characteristics with different types of light. In this research, emphasis has been placed on the application of statistical measurements in image analysis using images with different light parameters, regardless of the difference in the locations of shapes in the images.
Standard deviation and mean values are measured for different types of images. Various positions are designed and implemented to study and address the effect of brightness distribution via statistical measures. The obtained results indicated an adequate image surface characteristics via the application of this approach. The main finding that the use of statistical measurements have a significant impact to detect and analyze image brightness parameters, even if the difference value is small.
- M. Ravindranath Chakravarthy Bhagvati B.L. Deekshatulu, “Spectral Color Image Processing”, Proceedings of the 2011 International Conference on Image Information Processing (ICIIP 2011).
- M. Ravindranath, Challa S. Sastry, “Compressed Sensing for Reconstruction of Reflectance Spectra from Tristimulus Values”, International Conference on Information Technology for Real World Problems (VCON), India, pp. 79 – 82, 2010.
- T. J. de Carvalho, C. Riess, E. Angelopoulou, H. Pedrini and A. R. Rocha, “Exposing Digital Image Forgeries by Illumination Color Classification,” IEEE Trans. Inf. Forensics and Security, vol. 8, no. 7, pp. 11821194, July 2013.
- K. Francis, S. Gholap, P.K. Bora, “Illuminant colour based image forensics using mismatch in human skin highlights,” in Proc. Twentieth National Conference on Communications (NCC), pp.1-6, 2014.
- P. Atam Dhawan, “Medical Image Analysis”, 2nd Edition, Wiley-IEEE Press, February 2011.
- R. Nock and F. Nielsen, “Statistical Region Merging”, IEEE Transactions Pattern Analysis Machine Intelligence, vol. 26, no. 11, pp. 1452-1458, 2004.
- R. C. Gonzalez and R. E. Wood, “Digital Image Processing”, Third Edition, Prentice Hall, Person Education International, New Jersey, 2009.
- R. C. Gonzalez & R. E. Woods, “Digital Image Processing Using MATLAB”, Addison-Wesley, 2nd Edition 2009.
- B. W. Hong, S. Soatto, K. Ni, T. F. Chan. The scale of a texture and its application to segmentation. In IEEE International Conference on Computer Vision and Pattern Recognition, 2008.
- G. Sundaramoorthi, P. Petersen, V. S. Varadarajan, S. Soatto, “On the set of images modulo viewpoint and contrast changes”, In Proceedings of the IEEE Conference on Computer Vision and Pattern Recognition, June 2009.
- S. Boltz, E. Debreuve, and M. Barlaud, “High-dimensional statistical distance for region-of-interest tracking: Application to combining a soft geometric constraint with radiometry”, In IEEE International Conference on Computer Vision and Pattern Recognition, Minneapolis, USA, 2007.
- G. James, D. Witten, T. Hastie, R. Tibshirani, “An Introduction to Statistical Learning: with Applications in R”, Springer, New York, Heidelberg, London, First Edition 2013.
- T. Hastie, R. Tibshirani, J. Friedman, “The Elements of Statistical Learning: Data Mining, Inference, and Prediction”, Springer, New York, Heidelberg, London, Second Edition, 2009.
- Q. Al-Shayea, M. Shaban Al-Ani (2009), “Efficient 3D Object Visualization via 2D Images”, International Journal of Computer Science and Network Security (IJCSNS), vol. 9, no. 11 pp. 234-239, November 2009.
- S. Greve, M. Grzegorzek, C. Saathoff, D. Paulus, “Classification of Image Regions Using the Wavelet Standard Deviation Descriptor”, Proceedings of the International Multiconference on Computer Science and Information Technology, vol.5, pp.703–708, 2010.
- E. Fazal Malik and B. Bin Baharudin, “Mean and Standard Deviation Features of Color Histogram Using Laplacian Filter for Content-Based Image Retrieval”, Journal of Theoretical and Applied Information Technology, Vol. 34, No.1, December 2011.
- A. Firas Jassim, “Semi-Optimal Edge Detector based on Simple Standard Deviation with Adjusted Thresholding”, International Journal of Computer Applications, vol. 68, no.2, pp 43-48, April 2013.
- G. Ibrahem Raho, M. Shaban Al-Ani, Q. Al-Shayea (2014), “Object Tracking Information System Based on Statistical Measurements”, International Journal of Application or Innovation in Engineering & Management (IJAIEM), vol.3, Issue 9, September 2014.
- A. Rashid, M. Khurrum Rahim, “Extensive Experimental Analysis of Image Statistical Measures for Image Processing Appliances”, International Journal of Signal Processing, Image Processing and Pattern Recognition, vol.9, no.3, pp.49-60, 2016.
- N. Hallil Binti Ismail, S. Der Chen, Y. Al-Najjar, “Analysis and Improvement on Statistical Natural Measure”, Journal of Theoretical and Applied Information Technology, 31st January, vol.83. no.3, 2016.
- B. Büyüksaraç, M. Mete Bulut, G. Bozdağı Akar, “Sign Language Recognition by Image Analysis”, 978-1-5090-1679-2/16/ ©2016 IEEE Xplore.
- S. Intajag, S. Kansomkeat, P. Bhurayanontachai, “Histogram specification with generalized extreme value distribution to enhance retinal images”, Electronics Letters, 14th, vol. 52, no. 8 pp. 596–598, April 2016.
- X. Zhang, J. Lu, X. Zhou, C. Guo, C. Wang, “Rapid microwave synthesis of N-doped carbon nanodots with high fluorescence brightness for cell imaging and sensitive detection of iron (III)”, Optical Materials vol. 64, pp.1-8, 2017.
- T. Gao, H. He, R. Huang, M. Zheng, F. Fang Wang, Y. Jun Hu, F. Lei Jiang, Y. Liu, “BODIPY-based fluorescent probes for mitochondria-targeted cell imaging with superior brightness, low cytotoxicity and high photostability”, Dyes and Pigments, vol. 141, pp. 530-535, June 2017.
- D. Oliva, S. Hinojosa, E. Cuevas, G. Pajares, O. Avalos, J. Galvez, “Cross entropy based thresholding for magnetic resonance brain images using Crow Search Algorithm”, Expert Systems with Applications, vol. 79, pp. 164–180, 15 August 2017