Multilingual evaluation of voice disability index using pitch rate
Multilingual evaluation of voice disability index using pitch rate
Volume 2, Issue 3, Page No 765-772, 2017
Author’s Name: Shuji Shinohara1, a), Yasuhiro Omiya2, Mitsuteru Nakamura1, Naoki Hagiwara2, Masakazu Higuchi1, Shunji Mitsuyoshi1, Shinichi Tokuno1
View Affiliations
1Verbal Analysis of Pathophysiology Graduate School of Medicine, The University of Tokyo, 113-0033, Japan
2Research and Product Development, PST Inc., 231-0023, Japan
a)Author to whom correspondence should be addressed. E-mail: shinokan99@m.u-tokyo.ac.jp
Adv. Sci. Technol. Eng. Syst. J. 2(3), 765-772 (2017); ![]() DOI: 10.25046/aj020397
DOI: 10.25046/aj020397
Keywords: Pitch detection ratio, Voice disability, Read speech , Jitter, Shimmer, Harmonic to noise ratio, Multilingual evaluation

Export Citations
We propose the use of the pitch rate of free-form speech recorded by smartphones as an index of voice disability. This research compares the effectiveness of pitch rate, jitter, shimmer, and harmonic-to-noise ratio (HNR) as indices of voice disability in English, German, and Japanese. Normally, the evaluation of these indices is performed using long-vowel sounds; however, this study included the recitation of a set passage, which is more similar to free-form speech. The results showed that for English, the jitter, shimmer, and HNR were very effective indices for long-vowel sounds, but the shimmer and HNR for read speech were considerably worse. Although the effectiveness of jitter as an index was maintained for read speech, the pitch rate was better in distinguishing between healthy individuals and patients with illnesses affecting their voice. The read speech results in German, Japanese, and English were similar, and the pitch rate showed the greatest efficiency for identification. Nevertheless, compared to English, the identification efficiency for the other two languages was lower.
Received: 05 April 2017, Accepted: 24 May 2017, Published Online: 16 June 2017
1. Introduction
This paper is an extension of the work originally presented in IEEE Engineering in Medicine and Biology Society(EMBS) 2016 [1], with the main addition being the evaluation of German and Japanese samples, in addition to the previously evaluated English data.
In recent years, the widespread use of smartphones has created interest in pathological analysis that utilizes voice data [2-4]. Voice analysis by smartphones has the advantages of being non-invasive and requiring no specialized equipment; therefore, it can be performed easily and even remotely.
It is known that changes in voice characteristics due to various illnesses can be observed. For example, patients with Parkinson’s disease often also suffer from dysarthria and stuttering. Additionally, patients with illnesses affecting the vocal cords or larynx may have hoarse voices.
Research in the relationship between mental illness and voice has been conducted by analyzing the speaking rate [12-14], as well as the switching pause and percent pause [13, 15] of depression patients.To date, jitter, shimmer, and the harmonic-to-noise ratio (HNR) have been proposed as indices to describe the degree of voice disability [5–8]. Previous research on the use of these indices in the analysis of illness has shown that patients with depression pronounce vowels with higher shimmer and jitter values. Additionally, it has been shown that the frequencies of the first and second formants of depression patient speech are lower than those of healthy individuals [9]. In other research, the Lyapunov exponents and Kolmogrov entropy of the voices of depression patients were measured using chaos analysis methods [10]. Additionally, Zhou et al. have proposed new feature values derived from the Teager energy operator for the classification of voices under stress [11].
The objective of this study is to identify and evaluate characteristics that can be used to discriminate between voices of healthy individuals and those of disorder patients based on voice recordings of free-form speech.
For this purpose, we focused on pitch degradation as an index representing sonic perturbations in patients’ voices. As a measure of this feature, we devised the concept of the pitch rate to express the ease of pitch detection in voices.
2. Materials and Methods
2.1. Voice acquisition
For the voice evaluations, we used the Disordered Voice Database and Program, Model 4337, from KayPENTAX, a division of Pentax Medical Inc. This database contains recordings of the voices of approximately 700 persons (healthy individuals and patients), with two types of sounds from each individual: the long-vowel sound “ah” (lasting approximately 3 s for healthy individuals and approximately 1 s for patients) and a read speech from the “Rainbow passage” (approximately the first 12 s).
The voice recordings of read speech from 715 individuals contain samples from 53 healthy individuals and 662 patients. The voice recordings of long vowels from 711 persons include samples from 53 healthy individuals and 658 patients. The various disorders in the patients are (duplication observed): hyperfunction (288), paralysis (77), Anterior-Posterior squeezing (182), gastric reflux (54), vocal fold edema (46), and ventricular compression (109). The format used for recording had a sampling frequency of either 25 kHz or 50 kHz with 16-bit quantization.
Conventionally, long-vowel sounds are used in the evaluation of jitter, shimmer, and HNR.
Among the data of 658 patients, no jitter, shimmer, or HNR could be detected in 13 patients regarding the long-vowel sound “ah”. Therefore, we used the data of 698 persons, including 53 healthy individuals and 645 patients.
The long-vowel sound “ah” does not change fundamentally between languages. In contrast, reciting a passage involves language differences based on the actual words used and pronunciation. In our research, we used the read speech of passages in Japanese and German, in addition to English, to investigate the language dependence of the proposed indices. Details regarding German and Japanese speech are provided below.
German speech was evaluated using the “Saarbruecken Voice Database” (http://stimmdb.coli.uni-saarland.de/) from the Institute of Phonetics of Saarland University. This voice database is available for free download, and it includes samples from over 2000 people. In our research, we used the samples of healthy individuals and patients with dysphonia saying “Guten morgen, wie geht esIhnen?” (“Good morning, how are you?”) from this database. The number of voice files used was 632 from healthy individuals and 101 from patients with dysphonia. These samples had a sampling frequency of 50 kHz with 16-bit quantization.
Japanese speech was evaluated using voice samples from “Assessment of Motor Speech for Dysarthria” [16]. This CD contains voice samples from patients with dysarthria caused by various illnesses and from healthy individuals. All samples included recordings of readings from Aesop’s fable “The North Wind and the Sun”; however, the samples from dysarthria patients also contained free-form speech. For this reason, the patient files were classified into a read-speech group and a free-form speech group. For consistency, only the read-speech samples of “The North Wind and the Sun” were used in the comparisons between patients and healthy individuals. Meanwhile, the free-form speech samples were compared to the read-speech samples of the same patients and evaluated to determine the presence of any differences between them. In this collection of samples, speech samples of the same patient were categorized and saved under multiple illnesses, so the duplicate voice files were erased. As a result, the total number of voice files from healthy individuals and patients was 6 and 35, respectively. These voice files had a sampling rate of 44.1 kHz with 16-bit quantization.
2.2. Evaluation method
Using the aforementioned data, we calculated the pitch rate, jitter, shimmer, and HNR, and compared the results of healthy individuals and patients. To evaluate the performance of each index in discriminating between patients and healthy individuals, we used the area under the curve (AUC) in the receiver-operating characteristic (ROC) plot, the sensitivity, and the specificity.
2.3. Evaluation index
We used the Praat software version 5.4.10 (http://www.fon.hum.uva.nl/praat/) to analyze the jitter, shimmer, and HNR. While shimmer measures the fluctuations in voice loudness, jitter measures the fluctuations in voice pitch and is affected by the tension and hardness of the vocal cords. The HNR is a measure of stability of the harmonic structure and indicates voice disorders, in particular, the degree of hoarseness. In this study, we used ppq5 for jitter, apq5 for shimmer, and harmonicity for HNR. In addition to these evaluation indices, we have introduced the pitch rate, which was devised by us, as an index for voice disability.
2.4. Pitch rate
Conventionally, jitter, shimmer, and HNR have been used as the measure representing the disturbance of the periodicity of speech waves. However, these cannot be measured with respect to the portion of the data in which the fundamental frequency cannot be detected. Furthermore, we focused on the ease of detection of the pitch rather than its value. The pitch detection ratio (pitch rate) is defined as the percentage of frames in which the fundamental frequency can be detected.
In normal voice recordings, there are silent intervals between utterances. In these intervals, the pitch cannot be detected. This means that the pitch rate is affected by the length of such intervals.
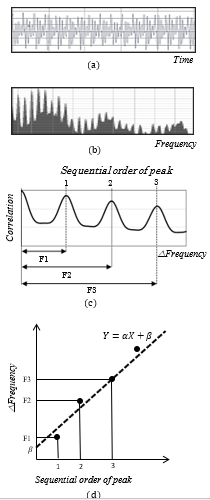
Figure 1. The pitch detection process. Details are listed in the text. (a) Voice signal, (b) frequency spectrum, (c) autocorrelation of the frequency spectrum, (d) plot of peak number and frequency shift exhibiting linear regression
Therefore, to calculate the pitch rate, the data of these intervals must be excluded from the voice data. For this purpose, we used the Sensibility Technology software, version 3.0 (AGI Inc., Tokyo, Japan) [17-19].
After the speech interval data were extracted, the data were separated into frames of length L. However, each frame was offset from the previous frame by L/4 (i.e., 3/4 of each frame overlapped with the previous frame). We set L to equal 46.44 ms, which corresponds to 512 data points at a sampling rate of 11025 Hz.
The pitch was calculated for each frame using the methods described below [20, 21]. First, the voice signal waveform (Figure 1a) was processed by a fast Fourier transform (Figure 1b). Next, the Fourier spectrum autocorrelation was calculated, and the corresponding peaks were determined. Each peak was assigned a sequential number, and the change in frequency, ∆Frequency (i.e., F1, F1, F3…) was determined (Figure 1c). Lastly, the peak number was plotted on the X axis, the change in frequency was plotted on the Y axis, and a linear regression of the form U=a C+b was determined (Figure 1d). If the linear regression had a coefficient of determination R larger than the threshold q1, and the absolute value of the y-intercept b was smaller than the threshold q2, then the pitch was considered as detected. Furthermore, if the pitch was detected, the slope of the linear regression a represented the pitch value.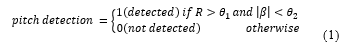
The pitch rate of every speech interval was determined by dividing the total number of frames by the number of frames in which the pitch was detected (which were subsequently analyzed). The frames that were analyzed were selected by the following methods. First, the value of the average power of the entire speech interval was determined. Next, the average power of each frame was calculated; if it was at least q3% higher than the average power in the entire speech interval, the frame was selected for analysis. In the research presented in IEEE EMBS 2016, we established a threshold for the absolute power was to select frames for analysis: if the average power of a frame exceeded this threshold, that frame was selected for analysis. However, in this study, we defined a relative value for this threshold. It must be noted that because of this change, the number of values provided in the Results section is different from that stated in IEEE EMBS 2016.
After the pitch rate was calculated for each speech interval, the average pitch rate of all speech intervals included in the voice files was determined; this average value was considered as the pitch rate for the corresponding voice files.
While jitter and shimmer are measures representing small disturbances of the periodicity within the range in which pitch can be detected, the pitch rate can be described as a measure representing a large disturbance of periodicity, such that the pitch cannot be detected.
If the intensity or the pitch varies continuously, the jitter and shimmer are affected. On the other hand, even if the intensity or the pitch fluctuates, the pitch rate is not affected, as long as the fluctuations are sufficiently small to detect the pitch. That is, the pitch rate is robust against fluctuations. Even if the amplitude, period, or the harmonic structure is greatly disturbed, the pitch rate diminishes. That is, the pitch rate can be described as a compositive index that included jitter, shimmer, and HNR. Therefore, it can be considered to be a rough indicator in comparison with conventional indicators.
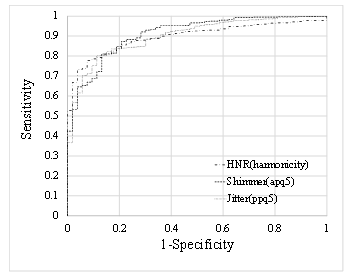
Figure 2 ROC curves used for discriminating between healthy individuals and patients using the jitter, shimmer, and HNR in the data of the long-vowel sound “ah”.
The purpose of this study is to distinguish patients based on free-form speech rather than long-vowel sounds. Because more uncertainties are included in free-form speech compared with long vowels, we consider that a rough indicator is more adequate for free-form speech.
3. Results
3.1. Ability to discriminate based on long-vowel sound
- The mean values for healthy individuals and patient in the data of the long-vowel sound “ah”
| Index |
Healthy Individuals (n=53) |
Patients (n=645) |
P-value |
| Jitter (ppq5) | 0.0016±0.00066 | 0.0061±0.0078 | 1.23∙10−39 |
| Shimmer (apq5) | 0.012±0.0062 | 0.039±0.0293 | 7.04∙10−55 |
| HNR (harmonicity) | 23.94±2.86 | 15.18±6.19 | 4.76∙10−34 |
Table 1 shows the mean values for healthy individuals and patients in the data of the long vowel sound “ah”.
With respect to jitter, the mean values for healthy individuals and patients were 0.0016 (Number of Subjects (n) = 53, Standard Deviation (SD) = 0.00066) and 0.0061(n = 645, SD= 0.0078), respectively. Based on the t-test, significant differences were observed between the two groups (t(695) = −14.05, p = 1.23∙10−39).
Regarding shimmer, the mean values for healthy individuals and patients were 0.012 (n = 53, SD = 0.0062) and 0.039 (n = 645, SD = 0.0293), respectively. Based on the t-test, significant differences were observed between the two groups (t(329) = −19.01, p = 7.04∙10−55).
With respect to the HNR, the mean values for healthy individuals and patients were 23.94 (n = 53, SD = 2.86) and 15.18 (n = 645, SD = 6.19), respectively. Based on the t-test, significant
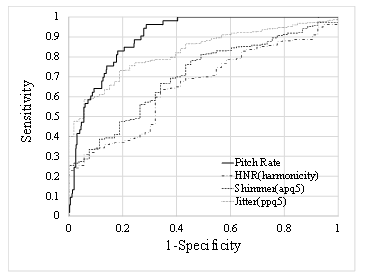
Figure 3 ROC curves used for discriminating between healthy individuals and patients using the pitch rate, jitter, shimmer, and HNR in the “Rainbow passage” read speech data.
differences were observed between the two groups (t(97) = 18.77, p = 4.76∙10−34).
Figure 2 shows the ROC curves, which demonstrate the discrimination between healthy individuals and patients using these indices. The horizontal axis represents 1-specificity (false positive rate) and the vertical axis represents sensitivity (true positive rate).
Table 2 shows the AUC for the ROC curve, sensitivity, and specificity for these indices. The best discriminability was achieved by the shimmer in terms of AUC and sensitivity and by the HNR regarding specificity. For all the indices, the AUC was approximately 0.9, showing a strong discriminability between healthy individuals and patients.
- The discriminability of the indices (for the long-vowel sound “ah”)
| Index | AUC | Sensitivity | Specificity |
| Jitter (ppq5) | 0.900 | 0.802 | 0.887 |
| Shimmer (apq5) | 0.911 | 0.811 | 0.868 |
| HNR (harmonicity) | 0.897 | 0.778 | 0.925 |
3.2. Ability to discriminate based on read speech in English
- The mean values for healthy individuals and patients in the data of read speech of “rainbow passage”
| Index |
Healthy Individuals (n=53) |
Patients (n=662) |
P-value |
| Pitch rate | 0.903±0.047 | 0.643±0.25 | 8.98∙10−39 |
| Jitter (ppq5) | 0.0084±0.0016 | 0.014±0.0076 | 2.84∙10−39 |
| Shimmer (apq5) | 0.042±0.010 | 0.057±0.026 | 4.55∙10−14 |
| HNR (harmonicity) | 13.12±2.18 | 11.41±3.48 | 1.91∙10−6 |
Regarding the total speech time, the average values of healthy individuals and patients were 10089.23 ms (n = 53, SD = 734.33), and 9270.70 ms (n = 662, SD = 1394.42), respectively. As a result of the t-test, there was a significant difference between them (t(86) = 7.15, p = 2.71∙10−10).
Table 3 shows the mean values for healthy individuals and patients in the data of read speech of “Rainbow Passage”.
With respect to pitch rate, the mean values for healthy individuals and patients were 0.903 (n = 53, SD = 0.047) and 0.643 (n = 662, SD = 0.25), respectively. Based on the t-test, significant differences were observed between the two groups (t(394) = 22.285, p = 8.98∙10−39).
With respect to jitter, the mean values for healthy individuals and patients were 0.0084 (n = 53, SD = 0.0016) and 0.014 (n = 662, SD = 0.0076), respectively. Based on the t-test, significant differences were observed between the two groups (t(321) = −15.09, p = 2.84∙10−39).
With respect to shimmer, the mean values for healthy individuals and patients were 0.042 (n = 53, SD = 0.010) and 0.057 (n = 662, SD = 0.026), respectively. Based on the t-test, significant differences were observed between the two groups (t(117) = −8.58, p = 4.55∙10−14).
Regarding the HNR, the mean values for healthy individuals and patients were 13.12 (n = 53, SD=2.18) and 11.41(n=662, SD=3.48), respectively. Based on the t-test, significant differences were observed between the two groups (t(75) = 5.166, p = 1.91∙10−6).
| Figure 4 ROC curves used for discriminating between healthy individuals and patients using the pitch rate, jitter, shimmer, and HNR in data containing read speech of “Guten Morgen, wie geht es Ihnen?”(German). |
- Discriminability of the indices (for read speech of “rainbow passage”)
| Index | AUC | Sensitivity | Specificity |
| Pitch rate | 0.902 | 0.962 | 0.713 |
| Jitter (ppq5) | 0.827 | 0.588 | 0.943 |
| Shimmer (apq5) | 0.706 | 0.761 | 0.566 |
| HNR (harmonicity) | 0.655 | 0.636 | 0.660 |
Figure 3 shows the ROC curves, which demonstrate the discrimination between healthy individuals and patients using these indices.
Table 4 shows the AUC for the ROC curve, sensitivity, and specificity for these indices. The pitch rate had the best values for the AUC and sensitivity. However, the jitter had the best value for specificity. Compared to Table 1, the AUC for the shimmer and HNR was considerably reduced.
3.3. Ability to discriminate based on read speech in German
Regarding the total speech time, the average values of healthy individuals and patients were 1561.81 ms (n = 632, SD = 331.24) and 1920.62 ms (n = 101, SD = 488.37), respectively. As a result of the t-test, there was a significant difference between them (t (115) = −7.13, p = 9.67 ∙10−11).
- The mean values for healthy individuals and patients in the data of read speech of “Guten Morgen, wie geht es Ihnen?”
| Index |
Healthy Individuals (n=632) |
Patients (n=101) |
P-value |
| Pitch rate | 0.826±0.094 | 0.701±0.180 | 6.55∙10−10 |
| Jitter (ppq5) | 0.0101±0.0028 | 0.0122±0.0056 | 0.00039 |
| Shimmer (apq5) | 0.036±0.012 | 0.045±0.019 | 4.48∙10−5 |
| HNR (harmonicity) | 14.89±2.29 | 14.47±3.27 | 0.22 |
Table 5 shows the mean values for healthy individuals and patients in the data of read speech of “Guten Morgen, wie geht es Ihnen?”.
With respect to the pitch rate, the mean values for healthy individuals and patients were 0.826 (n = 632, SD = 0.094) and 0.701 (n = 101, SD = 0.180), respectively. Based on the t-test, significant differences were observed between the two groups
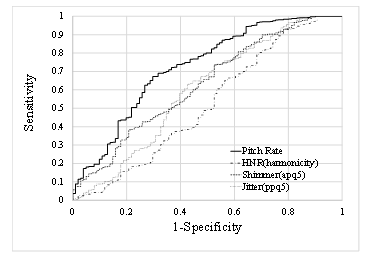
Figure 4 ROC curves used for discriminating between healthy individuals and patients using the pitch rate, jitter, shimmer, and HNR in data containing read speech of “Guten Morgen, wie geht es Ihnen?”(German).
(t(109) = 6.78, p = 6.55∙10−10).
With respect to jitter, the mean values for healthy individuals and patients were 0.0101 (n = 632, SD = 0.0028) and 0.0122 (n = 101, SD = 0.0056), respectively. Based on the t-test, significant differences were observed between the two groups (t(632) =−3.66, p = 0.00039).
Regarding shimmer, the mean values for healthy individuals and patients were 0.036 (n = 632, SD = 0.012) and 0.045 (n = 101, SD = 0.019), respectively. Based on the t-test, significant differences were observed between the two groups (t(112) = −4.25, p = 4.48∙10−5).
With respect to the HNR, the mean values for healthy individuals and patients were 14.89 (n = 632, SD = 2.29) and 14.47 (n = 101, SD = 3.27), respectively. Based on the t-test, no significant differences were observed between the two groups (t(116) = 1.230, p = 0.22).
As shown above, in all indexes other than the HNR, there were significant differences between healthy individuals and patients.
Figure 4 shows the ROC curves, which demonstrate the discrimination between healthy individuals and patients using these indices.
- Discriminability of the indices (for read speech of “‘Guten Morgen, wie geht es Ihnen?'”)
| Index | AUC | Sensitivity | Specificity |
| Pitch rate | 0.725 | 0.672 | 0.703 |
| Jitter (ppq5) | 0.598 | 0.734 | 0.475 |
| Shimmer (apq5) | 0.628 | 0.736 | 0.475 |
| HNR (harmonicity) | 0.519 | 0.927 | 0.218 |
Table 6 shows the AUC for the ROC curve, sensitivity, and specificity for these indices. For the AUC and specificity, the pitch rate was the most suitable. In terms of sensitivity, the HNR showed the best value. However, the value of the AUC tended to be lower than in the case of English.
3.4. Ability to discriminate based on read speech in Japanese
Regarding the total speech time, the average values of healthy individuals and patients were 26144.17 ms (n = 6, SD = 2995.73) and 18676.11 ms (n = 35, SD = 5145.64), respectively. As a result of the t-test, there was a significant difference between them (t(39) = 3.43, p = 0.0014).
- The mean values for healthy individuals and patients in the data of read speech of ” Kitakaze to Taiyo “
| Index |
Healthy Individuals (n=6) |
Patients (n=35) |
P-value |
| Pitch rate | 0.831±0.051 | 0.668±0.232 | 0.00078 |
| Jitter (ppq5) | 0.011±0.0026 | 0.013±0.0084 | 0.12 |
| Shimmer (apq5) | 0.040±0.014 | 0.0625±0.035 | 0.013 |
| HNR (harmonicity) | 13.64±2.46 | 11.85±3.59 | 0.25 |
Regarding pitch rate, the mean values for healthy individuals and patients were 0.831 (n = 6, SD = 0.051) and 0.668 (n = 35, SD = 0.232), respectively. Based on the t-test, significant differences were observed between the two groups (t(36) = 3.67, p = 0.00078).Table 7 shows the mean values for healthy individuals and patients in the data of read speech of “Guten Morgen, wie geht es Ihnen?”.
With respect to the jitter, the mean values for healthy individuals and patients were 0.011 (n = 6, SD = 0.0026) and 0.013 (n = 35, SD = 0.0084), respectively. Based on the t-test, no significant differences were observed between the two groups (t(26) = −1.61, p = 0.12).
Regarding shimmer, the mean values for healthy individuals and patients were 0.040 (n = 6, SD = 0.014) and 0.062 (n = 35, SD = 0.035), respectively. Based on the t-test, no significant differences were observed between the two groups (t(19) = −2.76, p = 0.013).
With respect to the HNR, the mean values for healthy individuals and patients were 13.64 (n = 6, SD = 2.46) and 11.85 (n = 35, SD = 3.59), respectively. Based on the t-test, no significant differences were observed between the two groups (t(39) = 1.17, p = 0.25).
As shown above, there was a significant difference between healthy individuals and patients only in the pitch rate.
Figure 5 shows the ROC curves, which display the discrimination between healthy individuals and patients using these indices.
- Discriminability of the indices (for read speech of “Kitakaze to Taiyo”)
| Index | AUC | Sensitivity | Specificity |
| Pitch rate | 0.752 | 0.833 | 0.686 |
| Jitter (ppq5) | 0.562 | 1 | 0.343 |
| Shimmer (apq5) | 0.733 | 1 | 0.486 |
| HNR (harmonicity) | 0.624 | 1 | 0.314 |
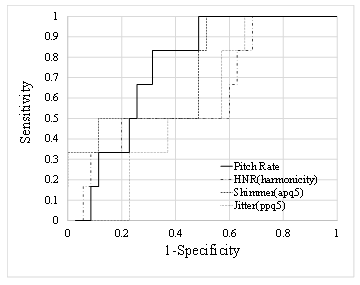
Figure 5 ROC curves used for discriminating between healthy individuals and patients using the pitch rate, jitter, shimmer, and HNR in the data containing read speech of “Kitakaze to taiyo” (Japanese).
Table 8 shows the AUC for the ROC curve, sensitivity, and specificity for these indices. For the AUC and specificity, the pitch rate was the most suitable. The sensitivity was 1 for all indices other than the pitch detection rate. As with German, the value of the AUC tended to be lower than in English.
Patient speech in Japanese included both read speech and free-form speech; these were separated manually. The differences between free-form speech and the recitation of a passage were investigated using these voice samples.
With respect to jitter, the mean values for reading and free-form speech were 0.013 (n = 35, SD = 0.007) and 0.013 (n = 35, SD = 0.008), respectively. Based on the t-test, no significant differences were observed between the two groups (t(68) = −0.304, p = 0.762). The correlation coefficient between them was 0.88.
With respect to shimmer, the mean values for reading and free-form speech were 0.059 (n = 35, SD = 0.030) and 0.067 (n = 35, SD = 0.034), respectively. Based on the t-test, no significant differences were observed between the two groups (t(68) = −0.95, p = 0.348). The correlation coefficient was 0.88.
With respect to the HNR, the mean values for reading and free-form speech were 12.30 (n = 35, SD = 3.23) and 11.65 (n = 35, SD = 3.56), respectively. Based on the t-test, no significant differences were observed between the two groups (t(68) = −0.806, p = 0.423). The correlation coefficient was 0.85.
With respect to pitch rate the mean values for reading and free-form speech were 0.668 (n = 35, SD = 0.232) and 0.582 (n = 35, SD = 0.277), respectively. Based on the t-test, no significant differences were observed between the two groups (t(68) = 1.41, p = 0.162). The correlation coefficient was 0.79.
4. Discussion and Conclusion
In this article, we propose a method for predicting whether a voice sample belongs to a healthy individual or a patient based on the pitch rate of a speech interval in English, German, and Japanese speech. Similar studies conducting comparative analyses of healthy individuals and patients have been performed using the same samples [22, 23]. However, those studies utilized voice samples of the long-vowel sound “ah.” Instead, our research focused on the detection of illness via a smartphone using free-form speech in the form of reciting a set passage.
As shown in Table 2, in the case of the long-vowel sound, the jitter, shimmer, and HNR all resulted in an AUC of approximately 0.9, showing that these indices have good discriminability. However, as shown in Table 4, in the case of read speech, the discriminability diminished. In particular, for the shimmer and HNR, the AUC decreased considerably, to approximately 0.7 or lower.
In contrast, in the case of read speech, the pitch rate resulted in an AUC exceeding 0.9, demonstrating better discriminability between healthy individuals and patients than the conventional indices. However, in the case of the long-vowel sound, the pitch rate for both healthy individuals and patients was approximately 1.0, making it unsuitable for discrimination between healthy individuals and patients.
As stated above, the AUC of the pitch rate for the English passage was 0.902, which was a favorable outcome. In German and Japanese, the pitch rate showed the highest identification efficiency, as was the case in English. However, the AUC values were 0.725 and 0.752 for German and Japanese, respectively, which is more than 0.15 lower that the AUC value for English. In English, the average pitch rate values for healthy individuals and for patients were 0.903 and 0.643, respectively. The corresponding values in German were 0.826 and 0.701 and in Japanese 0.831 and 0.668, respectively. These results demonstrate that the healthy individual pitch rates in German and Japanese are lower than the healthy individual pitch rates in English and the patient pitch rates in German and Japanese are higher than the patient pitch rates in English. Differences in patient pitch rates may be due to differences in the severity of illnesses among the patients in the databases.
However, the question of why healthy individuals reciting in English have a higher pitch rate than in the other two languages remains. This could be owing to the characteristics of the languages, and the differences in the contents of the recited passages could also be a factor. Furthermore, the different sampling frequency used for each database and differences in the noise from the recording environment could be factors contributing to the pitch rate discrepancy.
Regarding the difference in the speech contents, in German, for example, the passage used was a greeting used in daily life, which is close to free-form speech. The influence of these differences was examined in Japanese patient speech through a comparison of free-form speech and read speech. The results showed that all indices—jitter, shimmer, HNR, and pitch rate—had a strong correlation of about 0.75 to 0.85 between free-form speech and read speech. In addition, there was a significant difference between free-form speech and read speech only in the pitch detection rate. The average value of the pitch detection rate was 0.582 in the case of free-form speech and 0.668 in case of read speech, and the free-form speech tends to be lower. Perhaps the German pitch detection rate is lower than that of English because the content of the speech is close to free conversation.
Additionally, the average total speech time for the German passage used was 1561.81 ms for healthy individuals, which is extremely short compared to the English passage (10089.23 ms) and the Japanese passage (26144.17 ms). However, because the average pitch rate value was calculated for each utterance, the difference in the total length of the voice samples is not expected to have an effect on the results.
The thresholds q1,q2, and q3, used for the pitch rate calculation algorithm described in section 2.4 had the same value for every language. In a separate pilot study, it was determined that if the thresholds are set at an appropriate value for each separate language, the AUC for German and Japanese exceeds 0.8. Therefore, these thresholds may need to be tuned separately for each language. These points will be further evaluated in future studies.
Although we have demonstrated that for read speech, the pitch rate has high discriminability, it must be noted that read speech and everyday conversation in telephone calls are not equivalent. In the read speech data used here, both the healthy individuals and the patients read the same sentences. However, in everyday conversation, the content is diverse. For example, the percentage of consonants varies in each case and the pitch rate decreases when there are more consonants. It has been reported [24] that compared with read speech, spontaneous speech can better classify patients with major depressive disorders. We believe that further studies are required on the effects of the speech content on the pitch rate or the differences between read speech and spontaneous speech.
Although long vowels can be recorded by using a smartphone, it is necessary that day-to-day recording is performed regularly. It has been reported [25] that the frequency of voice recording in such conditions gradually decreases compared with telephone calls.
In this study, we used the algorithm proposed in [20, 21]. The pitch rate itself is naturally affected by the performance of the algorithm. However, if the algorithms are used to process the same pitch, although there may be variations in the absolute pitch rate values, we believe that the relative magnitude relationship between healthy individuals and patients will not change. This means that it is likely that differences in the algorithm do not adversely affect the discriminability between healthy individuals and patients. This is also a topic for future study.
In this study, each analysis was performed for well-recorded speech signals using a PC processor. However, when analyzing real speech recorded in real conditions using smartphones, the analysis might be influenced by the audio transducer or processor of the smartphone. These points are under verification.
The voice database used in the study contained data from patients with diverse disorders. It can therefore be argued that although we have suggested an index to broadly discriminate between healthy individuals and patients, this index cannot be applied to diagnose a specific disorder. In the future, we aim to develop algorithms for diagnosing specific disorders.
Conflict of Interest
The authors declare no conflict of interest.
Acknowledgment
This research is (partially) supported by the Center of Innovation Program from the Japan Science and Technology Agency, JST. This work was supported by JSPS KAKENHI Grant Numbers JP16K01408 and JP15H03002.
- S. Shinohara, M. Nakamura, S. Mitsuyoshi, S. Tokuno, Y. Omiya and N. Hagiwara. Voice disability index using pitch rate.” In Proceedings of IEEE EMBS, 557–560, 2016.
- S. Arora, V. Venkataraman, A. Zhan, S. Donohue, K. M. Biglan, E. R. Dorsey, and M. A. Little, “Detecting and monitoring the symptoms of Parkinson’s disease using smartphones: A pilot study” Parkinsonism Relat. D. 21(6), 650–653, 2015.
- K. K. Rachuri, M. Musolesi, C. Mascolo, P. J. Rentfrow, C. Longworth, and A. Aucinas, “EmotionSense: a mobile phones based adaptive platform for experimental social psychology research,” In Proceedings of the 2012 ACM Conference on Ubiquitous Computing, 650–653, 2010.
- H. Lu, M. Rabbi, G. T. Chittaranjan, D. Frauendorfer, M. S. Mast, A. T. Campbell, D. Gatica-Perez, and T. Choudhury, “Stresssense: Detecting stress in unconstrained acoustic environments using smartphones,” In Proceedings of the 2012 ACM Conference on Ubiquitous Computing, 351–360, 2012.
- O. Amir, N. Amir, and O. Michaeli, “Evaluating the influence of warmup on singing voice quality using acoustic measures” J. Voice, 19(2), 252–260, 2005.
- J. P. Teixeira, C. Oliveira, and C. Lopes, “Vocal Acoustic Analysis – Jitter, Shimmer and HNR Parameters” Procedia Technology, 9. 1112–1122, 2013.
- E. Yumoto, W. J. Gould, and T. Baer, “Harmonics-to-noise ratio as an index of the degree of hoarseness” J. Acoust. Soc. Am., 71(6), 1544–1549, 1982.
- M. Farrús, J. Hernando, and P. Ejarque, “Jitter and Shimmer Measurements for Speaker Recognition,” In Proceedings of the International Conference Interspeech 2007, 778–781, 2007.
- K. Vicsi, and D. Sztaho, “Examination of the sensitivity of acoustic-phonetic parameters of speech to depression,” In IEEE 3rd International Conference on Cognitive Infocommunications, 511–515, 2012.
- T. Shimizu, N. Furuse, T. Yamazaki, Y. Ueta, T. Sato, and S. Nagata, “Chaos of vowel /a/ in Japanese patients with depression: A preliminary study” J. Occup. Health, 47(3), 267–269, 2005.
- G. Zhou, J. H. L. Hansen, and J. F. Kaiser, “Nonlinear feature based classification of speech under stress,” IEEE Trans. on Speech and Audio Processing, 9(3), 201–216, 2001.
- M. Cannizzaro, B. Harel, N. Reilly, P. Chappell, P.J. Snyder, “Voice acoustical measurement of the severity of major depression” Brain and Cognition. 56, 30–35, 2004.
- J.C. Mundt, P.J. Snyder, M.S. Cannizzaro, K. Chappie, D.S. Geralts, “Voice acoustic measures of depression severity and treatment response collected via interactive voice response (IVR) technology.” J. Neurolinguistics. 20(1), 50–64, 2007.
- E. II. Moore, M. Clements, J. Peifert, L. Weisser, “Analysis of prosodic variation in speech for clinical depression” In Proceedings of IEEE EMBS, 3, 2925–2928, 2003.
- Y. Yang, C. Fairbairn, J.F Cohn, “Detecting Depression Severity from Vocal Prosody” IEEE Transactions on Affective Computing. 4(2), 142–150, 2013.
- M. Nishio, “Assessment of Motor Speech for Dysarthria” (ISBN 978-4-900637-38-2), Interuna Publishers, Inc., 2009. (in Japanese)
- S. Mitsuyoshi, F. Ren, Y. Tanaka and S. Kuroiwa, “Non-verbal voice emotion analysis system” Int. J. Innovative Computing, Information and Control, 2(4), 819–830, 2006.
- S. Mitsuyoshi, Y. Tanaka, R. Ren, K. Shibasaki, M. Kato, T. Murata, T. Minami, and H. Yagura. “Emotion voice analysis system connected to the human brain.” In IEEE NLP-KE 2007, 479–484, 2007.
- S. Mitsuyoshi, “Emotion recognizing method, sensibility creating method, device, and software” WO0223524, Mar. 21, 2002.
- S. Mitsuyoshi, “Research on the phonetic recognition of feelings and a system for emotional physiological brain signal analysis,” PhD thesis, Tokushima University, Tokushima, Japan, 2006.
- S. Mitsuyoshi, K. Ogata and F. Monma, “Speech analyzer detecting pitch frequency, speech analyzing method, and speech analyzing program” WO2006132159, Dec. 14, 2002.
- A. Al-nasheri, G. Muhammad, M. Alsulaiman, Z. Ali, T. A. Mesallam, M. Farahat, K. H. Malki, and M. A. Bencherif. “An Investigation of Multidimensional Voice Program Parameters in Three Different Databases for Voice Pathology Detection and Classification.” J. Voice, 31(1), pp. 113.e9–113.e18, 2017.
- A. Al-nasheri, G. Muhammad, M. Alsulaiman, and Z Ali. “Investigation of Voice Pathology Detection and Classification on Different Frequency Regions Using Correlation Functions.” J. Voice, 31(1), 3–15, 2017.
- S. Alghowinem, R. Goecke, M. Wagner, J. Epps, M. Breakspear, and G. Parker, “Detecting depression: A Comparison between spontaneous and read speech,” In Proceedings of 2013 IEEE International Conference on ICASSP, 7547–7551, 2013.
- N. Hagiwara, Y. Omiya, S. Shinohara, M. Nakamura, Y. Kogure, S. Mitsuyoshi, and S. Tokuno, “Verification of effects on the mental health monitoring system by voice using smartphone caused by the difference of the recording methods,” In proceedings of symposium of Japanese Society for Medical and Biological Engineering, 147, 2016. (in japanese)