A comparative between CRISP-DM and SEMMA through the construction of a MODIS repository for studies of land use and cover change
A comparative between CRISP-DM and SEMMA through the construction of a MODIS repository for studies of land use and cover change
Volume 2, Issue 3, Page No 598-604, 2017
Author’s Name: Herman Jair Gómez Palaciosa), Robinson Andrés Jiménez Toledo, Giovanni Albeiro Hernández Pantoja, Álvaro Alexander Martínez Navarro
View Affiliations
Department of System Engineering, Mariana University, 520002, Colombia
a)Author to whom correspondence should be addressed. E-mail: hjgomez@umariana.edu.co
Adv. Sci. Technol. Eng. Syst. J. 2(3), 598-604 (2017); ![]() DOI: 10.25046/aj020376
DOI: 10.25046/aj020376
Keywords: MODIS, CRISP-DM, SEMMA

Export Citations
Among the most popular methodologies for development of data mining projects are CRISP-DM and SEMMA, This research paper explains the reason why it was decided to compare them from a specific case study. Therefore, this document describes in detail each phase, task and activity proposed by each methodology, applying it in the construction of a MODIS repository for studies of land use and cover change. In addition to the obvious differences between the methodologies, there were found other differences in the activities proposed by each model that are crucial in non-typical studies of data mining. At the same time, this research determines safely the advantages and disadvantages of each model for this type of case studies. When the MODIS product repository construction process was completed, it was found that the additional time used by CRISP-DM in the first phase was composed in the following phases, since the planning, definition of mining goals, and generation of contingency plans, allow developing the proposed phases without inconvenience. It was also demonstrated that CRISP-DM is presented as a true methodology in comparison with SEMMA, because it describes in detail each phase and task through its official documentation and concrete examples of its application.
Received: 04 April 2017, Accepted: 12 May 2017, Published Online: 04 June 2017
1. Introduction
This paper is an extension of work originally presented in 11CCC IEEE 2016 [1].
The CRISP-DM methodology structures the life cycle of a data mining project in six phases [3], which interacts with each other in an iterative way during development of the project as shown in Figure 1. The methodology in a general description is organized in phases, where each phase is structured in several generic tasks of second level, and these make a projection towards specific tasks that described the actions that should be developed [3]. E.g., if the second level has the generic task “data cleaning”, the third level indicates the tasks that have to be developed for a specific case, such as “numerical data cleaning” or “categorical data cleaning”. Finally, the fourth level includes a set of actions, decisions and results of the data mining project in question.Within the set of business intelligence technologies is data mining, which in itself is a phase of the KDD process, and is responsible for the data preparation and the interpretation of the results. Keeping in mind that KDD is a process that has a high level of complexity, it was necessary the use of methodologies that allow a systematic approach in the construction of data mining projects, today there are two methodologies for the information treatment that are avant-garde in their models. The SAS company suggests the use of SEMMA methodology, likewise in 1999, a large consortium of European companies, NCR (Denmark), AG (Germany), SPSS (England) and OHRA (Netherlands) joined forces to develop a free distribution methodology called CRISP-DM (Cross Industry Standard Process for Data Mining) [2]. Those methodologies structure the data mining project in phases that are interrelated, converting the process into iterative and interactive.
On the other hand, the SEMMA methodology takes its name from the different stages that lead the process of information exploitation, sample, explore, modify, model, and assess. The methodology is itself a cycle whose internal steps can be performed iteratively according to the needs. SEMMA provides an easy-to-understand process that allows the development and maintenance of information exploitation projects [4].
Both methodologies structurally have similarities, e.g., the specific task of data cleaning, however they differ in several aspects, like tasks, activities and phases, e.g., in CRISP-DM there is a phase dedicated to problem understanding in terms of business, defining objectives, resources, roles, etc., for setting data mining goals, while SEMMA proposes to directly access the data to be analyzed, defining a sample and applying techniques of data mining without considering the business objectives. Therefore, this causes certain differences in the data mining process, and this document aims to identify them.
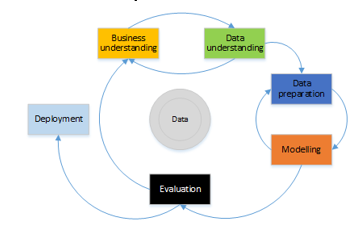
Figure 1: CRISP-DM methodology phases. Adaptation of: Chapman, P. [3].
MODIS (MODerate resolution Imaging Spectroradiometer), which is one of the most important for the monitoring of the processes of change in the earth for its spatial and spectral characteristics. The MODIS sensor was designed by an interdisciplinary team of scientists with extensive experience in remote sensing. This team worked for about 10 years to finally define requirements for data collection, calibration and processing [6]. This sensor produces a total of 648 tiles, which about 290 are classified as soil and therefore produce vegetation indices [7]. However, a vegetation index can be defined as a parameter calculated from reflectance values at different wavelengths, and is particularly sensitive to vegetation cover [8]. According to the previous definition, the variation of the vegetation index over time allows to determine if a field in terms of coverage or biomass is better or worse according to its historical values.
This study was used the MOD13Q1 products generated by the sensor on board the TERRA satellite, and as an alternative was used the MYD13Q1 products from AQUA satellite. The NDVI (Normalized Difference Vegetation Index) was used as an index to estimate the quantity, quality and development of vegetation based on measurement, by means of remote radiation sensors of certain bands of the electromagnetic spectrum that vegetation emits or reflects [7]. The EVI (Enhanced Vegetation Index) also was used, which is considered to be the most robust vegetation index, because it is more robust compared to the contribution of soil and atmospheric influences [7].
From the files downloaded for the study area, the first three products were extracted (NDVI, EVI and VI Quality); the quality of the data present in the spectral bands will determine the quality of the studies of land use and cover change. The reason why it is necessary to carry out a cleaning process following the steps proposed by a recognized methodology of data mining, where the quality of the data before applying mining techniques is essential. Therefore, it was decided to make a comparison between the CRISP-DM and SEMMA methodologies to determine the most appropriate for non-typical data mining studies such as the one referred to in this research. Thus the process was developed with a high level of detail phases, tasks and activities of each methodology, and it was finally possible to obtain the best quality of the MODIS products that would be used in studies of land use and cover change.
2. Research background
Nowadays, some worldwide researches are based on the MODIS sensor, e.g., to temporal and spatial comparison of the frequency of heat sources as a fire indicator in Colombia in recent years [9], as well as in techniques of data mining, physical and statistical models, based on satellite remote sensing methods [10], also in remote sensing systems that allow exploring diverse fields such as agricultural, forestry, or to evaluate land use and cover change [11]. However, in the found referents, it was evident the insufficiency of researches in which to guarantee the highest quality of the data to be used, following a data mining model, and even less if it is included in studies of land use and cover change using MODIS products. On the other hand, although there are several comparative studies between different models of data mining, including CRISP-DM and SEMMA [12, 13, 14], it is not clear which to use for researches that obtain data from MODIS products.
3. Methodology
The area of analysis of this research includes the territory of the department of Nariño; therefore the MODIS products downloaded correspond to tile h10v08. The tiles are distributed within a Cartesian system, starting at the position (0, 0) corresponding to the upper left corner and ending at the position (35, 17), corresponding to lower right corner [6]. The coverage area of each tile is 10×10 deg. The rows are defined by the letter “v” and the columns by the letter “h”, in this way is possible to make a suitable selection of the area of interest.
The MODIS products that work with vegetation indices are those corresponding to the MOD13 and MYD13 series, from which were selected those that provide a spatial resolution of 250 meters and a temporal frequency of 16 days, to finally obtain 355 MOD13Q1 products from the years of 2000 to 2015. For the identification of MODIS products with excellent quality for studies of land use and cover change, CRISP-DM and SEMMA data mining methodologies were applied faithfully following each phase, task and activity suggested.
With respect to the download, reprojection, transformation, cleaning and storage of MODIS products, some “scripts” were used in all cases to optimize the process, among them ModisDownload [15]. The scripts were created for the statistical program R, which is free (GNU) and through the RGDAL and Raster libraries can directly process the HDF files. The scripts make use of the MRT reprojection tool, which were granted free of charge by NASA, this tool allows the download, reprojection, conversion and integration of MODIS products [16], in addition to extracting the layers from each of them.
4. Result
The detailed process of the application of the mining methodologies presented in the previous sections is described below, and the similarities and differences between both models, are presented in a parallel, spotlighting the key elements of phases and previous tasks.
4.1. Phase 1
The development of this first phase in CRISP-DM is known as “Business Understanding” [3], which allows obtaining a greater level of understanding of the case study, this being a key component to construct the MODIS repository for studies of land use and cover change, because it is possible to plan a project and define clear and concrete data mining goals.
Task 1: denominated by CRISP-DM as “Determining business objectives” [3], in this general task the methodology suggests knowing what the client wants to obtain, thus giving the analyst a business perspective. In this first task the objectives were defined, based on the context, area of the problem and current solution, therefore the objective was: to classify regions in the department of Nariño in agricultural, forest and livestock, as defined by the IGAC [17]. Task 2: the methodology defines it as “Assess situation” [3], which is done by taking into account the inventory of resources (hardware, knowledge and data), identification of requirements, assumptions, constraints, risks and contingency plans, as well as including the costs and benefits of the study. For this research, it was identified among other elements: the different alternatives for the acquisition of MODIS products, among which standout 1) Reverb, online tool for the discovery of scientific data of the earth; 2) USGS Global Visualization Viewer which is a tool for searching and downloading satellite data 3) LP DAAC Data Pool, which allows direct access to MODIS products. In addition to these free tools provided by NASA, there are payment tools and scripts developed by experts with free access, the latter being the best alternative for the project. Task 3: CRISP-DM defines it as “Determine data mining goals” [3], in the specific tasks the data mining objectives and the evaluation criteria of the model are determined, which for the case study were respectively: identification of types of regions in Nariño, according to kind of vegetation found and the evaluation of the accuracy of the model compared with real data provided by IGAC – Nariño. Task 4: is known as “Produce project plan” [3], and is the last general task proposed by CRISP-DM for the first phase, in the specific tasks, the project plan was constructed through a table in which it stands out for each phase: time, resources, risks and contingency plans that are required for the successful project implementation, and to create the table, all the information obtained in previous tasks was required. Therefore the planning of the phases necessary to construct the repository of MODIS products can be visualized in the Table 1.
On the other hand, SEMMA in its first phase “Sample” [4], proposes to extract a sample of the total data, in this way allowed to make a previous analysis of the problem of mining. For the case study it was obtained that:
For data access, it was defined for this study that it would work with the MOD13 algorithm, specifically with the MOD13Q1 products, because in addition to be suitable for studies of land use and cover change, they do not produce pixels on oceans or soil under water. The study population was 355 HDF files and 1065 products of interest; B) to establish a small sample, 10 percent of the total population was chosen, therefore the sample size was 107 products; C) to form the sample was chosen a simple random method, obtaining 28 NDVI, 53 EVI and 26 VI Quality layers. For the extraction of the first three layers (NDVI, EVI and VI Quality) of interest in the case study, the MRT tool was used, as well an R script that optimizes the process.
Table 1: Project planning
| Phase | Resources | Risks | Contingency plans |
| Business understanding |
Documentation about MOD13Q1 product. Documentation about vegetation indices. Documents of IGAC from Nariño. Visualization tool: Quantum GIS |
Limited information in Spanish about these topics. | English and Portuguese documentation |
| Data understanding |
Website with products for soil studies as LP DAAC Scripts to download, reprojection and conversion of MODIS products. Tool to reproject and convert MODIS products (MRT). Environment and R programming language to execute the scripts. |
Bugs or limitations in the scripts.
|
Manual FTP downloading.
|
| Data preparation |
NDVI, EVI and VI Quality products. Environment and R programming language to execute the scripts. PostgreSQL – PostGIS to store the layers. Programming language: Python |
MODIS products that cannot be used. | Downloading MODIS products from AQUA satellite. |
At the end of the phase, it is concluded that CRISP-DM benefits the achievement of results because it allows for fully understanding of the problem in terms of the business and its equivalent in terms of data mining, even proposes to make a detailed plan that guarantees the success in the process.
4.2. Phase 2
In CRISP-DM the second phase is known as “Data Understanding” [3]. In this phase the methodology proposes data selection criteria, obtains and explores them, in a way that identifies the elements that determine their level of quality.
Task 1: denominated by CRISP-DM as “Collect initial data” [3], where the following criteria were defined: 1) Products of the MOD13 series with a resolution of 250 meters. 2) The study region should contain the area of Nariño (available in the h10v08 tile). 3) Download available products between February 2000 and June 2015 (for a total of 373 files in HDF format). For the download of MODIS products it is necessary to keep in mind parameters of the script to select a specific date, or a range of time; The coordinates to specify the tile to be downloaded, or several tiles when joining several coordinates; The script named “ModisDownload” of free access, originally created by Naimi [15], later adapted and improved by the community, uses the GDAL library, which allows reading and writing raster data compatible with spatial references, also the reading of vector data and HDF extension files belonging to the MODIS products. The MRT reprojection tool is free and developed by NASA [16]; this tool allows the download, reprojection, conversion and integration of MODIS products, in addition to the extraction of the layers of each product. The HDF files were obtained from the website: land data products and services LP DAAC [16]. The execution of the script was done per year and the time required to download the products of a particular year was 161 minutes. The total time for the download of all MODIS products was 2310 minutes. Adding the download time of AQUA sensor products would add 126 minutes. Task 2: known in the methodology as “Describe data” [3], for the case study was determined the description of the type and range of values of the attributes and the volume of the data (1119 files in TIF format and reprojected to the coordinate system accepted in Colombia. The files correspond to first three layers of the MOD13Q1 products). Task 3: named by CRISP-DM as “Explore data” [3], focused on the VI Quality product, which allows the determination of the quality of the data processed per pixel in the layers, using parameters such as the usability of the pixel, amount of aerosol, detection of adjacent clouds, atmospheric correction, among others. Task 4: defined as “Verify data quality” [3], it was decided to work with the first VI Quality layer parameter, identifying special values and cataloging its meaning (Table 2).
Table 2: Description of the VI Quality parameter used
| Bits | Parameter Name | Value | Description |
| 0-1 | VI Quality |
00 01 10 11 |
VI produced with good quality. VI produced, but checks other QA. Pixel produced, but most probably cloudy. Pixel not produced due to other reasons than clouds. |
The “Explore” phase [4] of SEMMA was developed with an exploration of the sample data, allowing complement the initial understanding of the problem, later the process was restarted and applying for all the data, thus sufficient inputs were available for the next phase. For the case study, the MODIS products of interest were the first three: NDVI, EVI and VI Quality. For the NDVI and EVI layers the valid range of values is -2000 to 10000 and its scale factor is 0.0001, which means that the values of 10,000 in a raster should be multiplied by 0.0001 in order to achieve the current value. As for the data quality criteria, the first four attributes of the first parameter of the Quality VI layer were chosen as indicated in Table 2.
The first phase of CRISP-DM is very important because it offers clarity on the problem to be solved and how to do it, whereas SEMMA does it, but in a very superficial way depending on several later phases of this, nevertheless SEMMA has as advantage that work with a smaller amount of data (however this first phase is optional). Regarding the data selection and evaluation criteria, the CRISP-DM methodology proposes to define them in the third task of the first phase, however, each of them had to be reviewed and improved in several of the following tasks in the same phase. Through the criteria it was possible to optimize the process of data selection and the cleaning of data. In SEMMA the definition of selection criteria was quite questionable at the beginning, and each criterion had to be improved and corrected in the course of the tasks and even in the following phases.
4.3. Phase 3
This phase is known as “Data Preparation” [3] in CRISP-DM, it is composed of four general tasks and the same number of specific tasks.
Task 1: named by CRISP-DM as “Select data” [3], allows determining which data will be included for the study and the criteria to exclude the data with low quality. For SEMMA, this task is called “Transformation and selection of data” [4] and consists, as in CRISP-DM, of identifying the data to be used in the next task, however SEMMA did not consider the inclusion of MYD13Q1 products, thus obtaining 1065 files, unlike the 1119 obtained by CRISP-DM, despite this, the development of the task was similar in the two methodologies and described below.
For each downloaded MOD13Q1 product the first three layers (NDVI, EVI and VI Quality) were extracted, by means of the adaptation of the script developed by Golicher [18], to transform the image to the TIF format and at the same time reproject it to the coordinate system accepted in Colombia, obtaining a total of 1119 new files. The VI Quality product allows determining the quality of the data processed per pixel, identifying which data has an excellent quality, an intermediate quality, a low quality and which cannot definitively be used [7]. For the case study it defined the first 4 bits of the VI Quality layer described above in Table 2, determining that the total of non-usable pixels will be the result of the sum of the probably clouded pixels and the pixels not produced, Therefore, if this value exceeds 30% of the pixels in the image, it should be discarded [19].
In order to determine the quality of each image for the NDVI and EVI products, the calculation was performed by adapting the script developed by Lydholm [20] for the statistical program R. The process was performed by each VI Quality layer, determining the number of non-usable pixels in the study region and keeping in mind an analysis is not possible if the amount of unusable data exceeds 30% [19].
In the script, the necessary libraries were loaded to use methods to create raster images and functions to handle HDF files. The next step was to set the directory in which the TIFF files corresponding to the Quality VI layer are located. After extracting the addresses of each of the files in the list, it was proceeding to work each of them in an iterative structure to determine if the quality of the associated layers has a value greater than 70%. Finally, the directory was set to store the images under the accepted quality value.
In the script was also defined an iterative structure which used the list of addresses of the files with the VI Quality layer obtained in the previous steps, for each VI layer, a raster file was generated and stored in memory, then, a function was defined that It will take the first bits inside the raster, transform them to integers and reverse them. Then, the previous function was used in each raster, thus obtaining the total amount of pixels with a high, medium and low quality. These are pixels with such a high amount of clouds that they cannot be used, and pixels not produced or not usable for other reasons. On the other hand this also determines the amount of pixels corresponding to land, ocean, land under shallow water (rivers) and land under moderately deep water (lakes).
Once the parameters for each raster previously defined in Table 2 were obtained, it was extracted, transformed to a percentage and adds the values corresponding to cloudy and non-produced pixels. Then a logical expression was used to determine if the previous sum is greater than 30, if it is true, a text file was generated with the date of the VI Quality layer analyzed as its name, and inside it stored the quantity of pixels of high quality, average quality, pixels probably cloudy and unprocessed. Likewise in the following line its equivalent in percentage, the sum of the last two values and finally the exact name of the file containing the VI Quality layer. This text file allows the investigator to know in detail why that particular image was discarded by the script. After this, a PNG image (Figure 2) was generated with the analyzed raster and stored in the specified destination at the beginning of the code.
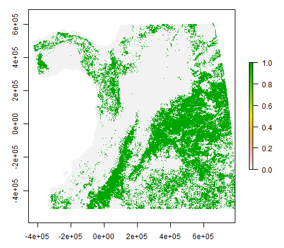
Figure 2: Image generated by the R script of the VI Quality layer on June 10, 2015.
However, due to the size of the MODIS tile and considering that the study region was smaller than the size of the image, it was decided to re-evaluate the images discarded by the script, therefore it was constructed in such a way that it generates a report with the images that did not exceed the minimum of non-usable pixels, besides an image in PNG format with the date of the VI Quality layer analyzed, in which represented in a green color are the clouds present in the region, and a text file with the quality values. Delegating responsibility to the researcher to decide which were still valid and which should definitely be withdrawn from the study.
Sometimes the script discarded the two images obtained in the same month, leaving several months in a year without data to analyze, for this reason the MODIS products generated by the sensor in AQUA satellite were downloaded and used for those special months. This situation had already been foreseen in the first phase of the CRISP-DM methodology, so that a contingency plan was included in the overall planning of the data mining project and it was carried out in this phase.
- B) Task 2: named by CRISP-DM and by SEMMA as “Clean data” [3, 4], this task classified the MOD13Q1 products with the sufficient quality to perform studies of land use and cover change, and the products to be discarded. In contrast to SEMMA, in the CRISP-DM methodology, the MYD13Q1 products were established as a contingency plan in view of the risk of running out of products in a particular month. In the following section, the task is presented considering the contingency plan.
Keeping in mind the selection criteria, (percentage of usable pixels, spatial and temporal resolution, and MODIS product type) it was obtained: 746 images, which were valid images only 534 therefore the quantity of discarded images was 212. The time required for this process was 2804 minutes, being the process that required most time during the entire investigation. By year the time used was about 179 minutes; in addition the time for the 18 images of the satellite AQUA was about 147 minutes.
Table 3 and Table 4 present the data cleaning report for two years in particular, highlighting in gray the images that despite reporting a higher percentage of unusable pixels to be accepted can be used in the study region. Also highlighted in orange are the months in which all images were excluded, thus the MYD13Q1 products were downloaded and analyze the result of the process can be seen in Table 5 and in Table 6.
Table 3: Data cleaning process MOD13Q1 between 2014 and 2015 (part 1)
| Item | Name | Date |
| 1 | 2014-02-18.250m_16_days_VI_Quality.tif | 2014-02-18 |
| 2 | 2014-03-06.250m_16_days_VI_Quality.tif | 2014-03-06 |
| 3 | 2014-04-07.250m_16_days_VI_Quality.tif | 2014-04-07 |
| 4 | 2014-05-25.250m_16_days_VI_Quality.tif | 2014-05-25 |
| 5 | 2014-06-10.250m_16_days_VI_Quality.tif | 2014-06-10 |
| 6 | 2014-08-13.250m_16_days_VI_Quality.tif | 2014-08-13 |
| 7 | 2014-09-30.250m_16_days_VI_Quality.tif | 2014-09-30 |
| 8 | 2014-10-16.250m_16_days_VI_Quality.tif | 2014-10-16 |
| 9 | 2014-11-01.250m_16_days_VI_Quality.tif | 2014-11-01 |
| 10 | 2015-03-06.250m_16_days_VI_Quality.tif | 2015-03-06 |
| 11 | 2015-03-22.250m_16_days_VI_Quality.tif | 2015-03-22 |
| 12 | 2015-04-07.250m_16_days_VI_Quality.tif | 2015-04-07 |
| 13 | 2015-04-23.250m_16_days_VI_Quality.tif | 2015-04-23 |
| 14 | 2015-05-09.250m_16_days_VI_Quality.tif | 2015-05-09 |
| 15 | 2015-05-25.250m_16_days_VI_Quality.tif | 2015-05-25 |
| 16 | 2015-06-10.250m_16_days_VI_Quality.tif | 2015-06-10 |
Task 3: named by CRISP-DM as “Construct data” [3], after completing this task, the structure of the tables that store the data resulting from the previous task were obtained. For SEMMA, this task is called “Construction of the repository” [4] and actually covers in its development in the fourth task of CRISP-DM, because it not only identifies the structure of the repository, it also builds it. In CRISP-DM that process is divided into two tasks, therefore the description of the third task of SEMMA corresponds to two sections dedicated to third and fourth task of CRISP-DM.
PostGIS was used for the construction of the repository, because is a spatial extension of PostgreSQL, that in addition to be a spatial database compatible with “OpenGIS Simple Features for SQL” [21], it allows us to manage spatial objects (roads, rivers, forests, etc.) as objects of the database, allowing to calculate relationships between objects that are very difficult to model without using spatial objects [21], such as proximity, adjacency, containment, among others. The database was created in PostgreSQL, however a PostGIS extension must be added to the DBMS so that it recognizes, e.g., raster type attributes.
Table 4: Data cleaning process MOD13Q1 between 2014 and 2015 (Part 2)
| Item | Pixel produced, but most probably cloudy |
Pixel not produced due to other reasons than clouds |
No usable pixels (%) | Exclude | ||
| Quantity | (%) | Quantity | (%) | |||
| 1 | 8135534 | 36.6 | 1319373 | 5.9 | 42.5 | Si |
| 2 | 8618282 | 38.7 | 1318783 | 5.9 | 44.6 | Si |
| 3 | 6370910 | 28.6 | 1320358 | 5.9 | 34.5 | Si |
| 4 | 6102452 | 27.4 | 1320584 | 5.9 | 33.3 | Si |
| 5 | 6627708 | 29.8 | 1317959 | 5.9 | 35.7 | No |
| 6 | 7669296 | 34.5 | 1319543 | 5.9 | 40.4 | Si |
| 7 | 5441419 | 24.5 | 1318093 | 5.9 | 30.4 | Si |
| 8 | 5706722 | 25.7 | 1318820 | 5.9 | 31.6 | No |
| 9 | 5596434 | 25.2 | 1320674 | 5.9 | 31.1 | Si |
| 10 | 6657345 | 29.9 | 1305071 | 5.9 | 35.8 | Si |
| 11 | 6245216 | 28.1 | 1304754 | 5.9 | 34 | Si |
| 12 | 9507546 | 42.7 | 1302703 | 5.9 | 48.6 | Si |
| 13 | 5593483 | 25.1 | 1304982 | 5.9 | 31 | No |
| 14 | 6682094 | 30 | 1304743 | 5.9 | 35.9 | Si |
| 15 | 9714449 | 43.7 | 1305965 | 5.9 | 49.6 | Si |
| 16 | 5624849 | 25.3 | 1305321 | 5.9 | 31.2 | No |
Table 5: Data cleaning process MYD13Q1 (part 1)
| Item | Name | Date |
| 1 | 2015-03-14.250m_16_days_VI_Quality.tif | 2015-03-14 |
| 2 | 2015-03-30.250m_16_days_VI_Quality.tif | 2015-03-30 |
| 3 | 2015-05-01.250m_16_days_VI_Quality.tif | 2015-05-01 |
| 4 | 2015-05-17.250m_16_days_VI_Quality.tif | 2015-05-17 |
Table 6: Data cleaning process MYD13Q1 (part 2)
| Item | Pixel produced, but most probably cloudy |
Pixel not produced due to other reasons than clouds |
No usable pixels (%) | Exclude | ||
| Quantity | (%) | Quantity | (%) | |||
| 1 | 7161513 | 32.2 | 1321807 | 5.9 | 38.1 | Si |
| 2 | 7846294 | 35.3 | 1320976 | 5.9 | 41.2 | Si |
| 3 | 5662943 | 25.5 | 1317536 | 5.9 | 31.4 | No |
| 4 | 7794798 | 35 | 1324353 | 6 | 41 | Si |
Considering that database will be filled with identical information, it was inappropriate to create a single table that contains them; the best way to handle large amounts of data is by partitioning tables. In order to perform the partitioning of tables, a parent table must be created, which will later inherit the characteristics of the child tables [22]. For the case study corresponds to one table per year and vegetation index.
Task 4: named by CRISP-DM as “Integrate data” [3], this task allows the combination of data resulting from previous tasks. For the case study it was necessary to use the structures defined in the repository construction as described below.
To create the database, a script was developed based on Golicher’s approach [18], the Python-built script for this work allowed defining one table per year, inheriting the characteristics of the main table, and allowing the entry of a layer in TIF format for each table depending on the year in which it was obtained. At the end of the process, 15 tables were obtained from the NDVI vegetation index and another 15 tables from the EVI vegetation index. Finally, a total of 32 tables were obtained, each with an average number of records of 1517.
In the script used, the corresponding libraries to handle SQL statements and file handling were loaded. Later, it selected the folder in which the files for the NDVI or EVI vegetation index were stored, then a list was extracted with all the files and was classified according to the year of each layer, finally, an iterative expression was built which runs the data by each year, beginning in the year 2000 and ending in the year 2015. In the iterative structure a new table was created with the name of the vegetation index and the respective year, a restriction of dates in such a way as prevent entering different values than the selected year. The other attributes are inherited from the main table, finally, it was proceeded to define another cycle that will be responsible for filling each record of the table with the corresponding indices (usually two for each month). In the next iterative expression, each product NDVI or EVI was evaluated, creating a temporary table with the raster of each one, for this the command program “raster2pgsql” offered by PostgreSQL was used, including the parameters and access data for the required database. Then, a new attribute of date type was added to the temporary table to insert the exact date of the MODIS product. Data of the temporary table was transferred to the table defined in the previous cycle. Finally, if it leaves the iterative structure, it means that for that particular year, all the corresponding layers have already been registered; therefore an index can be defined per year.
5. Conclusion
The data cleaning process for MODIS products in studies of land use and cover change using the CRISP-DM methodology, was easier than SEMMA, mainly because CRISP-DM is presented as a true methodology of data mining with detailed phases, tasks and activities. Also, it has documentation produced by typical case studies which the methodology was applied; guaranteeing that CRISP-DM methodology for the cleaning of the MODIS products would work without any problems. Another important point in the success of the application of CRISP-DM was the preliminary tasks that clearly defined the process, including predictions about possible problems in the data cleaning stage.
It should also be noted that the use of R scripts helped and optimized the process of cleaning, downloading and reprojection of MODIS products, because the time invested in each phase of the methodology was smaller than the one invested on the traditional way. It can also be concluded that managing a high level for understanding the problem was a key to build the MODIS repository for studies of land use and cover change, because it defined a clear and concrete mining goals, where the CRISP-DM methodology dedicates an entire phase to transform the problem in terms of data mining.
On the other hand, SEMMA is designed to work with the SAS® Enterprise Miner™ tool, and all available documentation focuses on this tool, therefore, when working with non-typical mining cases as the case study presented in this article, the amount of SEMMA disadvantages increase, demonstrating that SEMMA is not suitable for applying in a similar studies as presented in this manuscript. In contrast, CRISP-DM methodology is recommended when attempting to perform a data mining project, because it has all the available documentation, detailed phases, tasks and activities, and the development of the first phase, that facilitate the problem understanding and its transforming to a data mining problem. It is a better approach if the knowledge of the problem in terms of business is insufficient and if the problem does not fit within the typical cases solved with mining techniques.
For future work, it is recommended to use all available MODIS products obtained from the sensor in the TERRA satellite and from the sensor in AQUA satellite. Both satellites combined generate four images every month, however, according to the results it was common that in the months with worse weather in Colombia, sometimes all the images were discarded by excessive cloudiness for those months.
It is also worth noting that the time for the data cleaning process was quite long, mainly due to the physical characteristics of the computer used, then, the best way to optimize the process would be through a computational cluster of high performance, improving computing capacity and it would significantly reduce the total time invested at the end of the data cleaning process, and in general of the whole study. In the same way, it is suggested to optimize the scripts used in the research, making them more efficient, allowing to analyze all the required years in a single execution, and to facilitate the inclusion of different phases in sequence and in parallel. Finally, a suitable graphical interface for scripts would be very helpful for researchers who need them, facilitating their use and improving their “usability”.
Conflict of Interest
The authors declare no conflict of interest.
Acknowledgment
The authors wish to express their gratitude to department of systems engineering and to department of environmental engineering of Mariana University, also to all the individuals who have been sources of help throughout the research period.
- H.J. Gómez, et al “Comparativa entre CRISP-DM y SEMMA para la limpieza de datos en productos MODIS en un estudio de cambio de cobertura y uso del suelo” in Computing Conference (CCC), 2016 IEEE 11th Colombian. IEEE, 2016. p. 1-9.
- Gondar Nores, Jose Emilio. Redes Neuronales Artificiales, Data Mining Institute, 2001
- P. Chapman, “CRISP-DM Step by Step Data Mining,” 76 p, 1999.
- Data Mining and the Case for Sampling. Solving Business Problems Using SAS® Enterprise Miner™ Software. SAS Institute Inc. 36 p, 1998.
- P. Vázquez, E. Adema, y B. Fernández, “Dinámica de la fenología de la vegetación a partir de series temporales de NDVI de largo plazo en la provincia de La Pampa,” pp 1-2, Agosto 2013.
- J. Francois M., “Aplicaciones del sensor MODIS para el monitoreo del territorio,” pp 16-98, 2011.
- R. Solano, K. Didan, M. Barreto y A. Huete, “MODIS Vegetation Index User’s Guide (MOD13 Series),” The University of Arizona, version 3.0 Junio 2015.
- V. Torres, P. Paredes, y P. Rial, “Análisis de la anomalía del índice de vegetación mejorado (EVI), del sensor MODIS, para la provincia de Santa Cruz,” pp 1-2, 2010.
- D. Armenteras, F. González, y K. Franco A., “Distribución geográfica y temporal de incendios en Colombia utilizando datos de anomalías térmicas,” Bogotá, 16 p. 2009.
- J. García G., “Remote Mining: Aplicando minería de datos a teledetección sobre LIDAR,” España, 86 p. 2010.
- A. Sánchez, A. Etter, y M. CLARK, “Land Cover Change in Colombia: Surprising Forest Recovery Trends between 2001 and 2010,” 16 p. Agosto 2012.
- H. Camargo, y M. Silva, “Dos caminos en la búsqueda de patrones por medio de minería de datos: SEMMA y CRISP,” Rev. Tecnol. – Journal of Technology • Volumen 9 No. 1. Bogotá, 8 p. 2011
- J. Moine, S. Gordillo, y A. Haedo, “Análisis comparativo de metodologías para la gestión de proyectos de minería de datos,” CACIC Argentina, 8 p. 2011.
- A. Azevedo, y M. Santos, “KDD, SEMMA AND CRISP-DM a parallel overview,” AIDIS Amsterdam, 5 p. 2008.
- B. Naimi, “ModisDownload: an R function to download, mosaic, and reproject the MODIS images. R-GIS,” 2015.
- USGS Earth Resources Observation and Science (EROS) Center, Land processes DAAC, “MODIS reprojection tool user’s manual,” pp 42-54 Abril 2011.
- Instituto Geográfico Agustín Codazzi, “Estudio general de suelos y zonificación de tierras Departamento de Nariño. Capítulo 8: Zonificación del medio biofísico,” pp 251-253, 2015.
- D. Golicher, “Loading Modis NDVI time series into PostGIS raster,” 2012.
- C. Mulleady, y D. Barrera, “Estimación de la tasa de evapotranspiración a partir de datos satelitales,” 2013. Meteorologica vol.38 no.1 Ciudad Autónoma de Buenos Aires ene./jun. 2013.
- M. Lydholm R., “Geographic Information Systems. StackExchange: Parse modis MOD13Q1 quality layers in R,” 2015.
- PostGIS 2.0 Manual, SVN Revision (14671), pp 7, 27-29. 2015.
- The PostgreSQL global development group. PostgreSQL 9.0.22 Documentation. Cap. 5: Partitioning, 2015.