FAG – a management support tool with BI techniques to assist teachers in the virtual learning environment Moodle
FAG – a management support tool with BI techniques to assist teachers in the virtual learning environment Moodle
Volume 2, Issue 3, Page No 587-597, 2017
Author’s Name: Luciana Silva Zapparolli1, a), Itana Stiubiener2
View Affiliations
1Faculdade de Tecnologia, Informática, Fatec Mauá e Zona Sul, Brasil
2Universidade Federal do ABC, Centro de Matemática, Computação e Cognição, UFABC, Brasil
a)Author to whom correspondence should be addressed. E-mail: luciana.zapparolli@fatec.sp.gov.br
Adv. Sci. Technol. Eng. Syst. J. 2(3), 587-597 (2017); ![]() DOI: 10.25046/aj020375
DOI: 10.25046/aj020375
Keywords: Business Intelligence, Learning Analytics, Monitoring in virtual environments

Export Citations
One of the great challenges in distance-learning is to follow the actions of the teachers/tutors and also the actions of students during the process of teaching and learning. This article presents the FAG Tool integrated with the LMS Moodle was developed to help managers of the Distance Education environment to monitor the actions of teachers/tutors and also teachers/tutors in the follow-up of student actions. Through the techniques of Business Intelligence (BI) and Learning Analytics (LA), the tool generates analytical reports and dashboards, presenting a holistic and transversal view, being this vision the differential of this tool. The use of FAG allows teachers/tutors to monitor the participation of all their students in all virtual rooms under their responsibility and thus take corrective measures in the teaching and learning process, such as reducing the risk of avoidance. For the managers, it can be considered as a support tool for decision making regarding the faculty, maintaining or not the teacher/tutor in the process of teaching and learning or even be a base to enlarge or reduce their classes depending on their performance in the virtual environment. Through the use of the FAG, this decision-making can happen during the teaching and learning process and not only after the end, as is usual, because the reports are easy to understand and present accurate information in time to ensure the success of the teaching and learning process.
Received: 05 April 2017, Accepted: 15 May 2017, Published Online: 04 June 2017
1. Introduction
This publication is an extension of the article entitled “Management support tool in virtual leaming environments using MoodIe as a case study” that is published in 2016 XI Latin American Conference on Learning Objects and Technology (LACLO)[1].
Nothing prevents a teacher from acting as a tutor in online courses [6]. In order to guarantee better results in the process of distance teaching and learning, one of the needs is the monitoring process of teachers/tutors’ actions, often done by a manager of many or all courses of an institution. Usually, the management reports provided by an LMS are confusing, offering scattered data that do not allow a global view of the observed processes, thus hindering efficient management and decision-making [7]. Among the several existing LMSs Moodle will be used, once it is an LMS widely used in thousands of institutions in the world and consequently a very safe and very tested system. Moodle offers Learning Analytics (LA) tools that can be defined as a set of tools geared to the measurement, collection, analysis and reporting of student data in order to improve the teaching and learning process through analysis of generated data. These tools generate analytical reports and/or graphs of specific resources as classrooms or participants. In this way, the importance of this work is the identification of an auxiliary tool that, integrated to Moodle LMS, offers a better follow-up of the students’ participation, besides an efficient monitoring of the actions of the teachers/tutors in relation to all the activities and contexts in which they work.Distance education is a widely used teaching modality in the teaching and learning process [2]. In this modality of teaching, there are several actors, and the teacher is responsible for motivating and stimulating the learning process in order to transform the information into knowledge by the students, who are considered active subjects in this process [3]. The tutor is responsible for guiding the student, explaining and clarifying questions related to the subject and participating in the evaluation activities [4] and the distance-learning environment and process manager is responsible for planning, organizing, directing and controlling [5]. In this work the role of a teacher and a tutor will be considered as a single role, called, teacher/tutor, since not necessarily a course needs a teacher and a tutor. This decision is related to three situations: digital fluency of a teacher, an excessive number of students enrolled and teachers availability of time to carry out and follow the course.
Section 2 presents concepts related to the knowledge area of work, such as Business Intelligence (BI), Learning Analytics (LA), some Moodle tools associated with LA, as well as the Pentaho BI and Qlik Sense Cloud tools, which will be used in the case study. Section 3 will present the methodology and case study. Section 4 presents the tool developed to solve the problem detected in the case study and partial result. In section 5 the conclusion will be presented and in section 6 future works will be proposed. Finally, bibliographical references are presented.
2. Concepts referring to the knowledge area of work
2.1. Business Intelligence (BI)
BI is a tool that assists in the selection, presentation and analysis of data, is a set of processes, technologies and tools necessary to transform data into information, information into knowledge [8].
Throughout their existence, organizations generate and store a large amount of data related to the activities performed, thus making it necessary to apply BI techniques in the strategic decision-making process, since mistaken decisions can jeopardize the future of an organization. In this scenario, there are also educational institutions, which need to be able to subsidize the optimization of their decision-making processes [9].
2.2. Business Intelligence Architecture Components
They are components that aid in the visualization and manipulation of large amounts of data:
- Data warehouse (DW): is defined as a database that serves as a repository of an organization built for the purpose of generating reports and business analysis [10].
- ETL (Extract Transform Load): The ETL process consists of reading the data from one or more databases, the process of which is called the extraction, after the extraction has the conversion of the extracted data to the form that is required, in order to be loaded on a date warehouse or other database, called transformation and finally the loading of the data in the data warehouse [11]. The ETL feeds DW and BI, and if this process does not work properly, the BI will not have the necessary information [12].
- OLAP (On-Line Analytical Processing): OLAP tools enable online generation of information in the form of reports, rankings, ad-hoc queries (uniquely mounted by the user), etc. [13].
The OLAP technology allows making an instance of the data in a multidimensional view, thus allowing the presentation of the information in different perspectives [19]. OLAP information is stored in subsets called information cubes, updated periodically from the DW, according to Figure 1.
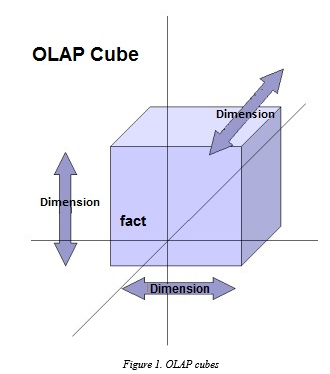
Figure 1. OLAP cubes
2.3. Business Intelligence in Learning Management System (LMS)
The concept of Business has changed. With the adoption of LMS in the learning support, the volume of information to be managed by teachers/tutors and also by the managers of LMSs systems increases, which makes it difficult to manage in these environments [14]. A derivation of the principles of BI used in information systems applied to the educational field, called Learning Analytics [15].
2.4. Learning Analytics (LA)
The term Learning Analytics appeared for the first time in 2009 in The Horizon Report. It is a field of research that is growing and presents several tools implemented in educational environments aim to offer educators resources so that they recognize and evaluate their educational process [17-18].
The main objective of the learning analysis is to generate information for those who create learning situations, such as teachers/tutors, managers and educational institutions [8]. It is a powerful way to inform students, teachers/tutors and managers about student performance and the progress of the learning process [19].
2.5. Learning Analytics (LA) in Moodle
Among the tools with LA resources offered by the Moodle can be cited:
- GISMO: consists in a visualization tool used to analyze the learning process of students comprehensively, which gives a view of the whole class and not just a specific student or a specific resource. It is useful to teachers/tutors.
- MOCLog: it is a set of tools used to analyze and present Moodle data. The development of this tool was based on GISMO, through this tool users have access to summary reports of interactions related to actions in resources and tools, such as questionnaires [16].
- Learning Analytics Enhanced Rubric (LAe-R): consists a plugin created for Moodle LMS being an advanced classification method used for the careful evaluation. Contains some related criteria and classification levels associated with data from the analysis of student interaction and learning behavior in a course such as access time to learning materials, message numbers, and others [17].
In addition to the tools presented there are other ways to see the trends, analysis, and data on the platform from Moodle 2.8, among them:
- Event monitoring: Issue notifications to administrators and teachers/tutors when certain events occur in Moodle;
- General statistics: this is a plugin that generates site graphics and course reports, including user login, countries, preferred languages, number of courses per category, number of courses per size and registered users;
- Comprehensive report (site-wide Report): they are accessed by administrators are reports of the entire site;
- Compromise Analysis: The Engagement Analytics module provides information about student progress in the course, choosing activities that will be monitored by Moodle;
- Activities (Logs): These are reports that can be viewed by administrators;
- Forums Reporting Charts (Report Graph Forum): Displays the interactions in a single Forum activity and creates a targeted graph;
Through the tools with LA resources offered by Moodle it is not possible to extract analytical and consolidated reports containing information about all the rooms under the responsibility of a certain teacher / tutor, which makes it extremely difficult for the EaD manager to group information from room to room, considering That, most of the time, a teacher/tutor participates in several rooms simultaneously.
2.6. Pentaho BI
The Pentaho Open BI platform is a suite of open source applications for creating BI solutions, distributed through the open source Pentaho Public License (PPL). The Pentaho suite is one of the most used and reputed in the market [18].
The most important Pentaho modules that will be used in this work are:
- Pentaho Data Integration (PDI): one of the most powerful components responsible for the ETL process, is a collection of tools designed to fill the Data Warehouse with data [22].
- Platform Pentaho User Console (BiServer): an analysis platform that will run under a Tomcat server in a MySQL database, Linux environment.
- Pentaho Report Designer: tool that allows you to generate reports in a consolidated and analytical way.
2.7. Qlik Sense Cloud
The Qlik Sense Cloud platform focuses on self-service, lets you quickly create views.
The tool does not work with inflexible cubes, it creates a large file with all associations, so any table can be “fact” or “dimension” and all relevant data is available in RAM, a technology known as AQL (Associative Query Logic), Different from OLAP, where it is necessary to define the necessary dimensions and metrics [20].
Qlik Sense Cloud lets you share Qlik Sense applications in the cloud for free. It is a Software as a Service (SaaS) service or program as a service[20].
The great differential of this tool, besides the ease of generating graphical reports is that it adapts to tablet and smartphone[21].
3. Methodology and case study
For the development of the work the following steps were performed:
- Extraction of real data of Moodle, referring to the disciplines of four undergraduate courses that occurred in the second half of 2015, being, Human Resources Management, Management Process Management, Administration and Accounting Sciences. Statistics of the interactions of teachers/tutors with students in the tools were presented: forum and questionnaire, as well as student participation, through a case study.
- Analysis of the results obtained in order to verify the problems pointed out by the bibliographic research.
- Implementation of the tool using the platforms Pentaho BI and Qlik Sense Cloud.
The name of the teacher/tutor will be omitted, and in the case study, it will be referenced as tutor “A”.
The data were obtained from the three disciplines, under the responsibility of tutor “A”, named: MKP – Personal Marketing, MTA – Methods and Techniques of Applied Research and PO – Organizational Psychology. These disciplines were chosen by totaling a larger number of registered students.
3.1. Profile of tutor “A” in the courses and disciplines analyzed
The responsibilities of teachers/tutors in this environment:
- Track students’ daily access,
- Attend the Doubts at Forum within 24 hours of posting,
- Post informational and alert messages in the News Forum,
- Prepare and distribute the programmatic contents of the course according to the specific program specified in the course plan, respecting the academic calendar of the institution,
- Prepare and publish activities that can be:
o Questionnaires,
o Evaluation forums,
o Online types or file uploads,
- Give feedback on activities,
- Prepare and correct the evaluations.
In addition, teachers/tutors are encouraged to motivate the participation of students by sending weekly messages, alerting them to the timing of the proposed activities and orienting them in the studies. The more classes the teacher/tutor has under their responsibility, the more time they will have to spend to fulfill those responsibilities.
3.2. Follow-up of student participation and tutor actions “A” in the subjects MKP, MTA and PO
Table 1 presents an overview of student participation (access) in the three virtual rooms, under the responsibility of tutor “A”. Students who, at least once, accessed the virtual room in the last month of the course in December 2015 were considered active “.
Table 1. Participation of students (accesses) in virtual rooms
| Discipline | Students | ||||
| Total amount | Active amount | (%) |
Never attended the course amount |
(%) | |
| MKT | 34 | 27 | 79,4% | 0 | 0,0% |
| MTA | 188 | 172 | 91,5% | 11 | 5,8% |
| PO | 95 | 88 | 92,6% | 3 | 3,1% |
Figure 2 presents the analytical report offered by Moodle, referring to student accesses, in a specific room where the teacher/ tutor acts.
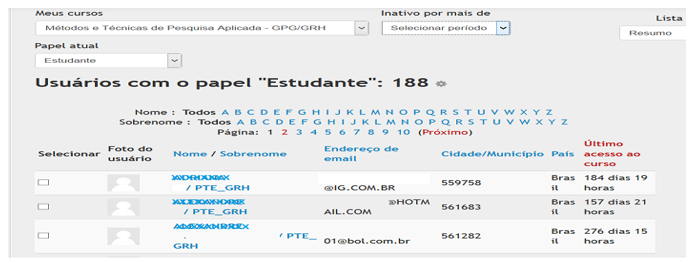
Figure 2. Students access
This report is offered by Moodle LMS, however, the teacher/ tutor must access each virtual room under his responsibility, issue the report and check the last access of the students registered in it. There is no cross-sectional view.
Table 2 presents an overview of the participation of students in the Forum of News, in the three virtual rooms, the responsibility of tutor “A”.
Table 2. Participation of students in the News Forum
| Discipline | Students | ||
| Total | Access | (%) | |
| MKT | 34 | 17 | 50,0% |
| MTA | 188 | 38 | 20,2% |
| PO | 95 | 21 | 22,1% |
Table 3 presents an overview of students’ participation in the Doubt Forum, in the three virtual rooms, under the responsibility of tutor “A”.
Table 3. Student participation in the Doubts Forum
| Discipline | Student | ||
| Total | Access | (%) | |
| MKT | 34 | 23 | 64,6% |
| MTA | 188 | 62 | 32,9% |
| PO | 95 | 33 | 34,7% |
Figure 3 presents the analytical report regarding the accesses in the News Forum by students in a specific room that the teacher /tutor acts.
The report extracted from Moodle regarding student access in the Doubt Forum is identical to the one shown in Figure 3.
It is important to note that all participants of the course receive the messages that are posted in the forums also by e-mail and, since it is not possible to count the accesses to the e-mail messages, only the accesses in the virtual classrooms were considered.
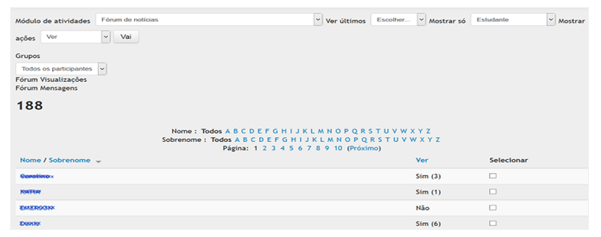
Figure 3. Student Accesses in the News Forum
Figure 4 presents the report made available by Moodle, regarding the participation of students in the activities of the questionnaire type, of a specific room in which the teacher/tutor acts.
Table 4 presents an overview of students’ participation in Questionnaire-type activities in the three virtual classrooms, under the responsibility of tutor “A”.
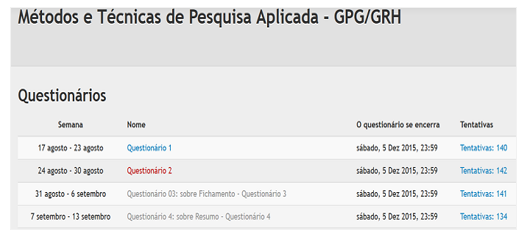
Figure 4. Participation of students in the activities of the Questionnaire type
Table 4. Participation of students in the activities of the Questionnaire type
| Activity | MKT | MTA | PO | |||
| Total students: 34 | Total students: 188 | Total students: 95 | ||||
| attempts | (%)participation | attempts | (%)participation | attempts | (%)participation | |
| Quest1 | 28 | 82,3% | 140 | 74,4% | 68 | 71,5% |
| Quest2 | 28 | 82,3% | 142 | 75,5% | 72 | 75,7% |
| Quest3 | 27 | 79,4% | 141 | 75,0% | 77 | 81,0% |
| Quest4 | 23 | 67,6% | 134 | 71,3% | 70 | 73,7% |
| Quest5 | 25 | 73,5% | 121 | 64,3% | 65 | 68,4% |
| Quest6 | 25 | 73,5% | 128 | 68,0% | 67 | 60,0% |
| Quest7 | 21 | 61,7% | 132 | 70,2% | 65 | 63,1% |
| Quest8 | 20 | 58,8% | 128 | 68,0% | 57 | 60,0% |
| Quest9 | 23 | 67,6% | 128 | 68,0% | 60 | 63,1% |
| Quest10 | 21 | 61,7% | 126 | 67,0% | 57 | 60,0% |
| Quest11 | 18 | 52,9% | 121 | 64,3% | 51 | 53,7% |
| Quest12 | 18 | 52,9% | 128 | 68,0% | 51 | 53,7% |
Table 5 presents an overview of the participation of the tutor “A” in the Doubt Forum, in the three virtual classrooms.
Table 5. Participation of tutor “A” in the Doubts Forum
| Discipline | Number of messages posted by students | Number of messages read by tutor | Number of messages commented by the tutor | (%) Participation rate |
| MKT | 15 | 15 | 13 | 86,6% |
| MTA | 48 | 48 | 44 | 91,6% |
| PO | 26 | 26 | 25 | 96,0% |
Table 6 presents an overview of the participation of tutor “A” in the Forum of News, in the three virtual classrooms.
Table 6. Participation of tutor “A” in the Forum of News
| MKT | MTA | PO | |
| Messages posted to the News Forum | 4 | 4 | 4 |
3.3. Analysis of extracted data
It is observed in the study, through Figures 2, 3 and 4, that Moodle allows the extraction of reports of inactive students for more than one period, specified in the system, student participation in forums, activities, however, are not easy interpretation.
The teacher/tutor used the News Forum tool to keep the students informed about the events in the course, such as term of activities, calendar of tests, alerts and also this Forum was used for messages of welcome to the students, however, In the case of tutor “A” only four messages were posted in the News Forum of each virtual room, which is considered little due to the importance of this tool in transmitting information to students. Access to this News Forum is important because it is published relevant topics such as: notices, alerts, important dates, deadlines, etc.
One of the main roles of tutors is to be responsible for explaining and clarifying issues related to the discipline [4]. The tool used for this purpose in the examples presented was the Doubts Forum. In the presented results it was observed that the participation of the teacher/tutor was representative, through the messages posted in the Doubts Forum, in the sense of commenting them, the participation of the students was not significant, according to the number of messages posted by them.
In this study, the teacher/tutor offered twelve evaluation questionnaires during the course and, through the BOX Activities, was able to extract information on how many attempts were made in each questionnaire, but difficult to interpret.
The monitoring of the actions in Moodle becomes very laborious for both the teacher/tutor and the manager since it is necessary that these monitoring must be done in each virtual classroom in which the tutor acts, in isolation, for later the information be grouped and provided an overview of the actions.
The same deficiency of the environment is verified for the environment manager and learning processes, which does not have a way to obtain a visualization of the actions of the teachers / tutors in a global way, grouping all the virtual rooms under their responsibility, being necessary that they access each Virtual room in isolation and extract the information of your interest.
A competent tutorial action could minimize many flaws in this process of teaching and learning, and allow the manager to make decisions regarding the faculty during the course, so it is interesting that:
- The teacher/tutor is monitored weekly through access statistics in virtual rooms;
- Messages are posted in the News and Doubts Forums;
- Evaluation activities are posted weekly, such as: questionnaires, online tasks, file submission task and discussion forums.
4. Monitoring tool for students and teachers/tutors
A Fag tool was developed integrating 2 software: BI Pentaho and Qlik Sense Cloud. Integrated into the Moodle LMS and this tool is responsible for generating analytic and consolidated reports that show a transversal view of all system’s actors (students and teachers/tutors) and the interaction between these actors with the system. It is important to notice that this is the main contribution of the tool: provide a wide and transversional vision system’s vision. Figure 5 shows the architecture of the FAG Tool.
From these reports, it is expected that:
- The teacher/tutor can act quickly and efficiently in his / her role of motivating and stimulating student participation;
- distance-learning environment and process managers improve the time in decision making regarding the faculty and can achieve better results in distance-learning.
4.1. Fag Tool Architecture
Figure 5 shows the architecture of the developed FAG tool. The data source used is MySQL, extracted from Moodle LMS, which represents the data layer. In this layer, it was necessary to move the useful data for the generation of reports and dashboards to an intermediate data repository called the data warehouse (DW), this process is called ETL (Extraction, transformation and load). Performed through the Pentaho BI tool and scheduled to run in the D-1 period, updating the DW always with the data from the previous day.
From DW, the software Pentaho BI and Qlik Sense Cloud were used to generate the analytical reports and dashboards presenting a holistic and transversal view of the participation of students and teachers/tutors LMS Moodle.
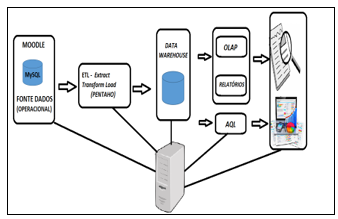
Figure 5. Fag tool architecture
4.2. Partial result
In this section, it will be presented some analytical reports generated by the tool, in addition to the dashboards, all with a holistic and transversal view. Figure 6 presents the percentage participation report of students linked to the courses of the selected teacher/tutor.
The system manager selects the desired teacher/tutor, the related courses are listed with the number of students enrolled, the number of active students and consider as active the students who accessed the course in the last 30 days and calculated and displayed the % of student participation in each course.
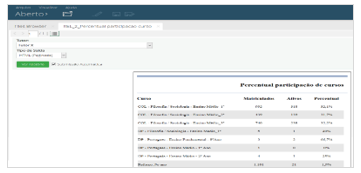
Figure 6. Percentage of student participation report
Figure 7 presents the report with the participation percentage of students in the weekly activities proposed by the teacher/tutor.
The teacher/tutor selects his / her name, the respective courses are listed, the number of students enrolled and the number of students who did not perform any of the weekly activities proposed and is calculated and displayed the percentage of effectiveness, that is, percentage of students who Carried out all the proposed weekly activities.
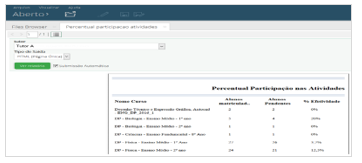
Figure 7.Percentage of participation in weekly activities
Figure 8 presents the report with the percentage of students who have, never attended the course.
The teacher/tutor selects his / her name, lists the respective courses linked to him/her with the number of students enrolled, the number of students who have never attended the course, it is calculated and displayed the percentage of students who never attended the course and in sequence Are listed name and email of students who have never attended the course, if the number of students they have never accessed is greater than zero.
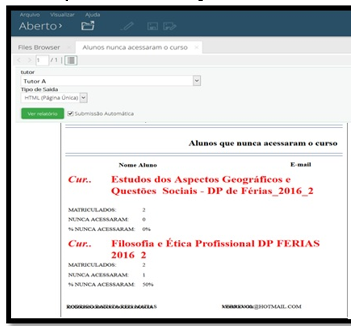
Figure 8.Percentage of students who have never attended the course
Figure 9 shows the report with the total time of access of the teacher/tutor.
The system manager selects the desired teacher / tutor and the month, the corresponding teacher / tutor courses are listed with the days of the week and the time in hours, minutes and seconds, which the teacher / tutor has connected to each course linked to his or her profile in that selected month.
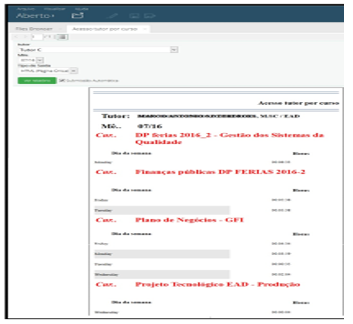
Figure 9.Total time of teacher/tutor access
Figure 10 presents to the system manager a dashboard with the total number of students enrolled in Moodle LMS (Qtd. Students), users in the role of teachers / tutors and the registered courses, as well as a graph that shows the students who have accessed the courses for teachers / tutors in the last 30 days.
Through queries that use AQL technology, a specific teacher/tutor can be selected and information automatically updated according to the courses linked to that teacher/tutor, according to Figure 11.
Through the Tutor dimension, the courses are related to the selected teacher/tutor (Tutor A), the number of students enrolled in the courses linked to it (144), and the graph with the number of students who have accessed the courses in the last 30 days and the list of names, e-mail and courses of the respective students.
In addition to the selection of the teacher/tutor, one can select a specific course linked to it, consequently, the information will be updated, as shown in Figure 12.
According to Figure 12, the vision for the COURSE dimension is presented and it can be observed that in the Course “COL – Filosofia / Sociologia – Ensino Médio_1_2016 “ selected, of the teacher/tutor “Tutor B”, 290 students are enrolled and of these students 246 attended the course in the last 30 days, therefore, they are considered active.
In addition to the selection of teacher/tutor and courses, the tool also allows verifying the accesses in the course linked to the teacher/tutor, through the selection of the access date (s), according to Figure 13.
This shows the number of students who have accessed the selected course linked to the teacher/tutor on that specific date (s), in addition to the students’ names and emails. The result is also displayed in graphic form.
The Forums view illustrated in Figure 14 shows the percentage of students who accessed the Doubts and News Forums through the FORUMS dimension.
The view with the dimension QUESTIONS selected shows the percentage of students who accessed the Doubts Forums.
The vision with the NEWS and COURSE dimension selected presents the percentage of students who accessed the News Forum in the selected course.
The view News Forum with the dimension STUDENT selected presents the courses in which “Student A” is linked and the percentage of accesses in the News Forums in each course.
The view with the dimension QUESTIONS and COURSE selected presents the percentage of students who accessed the Doubts Forum in the selected course.
The Forums view with NEWS dimension selected shows the percentage of students who accessed the News Forums.
The view Forum of Doubts with the dimension STUDENTS selected presents the courses in which “Student A” is linked and the percentage of accesses in the Doubt Forums in each course.
The Tutor Management view presents the average time of access of the teachers/tutors to the courses in Moodle LMS.
The tool also presents the general average time of access of the teachers/tutors to the courses per day of the week or the general average time of access of the teachers/tutors to the courses when selecting the name of the tutor in the dimension TUTOR.
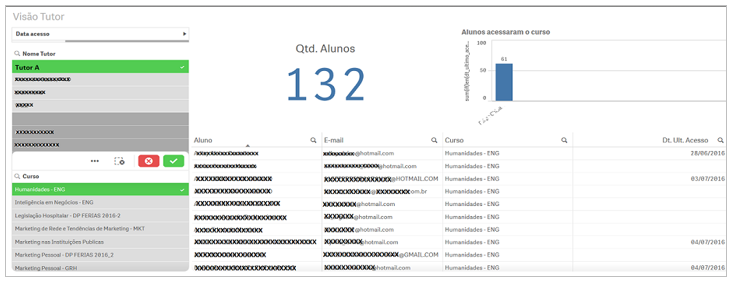
Figure 10. Vision of the participation of the students linked to the courses in Moodle LMS
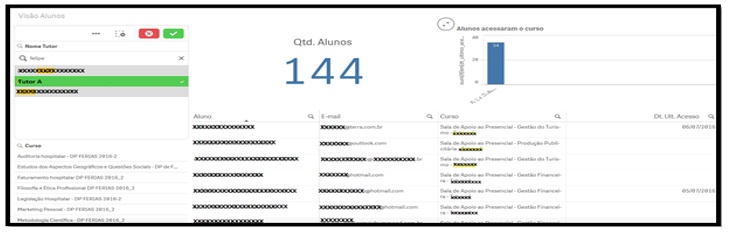
Figure 11.Participation of students through selection of a teacher/tutor
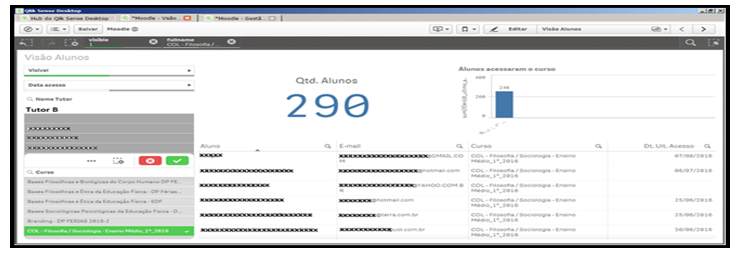
Figure 12.Participation of students in selection of a teacher/tutor and course linked to him/her
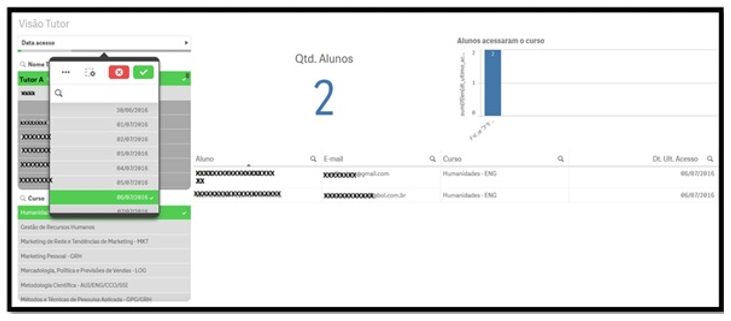
Figure 13.Participation of students in selection of a teacher/tutor, course linked to him and date (s) of access
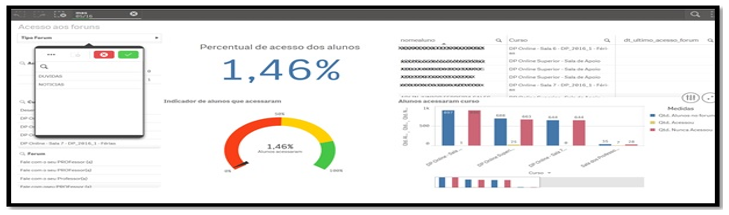
Figure 14.View Forum Leaders
5. Conclusion
In this study was present some Moodle LMS’s tools showing that they do not provide resources to the teacher/tutor to efficiently monitor the participation of the students and nor does it provide the tools necessary for educational process managers to monitor the actions of teachers/tutors in all activities that are involved.
The work also presents a tool – FAG that provides reports, through the use of BI techniques, to automatically generate analytical and consolidated views and necessary dashboards for both the teacher/ tutor in relation to student participation as well as the system manager in relation to the actions of the teachers/tutors, simultaneous in all the courses or rooms linked to them in Moodle LMS.
The FAG tool, integrated to Moodle LMS, provides information in a very simple and fast way, minimizing the time needed to obtain meaningful information and thus facilitating the interpretation work of the teachers/tutors, through the holistic and transversal view.
Using the FAG tool, teachers/tutors are able to verify the participation of the students in activities of the Questionnaire type, in Forums of doubts and news, as well as access to the courses. By using this information, it is possible to stimulate students participation, motivating them and reducing the level of avoidance and dropout.
The managers, through the reports offered by the FAG tool, are able to monitor the actions of teachers/tutors, identifying their participation in many activities like Forums of doubts, publication of activities, time of access to the courses and interaction with students.
The FAG Tool assists teachers/tutors in the follow-up of students’ participation in the courses related to them and also supports the LMS’s managers in the decision making in a timely and assertive way, improving the management process in LMSs systems.
6. Future Work
As future work, it is suggested to create plug-ins in Moodle LMS to be added to the LA resources offered by the platform. In addition, it is suggested the creation of a parametric measurable tool that will allow the generation of the visualizations in any LMS, through the creation of scripts that use parameters, thus to be able to feed the DW with the necessary information.
- L.S. Zapparolli, I. Stiubiener. “Management support tool in virtual learning environments using moodle as a case study.” Learning Objects and Technology (LACLO), Latin American Conference on. IEEE, 2016.
- V. Bremgartner, J.F. De Magalhães Netto, C. S. De Menezes. Adaptation resources in virtual learning environments under constructivist approach: A systematic review. In: Frontiers in Education Conference (FIE), 2015. 32614 2015. IEEE. IEEE, 2015. p. 1-8.
- S. B. Affonso; E. Quinelato. Educação a Distância: Algumas Considerações a Respeito do Autogerenciamento da Aprendizagem pelos Estudantes. EAD em FOCO, v. 4, n. 2, 2014.
- M. L. Belloni. Educação a Distância – 7ª edição. São Paulo: Autores Associados, 2015.
- G. Rumble. A gestão dos sistemas de ensino a distância. Ed. da UnB, 2003.
- A. Clementino. “Gestão pedagógica de cursos em EAD online.” Acessível em: http://www. abed. org. br/congresso2005/por/pdf/041tcc5. pdf (2013).
- A.H.G.Rêgo, A.V.Gomes, M.Lucena and A.C.Brito. Um módulo gerador de relatórios no auxílio às atividades docentes no Moodle. Anais do XXII SBIE-XVII WIE, 2011.
- A. M. R. Almeida, S.S. Camargo. Aplicando Técnicas de Business Intelligence sobre dados de desempenho Acadêmico: Um estudo de caso. XI Escola Regional de Banco de Dados. Caxias do Sul-RS, 2015.
- R.R. Gonçalves. “Integração de Dados na Prática.” São Paulo: Érica (2012).
- E. Turban, R.Sharda, J.E.Aronson. Business Intelligence: um enfoque gerencial para a inteligência do negócio. Bookman Editora, 2009.
- V.V. dos Santos. Data Warehouse: análise da performance de ferramentas de ETL.2013. 52 f. Monografia (Especialização) – Curso de Especialização em Engenharia de Projetos de Software, Universidade do Sul de Santa Catarina, Florianópolis, 2013. Cap. 7. Disponível em <http://www.uniedu.sed.sc.gov.br/wpcontent/uploads/2013/10/Valdinei-Valmir-dos-Santos.pdf>. Acesso em: 10 fev. 2016.
- A. Bentes. TI Update: A Tecnologia da Informação nas grandes empresas. Rio de Janeiro: Brasport, v. 2, 2008.
- L. M.M. Giraffa. Recursos De Learning Analytics Para Compor Indicadores Auxiliares Na Avaliação Dos Estudantes. Revista EmRede, v. 2, n. 2, p. 32-43, 2016.
- M. Á. Conde and Á. H. García. A promised land for educational decision-making?: present and future of learning analytics.”Proceedings of the First International Conference on Technological Ecosystem for Enhancing Multiculturality. ACM, 2013.
- L. Johnson, R.Smith, A.Levine and K.Haywood. The 2010 Horizon Report. New Media Consortium. 6101 West Courtyard Drive Building One Suite 100, Austin, TX 78730, 2010.
- O. Petropoulou, K Kasimatis, I. Dimopoulos and S. Retalis. LAe-R: A new learning analytics tool in Moodle for assessing students’ performance. Bulletin of the IEEE Technical Committee on Learning Technology, v. 16, n. 1, p. 1, 2014
- A. Marinheiro, J. Bernardino. Experimental Evaluation of Open Source Business Intelligence Suites using OpenBRR. Latin America Transactions, IEEE (Revista IEEE America Latina), v. 13, n. 3, p. 810-817, 2015.
- J. Nascimento, G.B.Paulus, D.L.V.G.Rubert and R.L.Antoniazzi. “Comparação da eficiência de bancos de dados relacionais como datawarehouse em um contexto de business intelligence”. Revista interdisciplinar de ensino, pesquisa e extensão, v. 3, n. 1, 2016.
- E. Reis, F. Teixeira, M. A. Araújo. Implementando uma solução de Business Intelligence com o Microsoft SQL Server 2005–Parte 1. SQL Magazine, Rio de Janeiro, n. 59, p. 52-66, 2009.
- QLIKVIEW: conheça a ferramenta de B.I. Disponível em: <http://www.devmedia.com.br/qlikview-conheca-a-ferramenta-de-b-i/30123>. Acesso em: 15 ago. 2016.
- IN. Inteligência em Negócios. Disponível em: <http://www.in1.com.br/qlik-sense> . Acesso em: 15 ago. 2016.
- Ping-Tsai Chung and Sarah H. Chung. “On data integration and data mining for developing business intelligence.” Systems, Applications and Technology Conference (LISAT), 2013 IEEE Long Island. IEEE, 2013.