Modelization of cognition, activity and motivation as indicators for Interactive Learning Environment
Modelization of cognition, activity and motivation as indicators for Interactive Learning Environment
Volume 2, Issue 3, Page No 520-531, 2017
Author’s Name: Asmaa Darouicha), Faddoul Khoukhi, Khadija Douzi
View Affiliations
Computer Laboratory of Mohammedia (LIM), Faculty of Sciences and Technology Mohammedia (FSTM), Hassan II University of Casablanca, 20650, Mohammedia, Morocco.
a)Author to whom correspondence should be addressed. E-mail: asmaa.darouich@gmail.com
Adv. Sci. Technol. Eng. Syst. J. 2(3), 520-531 (2017); ![]() DOI: 10.25046/aj020367
DOI: 10.25046/aj020367
Keywords: Cognition, Activity, Motivation, Navigation traces

Export Citations
In Interactive Learning Environment (ILE), the cognitive activity and behavior of learners are the center of the researchers’ concerns. The improvement of learning through combining these axes as a structure of indicators for well-designed learning environment, encloses the measurement of the educational activity as a part of the learning process. In this paper, we propose a mathematical modeling approach based on learners actions to estimate the cognitive activity, learning behavior and motivation, in accordance with a proposed course content structure. This Cognitive indicator includes the study of knowledge, memory and reasoning. While, activity indicator aims to study effort, resistance and intensity. The results recovered on a sample of students with different levels of education, assume that the proposed approach presents a relation among all these indicators which is relatively reliable in the term of cognitive system.
Received: 05 April 2017, Accepted: 12 May 2017, Published Online: 01 June 2017
1 Introduction and Purpose
In Interactive Learning Environment (ILE) the evaluation of learners is based on interactions analysis when accessing e-learning systems.
Several studies [1, 2, 3] look into calculation and deduction of indicators from analysis of interaction traces, in order to extract meaningful information about the learner activity and behavior, this allows tutors to observe, assess and regulate the activities of learners .
To some extent, the choice of data to analyse mainly depends on the objectives of observation, supposedly with individual or collective character, using quantitative or qualitative value, knowledge’s study. The use of extracted knowledge from traces has enabled the development of several sectors such machine learning, artificial intelligence, e-learning and e-commerce. A concept that turns more and more to realization in real time [4, 5]. In fact, exploring traces as a background information identifies learners’ navigation paths and reconstruct their activities. [6] demonstrate the relevance of navigation in systems oriented toward the elderly, indicating that linear navigation is more suitable for these users, through comparing two designs of the same email Web application with linear and hypertextual navigation styles. However, the use of traces is a common approach by focusing on the processing on digital traces; just a few works involves another kind of traces in this aspect of the research. [7] propose a system that evaluates the activity of learners using log files data, based on four indicators; classification indicator of learners based on their activity (weekly), indicator of activity of each learner throughout the course (weekly), learner classification indicator according to their performance (for each event) and performance indicator of each learner.
The active involvement of learners in their learning process can be reinforced by a meta-cognitive regulation strategy by alternating learning with repeated tests of their knowledge [8]. [9] propose that the computer support provided to the tutor enable him/her to follow up individually a collective activity in which the learner is engaged. In complicated learning conditions, learners have an increased commitment to learn with increased cognitive effort that would paradoxically result in more sustained attention [10, 11]. The voluntary efforts
of the learner result in the acquisition of knowledge, however the quality of learning returns with added value, which positively influences cognitive performance.
Effort, or as [12] call, motivational excitement, occurs only if a number of conditions are met. First, there should be expectation that some behavior will lead to some desirable outcome values (task incentive). Secondly, the behavior must be difficult but considered to be at its capacity and justified by the potential gain. A concept that is very close to mental effort is the mental load [13].
The effort is expected to be associated with cognitive processes reflected by the Electroencephalography measurements. Where cerebral activity in default mode [14, 15] and cortical inhibition [16, 17] suggests that this measure reflects different levels of effort, with a high alpha for low effort levels. The human cognitive system is a complex processing device capable of acquiring, conserving, processing and transmitting information. Cognition improves gradually from birth through the interactions of the child with his/her environment. Cognitive development appears punctuated by acquisitions that are necessary for the establishment of subsequent cognitive processes. Actually, cognitive science has identified four key factors for learning: attention, active learner engagement, feedback and consolidation [18]. These four factors are based on the functioning characteristics of the cognitive system and are deeply rooted at an early age.
On the basis of the [19] model, the cognitive architecture underlying the learning phenomena consists of working memory and long-term memory. In neuroscience, memory is defined as the ability to acquire, retain and restore information. Stimulated by more than a century of neuropsychological study, researchers have come to distinguish these forms of memory. Maintaining a certain amount of memory in short-term memory would eventually allow it to be transferred into long-term memory for more sustainable storage. This process would be facilitated by mental work of repetited information , hence the expression ”working memory” [20]. The working memory can be defined as the temporary maintenance and the manipulation of information during the realization of cognitive spots. However, longterm memory can be seen as an adaptive function of the human being to his cultural, social and emotional environment [21].
Knowledge is an element of our memory that allows us to recognize the world around us, to interpret, to understand our environment, but also to act on it. Knowledge is mainly evaluated in the form of a simple reminder or through comprehension activities. In the didactic of learning environments, knowledge given to be study always comes from an institutional demand and what individuals have to build are knowledge that will enable them to analyze a situation or to allow an action.
When designing a pedagogical scenario, knowledge derived from the psychology of learning, [22] presents human knowledge by categorizing it into six different formats, these formats corresponding to particular learning processes. Contrary to the proposal of [23], which updated the taxonomy of Bloom, these authors do not establish any hierarchy between the different knowledge formats and even consider that some knowledge does not exist according to certain formats.
Based on the idea that cognition groups together the various mental processes of perception, memorization and reasoning, [24] made an important contribution when it differentiates four types of cognitive reasoning: deductive reasoning, inductive reasoning, abductive reasoning and reasoning by analogy. However, reasoning takes the form of a cognitive process to produce a conclusion based on premises. The studies conducted in the cognitive psychology help to structure behavioral models. However, the analysis of interactions provides a large amount of data approach that identify the motivational aspect as a point that cannot be detached from cognitive and activity aspect of learner. The number of definitions of the motivation term is almost a large topic. This happens because motivation represents a hypothetical construct and not a material entity, which means that we use observable manifestations to infer a state of motivation.
This paper is an extension of work originally reported in Proceedings of the 11th International Conference on Intelligent Systems: Theories and Applications (SITA). Thereby, we expose firstly the methodology of structuring a course content on which we base our modeling indicators approaches [33]. Secondly we modeled cognition [34], activity and motivation [35] indicators also approached in [36], by addressing their structure that use navigation traces on a learning session, likewise as a concept of procedures integrated in the adaptive learning content system we named S-CAMO. Developing those approaches complete studies that use simpler types of indicators [1, 2, 3], which is not sufficient to reflect the learner profile in a general way. The last section expose the statistical validation of the proposed indicators modeling.Motivation is not a skill, but a state of mind influenced by internal and external factors to the individual. [25] defines it as ”the orientation of the conduct, the efforts deployed and finally the persistence of this effort over time”. In a psychological perspective, [26] emphasizes the characteristics of the environment in which behavior is manifested: motivation is defined as the set of ”physiological and psychological processes responsible for initiation, maintenance and cessation behavior and the appetitive or aversive value conferred on the elements of the environment on which this behavior is exercised ”. The work environment is likely to influence motivation, and also the work environment of the worker and, more specifically, the social beliefs of the employee [27]. The work of [28] on the theory of objectives setting establishes that an individual is motivated when he is working towards a clear, challenging and meaningful objective for which he will have a feedback. The proponents of the theory of self-determination, on the other hand, consider that the individual is motivated by the needs of social belonging, competence and autonomy, which would be the most decisive need [29]. The theory [30] relates motivation to three variables: valence (value attributed to the result), instrumentality (relation between performance and retribution) and expectation (results) which combined, can induce motivation. On the other hand, analysing resistance to learn is directly observable at a large scale as some students fail assessments on a course. [31] suggests, that this resistance manifests through a reduction in motivation, suggested by lateness or absence from sessions, or a reduction in participation in group exercises and discussions. The individual learning resistance is linked to his/her defense mechanisms as a set of actions that purpose to the reduction or elimination of any change in relation to the integrity and stability of his/her biopsychic [32].
2 Educational collections for course structure
Conceiving a flexible learning content toward learner profile with his different needs requires and includes structured components.
We propose an educational collections Ct that offer the possibility of being redesigned under different personalization in proportion to the same degree of subordination of the collection to form a semantic model of dynamic content.
Following the conceptualization of a structured educational content (”As shown in Algorithm 1”), educational collections can be one of four types; A course Cri ”(2)”, a chapter Chj ”(3)”, a unit Uk ”(4)” or an educational component Cpth ”(5)” as a pedagogical concept Cph or a pedagogical activity Aph.
2.1 Pedagogical objective
The pedagogical objective OCt ”(1)” of a collection is conceptualized from the objective to learn dimension Ld and the junction of the cognitive Cd with the knowledge Kd dimensions (”As shown in Figure 1”).
OCt = {Ld, Cd, Kd} (1)
Algorithm 1: Structuring pedagogical content
| 1: for Create | |||
|
Cri ∈ [Cr1 ···Crl] do |
(2) | ||
| 2: | Assigning the Objective OCri | ||
| 3: | for Create | ||
| do | Chj ∈ [Ch1 ···Chs] | (3) | |
| 4: | Assigning the Objective OChj | ||
| 5: | for Create | ||
| do | Uk ∈ [U1 ···Uc] | (4) | |
| 6: | Assigning the Objective OUk | ||
| 7: | for Create | ||
| do | Cpth ∈ [Cpt1 ···Cptn+m] | (5) | |
| 8: | Assigning the Objective OCpth | ||
| 9: | end for | ||
| 10: | end for | ||
| 11: | end for | ||
| 12: end for | |||
|
13: Pedagogical content with a dynamic and modular structure 14: OCri = {OChj }j∈[1···s] = {OUk }k∈[1···c] = |
|||
{OCpth}h∈[1···n+m]
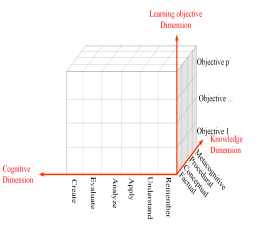 Figure 1: Pedagogical objective
Tutors create educational collections with taking into account the progress of the objectives to acquire throughout the learning process (”As shown in Algorithm 1”). By means of joining to each collection a learning objective, however, for each one is assigned one of the 24 levels (”As shown in Table 1”) arranged by the junction of the knowledge type and the cognitive process identified in the revised Bloom Taxonomy [23]. Each level is represented by the coefficient P d(Ct) (”As shown in Table 1”) which we propose is equal to the product of the value of the
knowledge type {1..4} and the value of the cognitive process {1..6} compared to all levels of the taxonomy. Table 1: Coefficient of learning objectives
| P d(Ct) | ||||
| (1)Remember | 1/24 | 2/24 | 3/24 | 4/24 |
| (2)Understand | 2/24 | 4/24 | 6/24 | 8/24 |
| (3)Apply | 3/24 | 6/24 | 9/24 | 12/24 |
| (4)Analyze | 4/24 | 8/24 | 12/24 | 16/24 |
| (5)Evaluate | 5/24 | 10/24 | 15/24 | 20/24 |
| (6)Create | 6/24 | 12/24 | 18/24 | 24/24 |
3 Modeling Cognitive, activity and motivation indicators
In the framework of developing Cognitive, Activity and Motivation aspects of learners, deduced from navigation traces and consulting concepts presented in course content. As a fundament of an adaptive learning content, we detail these indicators that are updated each time the learner progresses and pass his unit test.
CUk , AUk , MUk (6)
3.1 Navigation traces
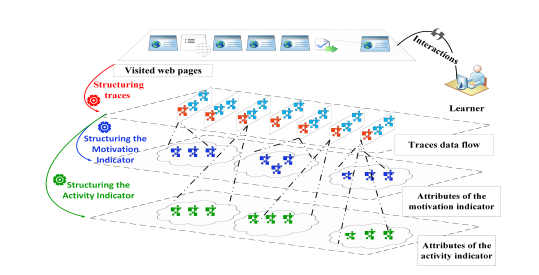
The navigation traces are collected in the form of a web browsing data, the flow of these interactions data reflects the interaction of a learner (”As shown in Figure 3”).
A trace T rk(ti) in a learning session with an index k regroups all interactions data captured at every time of consultation ti, it is characterized by; t: Duration of learning a unit.
N: Total number of traces visited when learning a unit. fT rk(ti): Frequency of consultation of an interaction trace.
dT rk(ti): Duration of an interaction trace.
3.2 Cognitive indicator
The cognitive activity indicator ”(7)” for a learner at a given unit is a component defined by a 3−tuple of explanatory variables related to that unit.
CUk = (DknowledgeUk ,DmemorizingUk ,DreasoningUk ) (7)
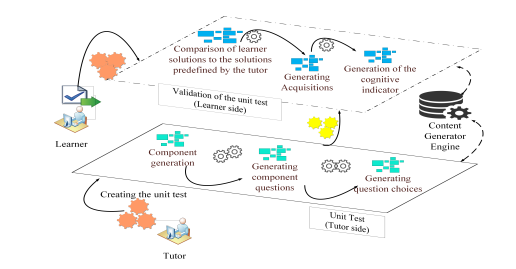
DknowledgeUk : The knowledge degree is calculated after the learner accessed and proceeded to a unit as well as having passed this unit test T Uk (”As shown in Figure 2). Indeed, a unit test is a transit from one unit to another in order to ensure the assimilation of the pedagogical objectives and knowledge presented to the learner related to each pedagogical component of this unit (”As shown in Algorithm 2”). However, the calculation of knowledge acquisitions follows a linear process in the learning activity.
Algorithm 2: Processing the level of knowledge
{DknowledgeUk }
1: for each Uk ∈ [U1 ···Uc] do
2: for each [Cpt1 ···Cptn+m] do
3: for v0 questions QiCpth associated with the pedagogical component Cpth. Each acquisition AqCpth of this pedagogical component Cpth is linked to a vector [1..v0] ⊂ [1..v] of questions
Cpth
Qi . do
4: if Pv10 R(QiCpth) ≥ v20 , with R(QiCpt) as answers given by a learner then
5: AqCpth = 1, Cpth is acquired.
6: else if
7: then AqCpth = 0, Cpth is non acquired.
8: end if
9: end for
10: end for
D = Pn1+mAqCpth
11: Calculate knowledgeUk n+m ,
DknowledgeUk ∈ [0,1].
12: if Pn1+mAqCpth ≥ (n+2m). then
13: T Uk is assessed validated with stateDknowledgeUk = acquired and learner is redirected to unit Uk+1. 14: else if
15: then T Uk is assessed not validated with stateDknowledgeUk = non − acquired and the learner is redirected to the same unit Uk.
16: end if
17: end for
18: Save the learner degree and state of knowledge
{DknowledgeUk ,stateDknowledgeUk } .
DmemorizingUk : The memorization degree is the quantification of memorized knowledge in a unit Uk. This degree represents the sum of the acquisitions multiplied by the coefficient of objective of a pedagogical component to which they correspond, divided by the number of acquisitions to be acquired (n+m) for each unit (”As shown in Algorithm
3”).
Algorithm 3: Processing the memorization degree
{DmemorizingUk }
|
|
1: for each Uk ∈ [U1 ···Uc] do
2: for each [Cpt1 ···Cptn+m] do
3: for All acquisitions AqCpth of a pedagogical component Cpth do
4: Calculate DmemorizingUk =
Pnh=1+mAqCpth×P d(Cpth)
Pnh=1+mP d(Cpth)
5: end for
6: end for
7: end for
8: Save the degree of memorization {DmemorizingUk }
DreasoningUk : The reasoning degree refers to the ability of an effective knowledge understanding, proposed on a unit Uk, it represents the sum of all
Cpt the given answers R(Qi ) multiplied by their logical reasoning coefficient divided by the total number v of questions present in the unit test T U (”As shown in Algorithm 4”).
Algorithm 4: Processing the reasoning degree
{DreasoningUk }
1: for each Uk ∈ [U1 ···Uc] do
2: for each [Cpt1 ···Cptn+m] do
3: for each {QiCpth}i∈[1..v] , where R(QiCpth) is
Cpth the learner’s answer to the question Qi do
Cpth
4: if ∃ dependence between Qi and
Cpth
Qi−1 then
Cpth Cpth
0, R(Qi ) = 0&R(Qi−1 ) = 0
Cpth | QCpth) = 1 Cpt
P (Qi i−1 2, R(Qi h) = 1&R(QiCpt−1h) = 0
Cpth Cpth
1, R(Qi ) = 1&R(Qi−1 ) = 1
(8)
| 5: else if @ dependence between Qi h | |
|
Cpt and Qi−1h then 6: |
|
|
Cpth Cpt P (Qi h | QiCpt−1h) = 0, R(QiCpth) = 0 1, R(Qi ) = 1 7: end if |
(9) |
| 8: Calculate DreasoningUk | = |
Cpt
R Cpt Cpt (QiCpth)∗P (QiCpth|QiCpt−1h)
| where | v | |
|
Cpt 0, P (Q1 ) = 1, 9: end for 10: end for 11: end for |
Cpt R(Q1 h) = 0 Cpt R(Q1 h) = 1 |
(10) |
| 12: Save the reasoning degree {Dreasoning }. | ||
Uk
3.3 Activity indicator
The activity indicator ”(11)” measures the degree to maneuver learning on a given unit. It is a component defined by 3 − tuple of explanatory variables linked to this unit (”As shown in Figure 3”).
AUk = (ResUk , IntUk , Ef rUk ) (11)
ResUk : Resistance to learn expresses the difficulty of learning all the pedagogical objectives presented in a unit.
P
j∈[1..N]fT rk(ti)(j) ∗
ResUk = N dT r2 k(ti)(j) (12)
|
|
IntUk : Learning intensity expresses the intensity to learn all the pedagogical objectives presented in a unit.
IntUk = N/t (13)
Ef rUk : Learning effort expresses the effort to learn all the pedagogical objectives presented in a unit.
Ef rUk = P d(Uk) ∗ ResUk ∗ IntUk 2 ∗ t (14)
3.4 Motivation indicator
The motivation indicator ”(15)” measures the degree of motivation in learning all the pedagogical objectives presented in a unit (”As shown in Figure
3).
MUk = X P d(Uk) ∗ fT r(ti)(j) ∗ dT r(ti)(j) (15)
N t
j∈[1..N]
4 Method
The perplexity of the proposed indicators modelization, depends on the reliability of the proposed scale. In fact, we implemented all procedures of our approach in an adaptive learning content system we named S-CAMO.
4.1 Learning environment
The system S-CAMO comprises the module ”web navigation tracker” which is an extension that retrieves the data of navigation on the Internet between the time of the connection and the disconnection to the system. This extension will appear as an icon in the browser’s menu bar, where the learner will have to enter his username and password and then log in. If the learner exists in the database, then the profile (Learner name, learner identifier) will persist in the local storage of ”Google Chrome”. However, just after installing this extension, authentication will remain active as long as the learner does not choose to disconnect manually. This extension detects and traces access to any web page in any open tab of the browser ”Google Chrome”, as well as verifies the learner’s adhesion to each learning session opened in the platform, through the validity of its domain name. The extension sends the navigation or interaction data to the web server.
4.1.1 Interception of navigation data
For each successful authentication of a learner, the web service provided by the platform retrieves his identifier (”As shown in Figure 4). However, whenever the learner changes web page (url), the browser adds a new function that will be delegated to the extension level. The process of the new function includes:
- The retrieval of the information of each navigation data which are url, the url parameters (parameter of the request), the title of the web page;
- Testing and verifying the authentication at theplatform, in order to send the information associated with this new intercepted and formulated navigation data.
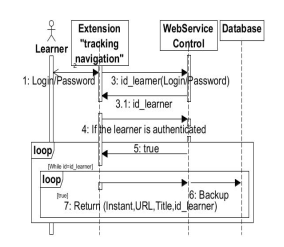 Figure 4: Process of intercepting a navigation trace by ”web navigation tracker” module
4.2 Participants
The sample of learners on which the test was conducted is equal to 50 students, organized into 3 approximately equal groups. The group G1 and G2 contained 17 learners, while G3 contained 16 ones. These learners were heterogeneous in relation to their level of education and had at least an associate degree.
Learners had a laptop, nevertheless, those who could not bring one, had at their disposal laptops or desktop laboratory. For the relevance of the study, we made sure that the module ”web navigation tracker” was installed before the test.
4.3 Materials
We create a course (”As shown in Table 2”) while respecting the learning content structuring described above, also to each educational collection was assigned a pedagogical objective.
All students followed the same course and performed the presented tests unit .
5 Task analysis results
This study recovers values of all indicators’ variables according to the proposed approach, by studying the learners traits.
We have obtained the number of learners who have acquired or not the knowledge concepts presented at level of the chapter Ch1 structure (”As shown in Table 3).
Table 3: Tests unit of chapter Ch1 results.
| stateDknowledgeUk | U1 | U2 | U3 |
| acquired | 34 | 48 | 40 |
| non − acquired | 16 | 2 | 10 |
Table 4: Abbreviation of indicators variables abbreviation variables
DknowledgeUk v1
DmemorizingUk v2
DreasoningUk v3
| ResUk | v4 |
| IntUk | v5 |
|
Ef rUk MUk |
v[1]v7 |
The three groups present approximately the same characteristics with respect to the educational components of the studied chapter. In fact, all groups reflect a strong correlation among the variables of the cognitive indicator relatively to all the tested units. All groups have no resistance to learn in relation to all units except for group G1 who presents moderately a resistance to learn unit U1. All groups have a low intensity to learn relatively all units, however more is the intensity to learn less there is a resistance. The effort to acquire knowledge and to memorize for the group G1 remains average relatively to unit U1 while it is low for groups G2 and G3, however there is no effort to reason for all groups for all units. All groups show moderate resistance linked to the effort to learn the unit U2, however, the group G1 has an effort related to the resistance at unit U1. Unlike group G2 and G3 where resistance is not related to effort. As well as group G3 has a resitance related to the effort at unit U3 while group G2 and G3 where resistance is not related to effort. Intensity to learn is moderately low compared to all units. Motivation is weakly related to the variables of the cognitive indicator, it is moderately linked to the resistance to learn and weakly related to the intensity of work. All groups have a moderately weak relationship between motivation and effort .
Table 2: Structure of Ch1.
| Ct | Cd | Kd | P d(Ct) | Ld |
| Cr1 | Apply | Procedural | 9/24 | Learning HTML and CSS |
| Ch1 | Understand | Conceptual | 4/24 | Learning The basics of HTML and CSS |
| U1 | Understand | Factual | 2/24 | Introduction |
| Cpt1 | Remember | Factual | 1/24 | Definitions and roles |
| Cpt2 | Remember | Factual | 1/24 | Versions |
| Cpt3 | Understand | Factual | 2/24 | Local work |
| Cpt4 | Understand | Factual | 2/24 | The text editor |
| U2 | Understand | Factual | 2/24 | The basics of HTML |
| Cpt1 | Understand | Factual | 2/24 | Proficiency of Elements, tags, attributes |
| Cpt2 | Understand | Factual | 2/24 | Defining Structure |
| Cpt3 | Understand | Factual | 2/24 | Display |
| Cpt4 | Understand | Factual | 2/24 | Indentation and comments |
| Cpt5 | Understand | Factual | 2/24 | Titles and paragraphs |
| Cpt6 | Understand | Factual | 2/24 | Spaces and line breaks |
| Cpt7 | Understand | Factual | 2/24 | Strong, em and mark |
| Cpt8 | Understand | Factual | 2/24 | Listes |
| Cpt9 | Understand | Factual | 2/24 | Internal and external links |
| Cpt10 | Understand | Factual | 2/24 | Other Links |
| Cpt11 | Understand | Factual | 2/24 | Images |
| Cpt12 | Understand | Factual | 2/24 | Validation |
| U3 | Understand | Conceptual | 4/24 | The basics of CSS |
| Cpt1 | Understand | Factual | 2/24 | Selectors, Properties |
| Cpt2 | Understand | Factual | 2/24 | Emplacement |
| Cpt3 | Understand | Factual | 2/24 | Comments |
| Cpt4 | Understand | Factual | 2/24 | Single selectors |
| Cpt5 | Understand | Factual | 2/24 | Id and class |
| Cpt6 | Understand | Factual | 2/24 | Inheritance |
| Cpt7 | Understand | Conceptual | 4/24 | Block vs inline |
| Cpt8 | Understand | Conceptual | 4/24 | Div and span |
Table 5: Correlation matrix (Pearson) for group G1 toward the unit U1.
| Var | v1 | v2 | v3 | v4 | v5 | v6 | v7 |
| v1 | 1 | * | * | * | * | * | * |
| v2 | 0,9763 | 1 | * | * | * | * | * |
| v3 | 0,8089 | 0,7444 | 1 | * | * | * | * |
| v4 | 0,5319 | 0,5314 | 0,4427 | 1 | * | * | * |
| v5 | -0,3943 | -0,3942 | -0,4222 | -0,6701 | 1 | * | * |
| v6 | 0,4221 | 0,4335 | 0,2749 | 0,7679 | -0,0678 | 1 | * |
| v7 | 0,1746 | 0,2400 | -0,0120 | 0,6594 | -0,4728 | 0,4132 | 1 |
Table 6: Correlation matrix (Pearson) for group G2 toward the unit U1.
| Var | v1 | v2 | v3 | v4 | v5 | v6 | v7 |
| v1 | 1 | * | * | * | * | * | * |
| v2 | 0,9417 | 1 | * | * | * | * | * |
| v3 | 0,7276 | 0,5491 | 1 | * | * | * | * |
| v4 | 0,1653 | 0,1883 | -0,0480 | 1 | * | * | * |
| v5 | -0,1236 | -0,1468 | -0,0236 | -0,7593 | 1 | * | * |
| v6 | -0,0340 | -0,0934 | -0,0436 | 0,3459 | 0,2720 | 1 | * |
| v7 | -0,0707 | 0,0112 | -0,1221 | 0,5028 | -0,5128 | -0,1491 | 1 |
Table 7: Correlation matrix (Pearson) for group G3 toward the unit U1.
| Var | v1 | v2 | v3 | v4 | v5 | v6 | v7 |
| v1 | 1 | * | * | * | * | * | * |
| v2 | 0,9465 | 1 | * | * | * | * | * |
| v3 | 0,7899 | 0,6318 | 1 | * | * | * | * |
| v4 | -0,1103 | -0,1054 | 0,0172 | 1 | * | * | * |
| v5 | -0,2860 | -0,2256 | -0,1790 | -0,6800 | 1 | * | * |
| v6 | -0,5034 | -0,3807 | -0,2676 | 0,1603 | 0,5861 | 1 | * |
| v7 | -0,1322 | -0,1718 | 0,1119 | 0,6086 | -0,1038 | 0,3820 | 1 |
Table 8: Correlation matrix (Pearson) for group G1 toward the unit U2.
| Var | v1 | v2 | v3 | v4 | v5 | v6 | v7 |
| v1 | 1 | * | * | * | * | * | * |
| v2 | 1,0000 | 1 | * | * | * | * | * |
| v3 | 0,7787 | 0,7787 | 1 | * | * | * | * |
| v4 | 0,2433 | 0,2433 | 0,0330 | 1 | * | * | * |
| v5 | 0,0835 | 0,0835 | 0,0522 | -0,7769 | 1 | * | * |
| v6 | 0,5768 | 0,5768 | 0,2773 | 0,3029 | 0,2851 | 1 | * |
| v7 | 0,1338 | 0,1338 | 0,0446 | 0,6863 | -0,4735 | 0,1091 | 1 |
| Var | v1 | v2 | v3 | v4 | v5 | v6 | v7 |
| v1 | 1 | * | * | * | * | * | * |
| v2 | 0,9461 | 1 | * | * | * | * | * |
| v3 | 0,9024 | 0,8295 | 1 | * | * | * | * |
| v4 | -0,0795 | -0,1861 | -0,0150 | 1 | * | * | * |
| v5 | -0,0930 | 0,0175 | -0,1375 | -0,5699 | 1 | * | * |
| v6 | -0,1737 | -0,1584 | -0,1821 | 0,4723 | 0,4199 | 1 | * |
| v7 | -0,0322 | -0,1200 | 0,0994 | 0,3538 | 0,2557 | 0,4968 | 1 |
Table 9: Correlation matrix (Pearson) for group G2 toward the unit U2.
| Var | v1 | v2 | v3 | v4 | v5 | v6 | v7 |
| v1 | 1 | * | * | * | * | * | * |
| v2 | 1,0000 | 1 | * | * | * | * | * |
| v3 | 0,8845 | 0,8845 | 1 | * | * | * | * |
| v4 | -0,1224 | -0,1224 | -0,3195 | 1 | * | * | * |
| v5 | -0,2007 | -0,2007 | -0,1233 | -0,3503 | 1 | * | * |
| v6 | -0,2327 | -0,2327 | -0,3430 | 0,4431 | 0,6647 | 1 | * |
| v7 | 0,0947 | 0,0947 | 0,2639 | 0,0348 | -0,4126 | -0,4577 | 1 |
Table 10: Correlation matrix (Pearson) for group G3 toward the unit U2.
| Var | v1 | v2 | v3 | v4 | v5 | v6 | v7 |
| v1 | 1 | * | * | * | * | * | * |
| v2 | 1,0000 | 1 | * | * | * | * | * |
| v3 | 0,8585 | 0,8585 | 1 | * | * | * | * |
| v4 | -0,0124 | -0,0124 | -0,1452 | 1 | * | * | * |
| v5 | -0,1733 | -0,1733 | 0,0944 | -0,7590 | 1 | * | * |
| v6 | -0,3695 | -0,3695 | -0,1906 | 0,3853 | 0,2777 | 1 | * |
| v7 | 0,1702 | 0,1702 | 0,0438 | 0,3602 | -0,1726 | 0,1085 | 1 |
Table 11: Correlation matrix (Pearson) for group G1 toward the unit U3.
Table 12: Correlation matrix (Pearson) for group G2 toward the unit U3.
| Var | v1 | v2 | v3 | v4 | v5 | v6 | v7 |
| v1 | 1 | * | * | * | * | * | * |
| v2 | 0,9201 | 1 | * | * | * | * | * |
| v3 | 0,6952 | 0,5768 | 1 | * | * | * | * |
| v4 | 0,1357 | 0,1553 | 0,0472 | 1 | * | * | * |
| v5 | -0,2563 | -0,2060 | -0,1317 | -0,6814 | 1 | * | * |
| v6 | -0,1320 | -0,0371 | -0,0406 | 0,2194 | 0,5400 | 1 | * |
| v7 | 0,1781 | 0,2682 | 0,1773 | 0,3929 | -0,2815 | -0,0695 | 1 |
Table 13: Correlation matrix (Pearson) for group G3 toward the unit U3.
| Var | v1 | v2 | v3 | v4 | v5 | v6 | v7 |
| v1 | 1 | * | * | * | * | * | * |
| v2 | 0,9317 | 1 | * | * | * | * | * |
| v3 | 0,7830 | 0,6418 | 1 | * | * | * | * |
| v4 | 0,1757 | 0,1825 | 0,1453 | 1 | * | * | * |
| v5 | -0,1821 | -0,2657 | -0,1122 | -0,8190 | 1 | * | * |
| v6 | -0,0332 | -0,0881 | -0,0297 | 0,7285 | -0,2264 | 1 | * |
| v7 | 0,1746 | 0,1418 | 0,0468 | 0,6077 | -0,4340 | 0,5587 | 1 |
an educational content structure which was already implemented and which mobilizes the achievement of the specific estimation of the updated indicators after each pedagogical unit. The results show specifically a high relation among the cognition attributes and a moderatly interrelated linkage among all the studied variables. We assume that the scale we have presented in this paper prove the efficiency of the proposed modelization.
Conclusions and discussion
The many aspects profile of learners serve on adapting their learning environment. However, the lack of holistic measures in learning environment make us propose a compilation of indicators by developing a theoretical conception that include the cognition, activity and motivation in a learning process.The study involve the measurement of the proposed indicators’ structures, it reflects the behavior and trend of learners on processing information in learning interactions. In this context, we develop
- L. S. Settouti, “Systmes Base de Traces Modlises: Modles et Langages pour l’exploitation des traces d’Interactions,” Ph.D Thesis, 2011.
- N. Bousbia, “Analyse des traces de navigation des apprenants dans un environnement de formation dans une perspective de dtection automatique des styles dapprentissage,” Ph.D Thesis, 2011.
- P. T. N. Diem, “Spcification et conception de services d’analyse de l’utilisation d’un environnement informatique pour lapprentissage humain,” Ph.D Thesis, tel-00689025, version 1 – 19 Apr 2012.
- L. France, J.-M. Heraud, J.-C. Marty, T. Carron, and J. Heili, “Monitoring virtual classroom: Visualization techniques to observe student activities in an e-learning system,” In ICALT, 716-720. IEEE Computer Society, 2006.
- E.W. Black, K. Dawson, and J. Priem, “Data for free: Using LMS activity logs to measure community in online courses,” The Internet and Higher Education, 11(2), 65-70, 2008.
- D. Castilla, A. Garcia-Palacios, I. Miralles, J. Breton-Lopez, E. Parra, S. Rodriguez-Berges, C. Botella, ”Effect of Web navigation style in elderly users,” Computers in Human Behavior, 55(Part B), 909-920, 2016.
- Angel A.Juan, T. Daradoumis, S. Caball, F. Xhafa, “SAMOS Project: A data analysis model based on control charts to monitor online learning processes,” Barcelona, Spain, July 2nd, 2008.
- Jeffrey D. Karpicke and Henry L. Roediger III, “The Critical Importance of Retrieval for Learning,” Science, American Association for the Advancement of Science, 319(5865), 966-968, 2008.
- C. Laperrousaz, “Le suivi individual d’apprenants engags dans une activit collective distance : tacsi : un environnement informatique support aux activits du tuteur,” Ph.D Thesis, 1 vol. (295 p.), 2006.
- Franklin M. Zaromb, Jeffrey D. Karpicke and Roediger III, Henry L., “Comprehension as a basis for metacognitive judgments: Effects of effort after meaning on recall and metacognition,” Journal of Experimental Psychology: Learning, Memory, and Cognition, American Psychological Association, 36(2), 552-557, 2010.
- Bjork E. L. and Bjork, R. A., “Making things hard on yourself, but in a good way: Creating desirable difficulties to enhance learning,” Chapter 5, New York: Worth Publishers, M. A. Gernsbacher, R. W. Pew, L. M. Hough & J. R. Pomerantz (Eds.), Psychology and the real world: Essays illustrating fundamental contributions to society, 56-64, 2011.
- Jack W. Brehm and Elizabeth A. Self, “THE INTENSITY OF MOTIVATION,” Ann. Rev. Psychol., Department of Psychology, University of Kansas, Lawrence, Kansas 66045, Annual Reviews Inc., 40, 109-31, 1989.
- A. W. K. Gaillard and C. J. E. Wientjes, “Mental load and work stress as two types of energy mobilization,” Work & Stress, 8(2), 141-152, 1994.
- M. Izzetoglu and S. C. Bunce and K. Izzetoglu and B. Onaral and a. K. Pourrezaei, “Functional brain imaging using near-infrared technology,” IEEE Engineering in Medicine and Biology Magazine, 26(4), 38-46, 2007.
- Laufs, H. and Krakow, K. and Sterzer, P. and Eger, E. and Beyerle, A. and SalekHaddadi, A. and Kleinschmidt, A., “Electroencephalographic signatures of attentional and cognitive default modes in spontaneous brain activity fluctuations at rest,” Proceedings of the National Academy of Sciences of the United States of America,
100(19), 1105311058, 2003. - Brouwer A.-M. and Hogervorst M. A. and Herman P. and Kooi F., “Are You Really Looking? Finding the Answer Through Fixation Patterns and EEG,” Proceedings of the 5th International Conference on Foundations of Augmented Cognition. Neuroergonomics and Operational Neuroscience: Held As Part of HCI International 2009, FAC ’09, 329-338, 2009.
- Van Dijk H. and Schoffelen J.-M. and Oostenveld R. and Jensen O., “Prestimulus Oscillatory Activity in the Alpha Band Predicts Visual Discrimination Ability,” Journal of Neuroscience, Society for Neuroscience, 28(8), 1816-1823, 2008.
- Dehaene S., “Les quatre piliers de l’apprentissage, ou ce que nous dissent les neurosciences,” Ecole des Neurosciences de Paris Ile-de-France / ENP, November, 2013.
- Atkinson R.C. and Shiffrin R.M., “Human memory: A proposed system and its control processes,” K.W. Spence & J.T. Spence (Eds.), The psychology of learning and motivation: Advances in research and theory, New York: Academic Press, 2, 742-775, 1968.
- A. Baddeley, “The episodic buffer: a new component of working memory?,” Trends in Cognitive Sciences, 4(11), 417-423, 2000.
- J. R. Anderson, “Learning and Memory: An Integrated Approach,” Journal of Developmental & Behavioral Pediatrics, New York, NY, John Wiley and Sons, Inc, 17(2), 125-126, 1996.
- M. Musial and F. Pradre and A. Tricot, “Prendre en compte les apprentissages lors
de la conception d’un scnario pdagogique,” Recherche et formation, 68, 15-30, 2011. - D. R. Krathwohl, ”A Revision of Bloom’s Taxonomy: An Overview, Theory Into Practice,” Routledge, 41(4), 212-218, 2002.
- L. Festinger, “A Theory of Cognitive Dissonance,” Stanford University Press, 291, 1957.
- C. Louche, “Introduction la psychologie du travail et des organisations. Concepts de base et applications,” L’orientation scolaire et professionnelle, 37(2), 289-290, 2008.
- J.-M. COQUERY, “Motivation dans Grand dictionnaire de la psychologie,” BLOCH, H., CHEMANA, R. et GALLO, A. (dirs), Paris, Larousse, 480-482, 1991.
- T. Wisner, “Motivation au travail dans les institutions publiques et l’effet des facteurs culturels : une illustration dans le context hatien,” Ph.D Thesis, 2016.
- Edwin A. Locke, “Toward a theory of task motivation and incentives,” Organizational Behavior and Human Performance, 3(2), 157 – 189, 1968.
- E. L Deci and R. M Ryan, “Intrinsic Motivation and Self-Determination in Human Behavior,” Contemporary Sociology, New York: Plenum Pres, 3(2), January 1985.
- Vroom V.H, “Work and motivation,” Wiley Work and motivation, Oxford, England, 1964.
- J. Atherton, “Resistance to learning: a discussion based on participants in in-service professional training programmes,” Journal of Vocational Education & Training, 51(1), 77-90, 1999.
- V. A. Negrii, “Psychological Problems of Learning Resistance,” Procedia – Social and Behavioral Sciences, Volume 86, Pages 116-121, 2013.
- A. Darouich, F. Khoukhi and K. Douzi, “A dynamic learning content pattern for adaptive learning environment,” 2015 10th International Conference on Intelligent Systems: Theories and Applications (SITA), 1-6, 2015.
- A. Darouich, F. Khoukhi and K. Douzi, “A cognitive indicator activity for dynamic learning content pattern in adaptive learning environment,” 2016 11th International Conference on Intelligent Systems: Theories and Applications (SITA), 1-6, 2016.
- A. Darouich, F. Khoukhi and K. Douzi, “Mining fuzzy motivation indicator in learning environment through Human Computer Interaction,” 2013 Science and Information Conference, London, 712-720, 2013.
- F. Khoukhi and M. E. Ammari, “The adaptive learning system with CAM indicators,” 2012 6th International Conference on Sciences of Electronics, Technologies of Information and Telecommunications (SETIT), Sousse, 2012, pp. 114-120.