RFID Antenna Near-field Characterization Using a New 3D Magnetic-Field Probe
RFID Antenna Near-field Characterization Using a New 3D Magnetic Field Probe
Volume 2, Issue 3, Page No 492-497, 2017
Author’s Name: Kassem Jomaa1, a), Fabien Ndagijimana1, Hussam Ayad2, Majida Fadlallah2, Jalal Jomaah2
View Affiliations
1IMEP-LaHC Laboratory, Grenoble-Alpes University, Grenoble, France
2Physics Department – Faculty of Sciences, Lebanese University, Beirut, Lebanon
a)Author to whom correspondence should be addressed. E-mail: kassem.jomaa@imep.grenoble-inp.fr
Adv. Sci. Technol. Eng. Syst. J. 2(3), 492-497 (2017); ![]() DOI: 10.25046/aj020363
DOI: 10.25046/aj020363
Keywords: Near-field Measurements, Magnetic-field Probe, Exposure, Electromagnetic fields, RFID

Export Citations
In this paper the design of a new 3D magnetic field (H-field) probe with a near-field scanning system is presented, then the near electromagnetic fields radiated by a Library RFID system is characterized. The proposed system is developed in order to determine the magnetic near-field emitted by electronic devices. The designed isotropic H-field probe consists of three orthogonal and identical loops each of diameter of 6 mm having 3 turns. The antenna factor of the designed probe is presented for a frequency range from 10 MHz to 1 GHz. The designed probe is tested and validated using a standard passive circuit as a device under test. An RFID reader antenna is also designed and simulated on HFSS (high frequency structural simulator) and the radiated magnetic field, obtained by simulations, is then compared to the real measured one above the fabricated circuit. The obtained levels are checked if they satisfy the European and ICNIRP Electromagnetic Fields Guidelines.
Received: 05 April 2017, Accepted: 24 April 2017, Published Online: 24 May 2017
1. Introduction
The everyday use of devices and systems emitting radio frequency electromagnetic fields is continuously increasing. Some of these devices are operating in the vicinity of human body, in which people are in the near-field region of the radiating source, and they are exposed to electromagnetic fields. Radio Frequency Identification (RFID) systems are used today in wide variety aspects of everyday life. There are wide areas of RFID applications such as: cashless payments, transportation ticketing systems, residential door keys, antitheft protection systems, library systems [1] etc. RFID technologies are intended to recognize or identify remotely placed label on an object, animal or person. The system consists of the reader or RFID antenna and of a label (or tag) composed of a RFID chip and an antenna (e.g. pasted into a book in a library). The label is activated by a modulated electromagnetic wave processed by the reader with an antenna. It returns a signal to reader in one of the frequency bands allocated to the RFID applications: 125 to 150 kHz; 13.56 MHz; 433 MHz; 860 to 960 MHz; 2.45 GHz. The distances covered with systems can reach up to several meters [2].
Due to the development of such applications, there must be a study on the relationship between the exposure to electromagnetic fields and the health of humans. Near-field region is an important part that should be analyzed in this study. Even though there are different methods for field mapping, passive detection is always an economical way of measuring vector electromagnetic fields. Various researches have been done in the development and characterization of electric and magnetic probes. In [3] the results of a probe with a CPW fed transmission line in the frequency range of 0.1 to 0.3GHz is presented whereas in [4] a resonance suppressed magnetic field probe which operates in the 1-7GHz frequency band is presented. All these probes measure only one component of the electric or magnetic field at a time. Also, the larger size of these probes reduces the performance by reducing the spatial resolution as the size of the probe is inversely proportional to the spatial resolution of the probe [5].
It is necessary to have all the 3 components of magnetic or electric fields for accurate prediction of radiated emissions [6]. But it requires a large scanning time in order to complete one surface of a printed circuit board during the near field measurements. In [7] three dimensional (3D) near field scanner for IC chip level measurements is proposed. It consists of 3D near field scanner with a magnetic probe head. Two separate magnetic fields probe (to measure normal and tangential component of magnetic field) for measuring three dimensional fields in high frequency planar circuits is proposed in [8]. Still, these methods don’t reduce the scanning time because each component has to be measured separately. In order to minimize the scanning time we propose a 3D scanning system consisting of a near field scanner and a 3D magnetic field probe.
In this work a new 3D magnetic field probe which measures the three components of the magnetic field simultaneously is designed and validated. It is used to measure the three magnetic field components of the radiated emissions from a device under test (DUT), over a broad range of frequencies. The near-field exposure assessment of the radiated field from RFID reader antennas used in Libraries is then studied. An RFID rectangular loop antenna operating at 13 MHz is designed and fabricated. The designed antenna is simulated on HFSS using finite element method (FEM) then the simulations are compared to the real measurements of the magnetic field near the antenna using the designed probe.
2. Probe Design
2.1. Magnetic field Sensors Theory
Electromagnetic field is a combination of two types of quantities: electric and magnetic fields. In the near-field regions they should be both measured since they are not related to each other as in the far-field region. So we have six field components three for each field, each one should be measured separately. In this work we will focus in the magnetic field measurement. Magnetic field passing through a loop generates a voltage across its terminals according to Faraday’s law, which states that the induced voltage is proportional to the rate of change of magnetic flux through a circuit loop:
Each single loop is capable to measure one component of magnetic field. For total magnetic field distribution three orthogonal components Hx, Hy, and Hz must be measured. The overall magnetic field Ht can be determined from the root sum square of these quantities:![]()
2.2. Design Probe
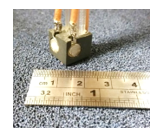
Fig. 1. 3D H-field Probe
The designed 3D H-field probe consists of three orthogonal identical loops combined in a 1×1.2×1.3cm3 plastic cube having their centers at the same plane (Fig. 1). Each loop has 3 turns with radius of 3mm. The terminals of each loop are connected to the channels of the Teledyne LeCroy oscilloscope (which also measures the frequency domain as a spectrum analyzer) through a coaxial cable. The difference between the loop centers was taken into account in post processing. The whole loop structure is attached to the robot arm in the scanning system.
2.3. Probe Calibration
Calibration is a process done to find the probe performance factor which is the antenna factor (AF). It is like a transfer function between the measured voltage across the loop and the magnetic field in the scanned geometry. The calibration of electromagnetic field probes needs to generate a reference field which intensity and spatial configuration are known with good accuracy inside a certain volume where the calibrated probe is placed.
Several probe calibration techniques are available nowadays. Transverse Electromagnetic (TEM) cells [9], waveguides, and also a 50 ohm simple microstrip line can be used.
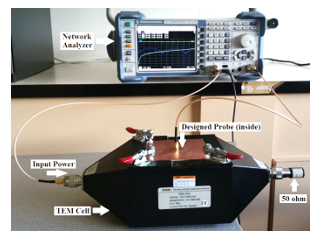
Fig. 2. Calibration Setup
In this work FCC-TEM-JM1 cell was used to produce calculable electric and magnetic field strengths. It operates in the transverse electromagnetic mode, so that both the E and H-field components generated between the septum and outer conductor have the characteristics of a wave propagating in free space. The field strength can be calculated from the dimensions of the cell, its impedance at the measurement plane and the input power as shown in the equations below: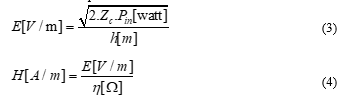
Where is the input impedance of the measuring instrument in ohms
is the input power in watts
is the distance in meters between the septum and the outer conductor of the TEM cell
is the intrinsic impedance of the free space in ohms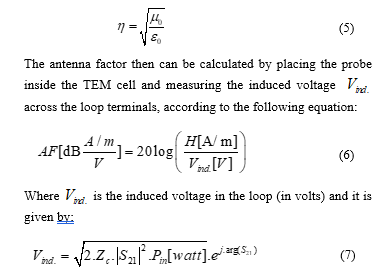
The AF of each loop in the proposed probe is shown in Fig.3 for a frequency range of [10MHz – 1GHz] along with the AF factor of a single loop.
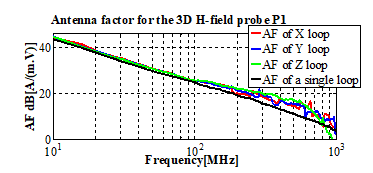
Fig. 3. Measured antenna factor versus frequency for the designed probe
The antenna factor varies from 44 dB(A/m.V) for low frequencies and up to 5 dB(A/m.V) at 1 GHz. Compared to the single loop AF, the antenna factor of each loop in the 3D probe has fluctuations above 200MHz . These are due to the coupling between the individual loops in the 3D probe. This factor is important to know the level of the field above the DUT when using the probe in the near-field measurement system.
3. Scanning System Validation
The 3D scanning system consists of a scanning robot, Teledyne LeCroy WaveRunner 640Zi oscilloscope, PC and the designed 3D H-field probe (Fig.4). The scanning robot is connected with the oscilloscope to the PC. The PC is programmed to control the movement of the robot and the data collection from the spectrum analyzer. The plastic arm of the robot holds the probe above the DUT. The movement of the robot arm can be precisely adjusted to 0.1mm/step by a 3D movable controller system. The output of the probe is connected to the 3 channels of the oscilloscope using coaxial cables. Since there is no preamplifier, the noise floor of the spectrum analyzer limits the measurements to frequencies above 10MHz.
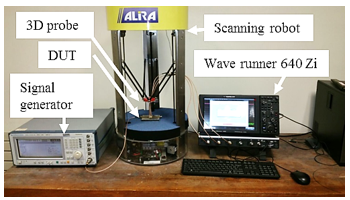
Fig. 4. Measurement System Setup
To validate the test bench, the magnetic near-field of a simple passive circuit used as DUT is measured and then the experimental results are compared to theoretical ones. The electromagnetic field components, depends on the geometrical parameters (Fig. 6) and the injected power of the DUT. A standard circuit that is consisting of a cylindrical conductor above a ground plane is used as the DUT. The DUT is terminated by 50 ohm load at one end and excited by a power of 16dBm by a signal generator at the other end (Fig. 5).
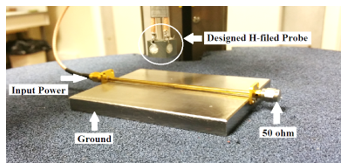
Fig. 5. Standard Validation Circuit
The magnetic field was computed using the expressions of the transverse electric and magnetic field components that are obtained by electrostatic calculation with the use of image theory [10]: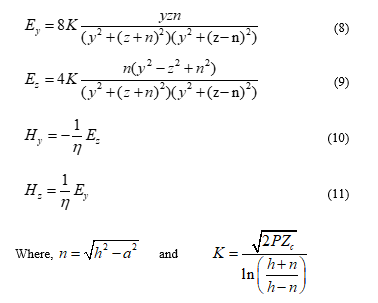
The propagating waves along the cylindrical conductor in the above circuit (Fig. 5) are characterized by a quasi-TEM mode. So we will only measure the transverse components of the magnetic field (Hy and Hz).
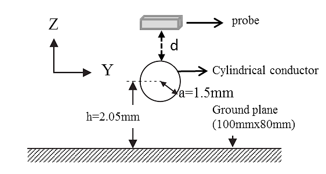
Fig. 6. Geometrical dimensions for the validation circuit
The z-axis is normal to the scanned plane, and the probe moves in the x and y directions measuring the magnetic field radiation from the DUT. Measurements were done at four different highs (4, 6, 8, and 10mm), and the scan was along y-axis with a step of 1mm. The computed theoretical field values are compared with the measured ones and they are presented in Fig. 7 and Fig. 8.
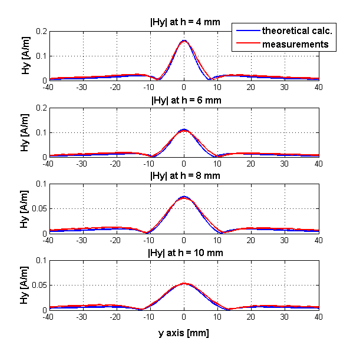
Fig. 7. Tangential H-field component Hy
Fig. 7 shows the tangential magnetic field component Hy, while Fig. 8 shows the normal one Hz. The comparison shows that the field measurements are in good agreement with the theoretical calculations for the 3D probe. Also good spatial resolution is obtained for the probes in measuring the magnetic field components.
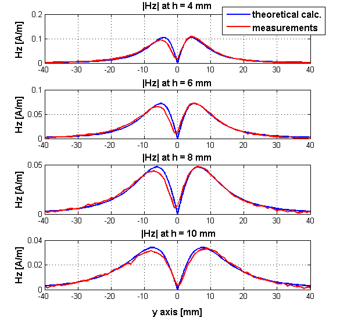
Fig. 8. Normal H-field component Hz
4. RFID System Characterization
4.1. RFID Loop Antennas
Most of the RFID readers are designed with loop antennas. Loop antennas feature simplicity, low cost and versatility. They are made of a loop of a conductor that may have various shapes: circular, triangular, square, elliptical, etc. They are widely used in communication links up to the microwave bands (up to 3GHz). They are also used as electromagnetic field probes.
Loop antennas are usually classified as electrically small and electrically large antennas. Electrically small loop antennas are those who have their circumference less than tenth of the wavelength (C < 0.1λ), while in electrically large antennas the circumference is near the wavelength (C ≈ λ). Small loops are equivalent to a magnetic dipole and they have a far-field pattern very similar to that of a small electric dipole normal to the plane of the loop [11].
4.2. Designed RFID Antenna
In this paper, a rectangular small loop antenna operating at 13 MHz is designed. It is the typical RFID reader antenna used in library RFID systems. First the RFID reader antenna was designed and simulated using HFSS; it consists of 1-turn rectangular loop and a matching network. The rectangular loop has the dimensions of 140mm×140mm with a line width of 5mm.
The loop antenna has inductive input impedance; hence a parallel RC circuit should be used as a matching circuit. An impedance matching circuit was designed using surface mounted device (SMD) lumped elements to match the antenna to the 50Ω feed line at the operating frequency. Fig. 9 shows the corresponding circuit of the designed loop antenna, and Fig. 10 shows the 3D far field pattern where the loop lies in xy plane.
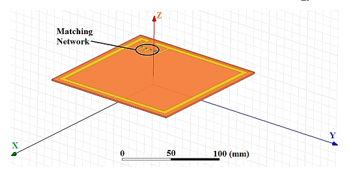
Fig. 9: Simulated RFID rectangular loop antenna
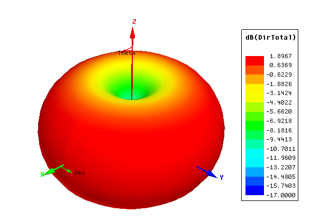
Fig. 10: 3D far field pattern of the designed antenna
The antenna prototype is then fabricated on a dielectric substrate FR4 with the dimensions of 150mm×150mm and 1.6mm thickness as shown in Fig. 11. The dimensions of the square loop are 140mm×140mm, and the width of the copper trace is 5mm.
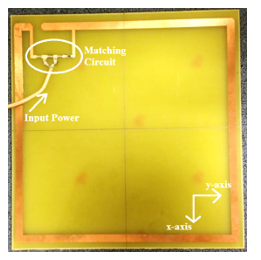
Fig. 11: Fabricated RFID loop antenna
The reflection coefficient measurement in Fig. 12 shows that the antenna resonant frequency is exactly at 13MHz. The measured reflection coefficient of the antenna is in good agreement with the simulation.
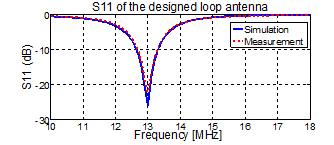
Fig. 12: Reflection coefficient of the designed RFID loop antenna
4.3. Characterization of the Designed RFID Antenna
The RFID antenna was excited with a CW signal having a source power of 10dBm, which is a typical power supply value for the RFID readers used in libraries applications [12]. The field mapping was done along y-axis and at two different heights (h=1cm & h=5cm) above the RFID reader loop antenna. These heights were chosen since they are the typical heights for the human exposure to library RFID systems. Then the measured magnetic field is compared with the simulated values and compared with ICNIRP guidelines for exposure limitations [13].
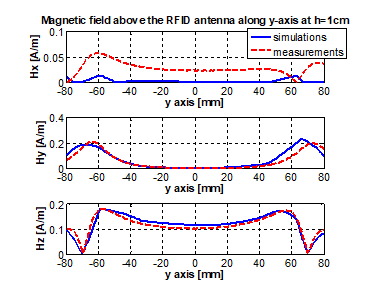
Fig. 13: Magnetic field strength above the RFID reader antenna along y-axis
at height h=1cm
The magnetic field strength of the three components (Hx, Hy, and Hz) at the two different heights above the RFID reader antenna is shown in figures Fig. 13 and Fig. 14. The simulation values obtained with HFSS are in good agreement with the measured ones, except the Hx component. This mismatch is due to the low level of Hx field if compared to the other components, so the coupling effect on the x component loop in the 3D probe is too high in this case. At h=1cm the Hy component has a maximum level of 0.2A/m while Hz has a maximum level of 0.18A/m where Hx has a level below 0.06A/m. At h=5cm the Hy component has a maximum level of 0.04A/m while Hz has a maximum level of 0.07A/m where Hx has a level below 0.02A/m.
At our operating frequency the reference level in the Guidelines is 0.2µT, which is equal to 0.16A/m in free space. This limit value refers to full body exposure for 6 minutes period. Considering the RFID reader used in library systems, there is a partial body exposure and the exposure lasts just for few seconds. So the obtained values at h=1cm which are little bit above the allowed ones (0.04A/m for Hy and 0.02A/m for Hz) in the Guidelines are acceptable for this application. Moreover, the RFID reader antenna in Library systems is placed under a table so there is about 2cm between the antenna and the table surface.
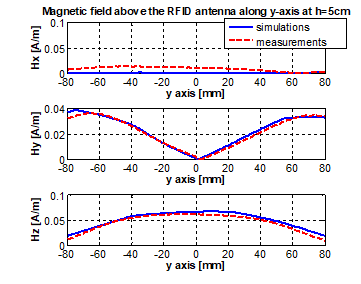
Fig. 14: Magnetic field strength above the RFID reader antenna along y-axis
at height h=5cm
5. Conclusion
In this paper we have presented a near-field measurement system with a new 3D magnetic field probe design. The system consists of a 3D magnetic field probe, 3D scanning robot, and a digital oscilloscope. The designed probe was calibrated using a TEM cell, and the antenna factor between 10 MHz and 1 GHz was presented. The system was validated using a wire over a ground plane loaded with 50 ohm impedance. Good results were obtained for the used probe in measuring the magnetic field in the near region. Then an RFID reader loop antenna, used in Library RFID systems, was simulated and designed. The magnetic field strength near the designed antenna is then measured with the designed probe and analyzed. The simulations obtained with HFSS and the measurement results were compared to the action levels stated in ICNIRP Electromagnetic Fields Guidelines.
Acknowledgment
This research work was done at PHELINE, a test lab common with CSTB and Grenoble-Alpes University. It is specialized in the study of the electromagnetic fields phenomenon and its interactions with the environment. This work was partially funded by ANSES – French Agency for Food, Environmental and Occupational Health & Safety.
- G. Viziteu, B. Florean, G.M. Moraru, and A. Pintea, “An Overview of RFID Technology Used In Library”, International Conference and Exposition on Electrical and Power Engineering (ICEPE), 2012, pp. 108-111.
- Klaus Finkenzeller, “RFID HANDBOOK Fndamentals and Applications in Contactless Smart Cards, Radio Frequency Identification and Near-field Communication, Third Edition”, 2010.
- Osofsky and S. E. Schwarz, “Design and performance of a non-contacting probe for measurements on high-frequency planar circuits,” IEEE Trans. Microw. Theory Tech., vol. 40, no. 8, pp. 1701– 1708, Aug. 1992.
- Jung-Min Kim, Woo-Tae Kim, and Jong-Gwan Yook, “Resonance-Suppressed Magnetic Field Probe for EM Field-Mapping System” IEEE Trans. Microw. Theory Tech.,, vol. 53, no. 9, September 2005.
- S. Jarrix et.al “Probe Characterization for Electromagnetic Near-Field Studies” IEEE Transactions On Instrumentation And Measurement, Vol. 59, No. 2, pp.292-300, February 2010.
- H.Weng, D.G.Beetner, R.E.DuBroff, “Prediction of Radiated Emissions Using Near Field Measurements” IEEE Transactions On Electromagnetic. Compatibility, vol.53, no.4, pp. 891-899, November 2011.
- Muroga et.al “3D magnetic –near-field scanner for IC chip-level noise coupling measurements,” IEEE Transactions On Magnetics, vol. 49, no. 7, 4P. july 2013.
- Y. Gao and I. Wolff, “A new miniature magnetic field probe for measuring 3-dimensional fields in planar high frequency circuits,” IEEE Trans. Microw. Theory Tech., vol. 44, no. 6, pp. 911–918, Jun. 1996.
- J.P. Karst, C.Groh, H. Garbe, “Calculable field generation using TEM cells applied to the calibration of a novel E-filed probe”, IEEE Trans. Electromagnetic compatibility, vol. 44, no.1, pp. 59-71, February 2002.
- D. Baudry, A. Louis, and B. Mazari, “Characterization of the open-ended coaxial probe used for near-field measurements in EMC applications,” Prog. Electromagn. Res., vol. PIER 60, pp. 311–333, 2006.
- Balanis, C. A., “Antenna Theory Analysis and Design, 2nd Ed.”, John Wiley & Sons, New York, 1997.
- Klaus Finkenzeller, “RFID HANDBOOK Fundamentals and Applications in Contactless Smart Cards, Radio Frequency Identification and Near-field Communication, Third Edition”, 2010.
- International Commission on Non-Ionizing Radiation Protection, “ICNIRP guidelines for limiting exposure to time varying electric, magnetic and electromagnetic fields (up to 300GHz)”, Health Physics, Vol. 74, No. 4, pp. 494-522, 1998.