Image Segmentation Using Fuzzy Inference System on YCbCr Color Model
Image Segmentation Using Fuzzy Inference System on YCbCr Color Model
Volume 2, Issue 3, Page No 460-468, 2017
Author’s Name: Alvaro Anzueto-Rios1, 2, a), Jose Antonio Moreno-Cadenas1, Felipe Gómez-Castañeda1, Sergio Garduza-Gonzalez1, 2
View Affiliations
1Solid-State Electronics Section (VLSI-Lab), Department of Electrical Engineering, CINVESTAV-IPN, 07360, Mexico
2Biomechanics Laboratory, Bionics Department, UPIITA-IPN, 07340, Mexico
a)Author to whom correspondence should be addressed. E-mail: aanzuetor@ipn.mx
Adv. Sci. Technol. Eng. Syst. J. 2(3), 460-468 (2017); ![]() DOI: 10.25046/aj020359
DOI: 10.25046/aj020359
Keywords: Fuzzy Logic and Fuzzy Set, Fuzzy rules, Color Model, Segmentation, Chrominance and Luminance

Export Citations
This paper This paper presents a reliable method for image segmentation using a fuzzy inference system. The Fuzzy Membership function is applied on the YCbCr color space. Triangular membership functions are used in the input of the fuzzy system, Mamdani type fuzzy inference system is applied and for the output universe, singleton-type functions are used; to get the accurate output value, the Weighted Average Method (WAM) is applied. The YCbCr color space is used as feature space. One of the reasons being that it is standardized for the transmission and reception of digital video, (ITU-R Recommendation BT.601-5), and implemented by most of the sensors used in the acquisition of video. The fuzzy membership functions characterize the different membership levels between hue and Chroma from the YCbCr color model. The fuzzy inference system classifies data and generates regions of pixels with a homogeneous color level in the output images. The proposed method was also compared with another system segmentation using Euclidean distance applied to the RGB color space. The best results were obtained in the YCbCr color space. In such model, the changes of hue in presence of illumination variations are considered so that it has a better performance in the segmentation task. In addition, the processing time was lower in this color space.
Received: 05 April 2017, Accepted: 02 May 2017, Published Online: 24 May 2017
1. Introduction
Color perception begins with a chromatic light source -which is electromagnetic radiation with wavelengths between 400 and 700 nm approximately. Part of the radiation, which is reflected on the surface of objects, is a scene and the resulting reflected light reaching the human eye, generates the feeling of color perception [1-4].
Brightness is the luminance or relative darkness of the color, hue is the color reflected or transmitted through an object and, saturation (also called chroma) represents the contribution of white color existing in proportion to the hue, or more precisely, the color purity [2]. This is the basis of the YCbCr color space.
The color segmentation in the computer vision field is important for pattern recognition and image processing tasks purposes. Segmentation is the process of partitioning an image into regions of interest (sets of pixels), with homogeneous features; namely, they can share one or more characteristics, such as shape, color, texture, lighting, etc.
The color of the shapes within an image can be used to simplify the identification and extraction of the regions of interest. They can be recognized as separate objects.
Image segmentation methods have recently been proposed, many of them based on Neural Systems and Fuzzy Logic. A segmentation system based on neural networks has been proposed by Ganesan et al. [5], they performed an unsupervised competitive neural network based in Kohonen’s self-organizing maps (SOM). They used color satellite images. The images are segmented in RGB and HSV color space. The main problem of his work is the high computational cost because to obtain the value of a pixel, with the structure presented, 48 connections are necessary, increasing with this the number of operations. In addition, the weights of each node should be initialized before training data and the performance of the training depends on the initial data. If the initial data is not adequate, the process will have to be repeated.
The YCbCr color model has been used for skin detection and, in combination with the fuzzy model, has presented great performance for image segmentation [6, 7]. The Cb and Cr components determine the skin tonality. Tonalities are represented by histograms. Fuzzy inference models to determine the pixels representing the possible regions of skin within an image can be applied to them.
When looking for adaptability in fuzzy systems to model information in an unsupervised way, different proposals have been presented for the image segmentation using the classical algorithm of Fuzzy C-Means (FCM) [8-10]. G. Liu et al. [8] introduced a dissimilarity function by combining region-based and pixel-based distance function, in order to enhance the relationship between pixels which have similar local characteristics. This idea is retaken in this work, since, for the distribution of fuzzy sets, local information is considered.
Liu and Wang [11] developed a method of fuzzy color recognition and segmentation of robot vision scene based on the combination of fuzzy color quantization and edge extraction of HSV color space. This work was supported in part by the same idea; the triangular membership functions in the input of the system and the Mamdani-type inference are used. In contrast with the work mentioned above, we used YCbCr color space, fuzzy singletons are used as output function and the output value is obtained by the Weighted Average Method (WAM) [12, 13].
One of the reasons for using the YCbCr color space is that it is standardized for the transmission and reception of digital video, (ITU-R Recommendation BT.601-5 [14]), therefore, most of the sensors used in the acquisition of video implement it. We used a device that has as main output signals, the YCbCr color space, eliminating the need to perform the transformation to another color space and improving the response time.
The fuzzy singleton function and WAM are used to simplify the mathematical calculation of the output value for the fuzzy inference system.Distribution of input membership functions for classification of hue is made on the Cb and Cr components of YCbCr color space (see Figure 1)
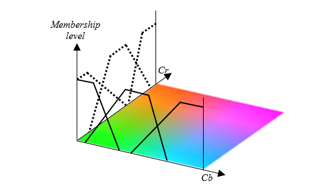
Figure 1: Distribution of membership functions in the space of chroma Cb and Cr
This paper is organized as follows. In Section 2, we give a brief introduction to the YCbCr color space. The basis of fuzzy logic is discussed in section 2. Section 4 presents the fuzzy rules used by the system. The application of segmentation system is presented in Section 5. The discussion of the results is made in Section 6. Section 7 presents the conclusions.
2. YCbCr Color Model
It is a nonlinear encoding of the RGB color model. The YCbCr model components determine the luminance and chrominance. “Y” is the contribution of light in the pixel; “Cb and Cr” are the blue and red chrominance components, respectively. The combination of Chroma values are different colors (color coordinate system), but the luminance value “Y” determines the brilliance of color, specifically, for low values of “Y” the colors will be dark; otherwise, the colors will look very bright with a hue close to white. The three cases for the variation of illumination “Y” are shown in Figure 2, as it can be seen, the color coordinate system changes its hue.
The YCbCr space is commonly used in vision-based hardware systems and digital video transmission. It is defined for standard-definition television and digital transmission purposes by the ITU-R BT.601. One of the main features of this model is that the brightness component “Y” is independent from the chroma components; because of this, this color space can be used to solve illumination variations in non-controlled environments.
The below mathematical expression is given following the recommendations of the ITU-R BT.601 standard (chapter 3.5.2 [14]) for a Cr and Cb re-normalized system.
Equation (1), describes the RGB color space conversion to the YCbCr space. Where matrix A represents the re-normalized coefficients of the horizontal vectors Y, Cb and Cr respectively. C is the matrix that re-measures the data, transforming the 220 and 225 levels, to 256 (8-bit digital representation). Before applying (1), the lowest value for Y, Cb and Cr is 16 and the highest value for Y is 235 and Cb, Cr is 240. After applying (1), the lowest value is 0 and the highest value is 255, for the three components. This mathematical procedure is similar to the function RGB2YCBCR included in the MATLAB’s digital image processing toolbox. This value transformation, 256 values, will be used in this paper.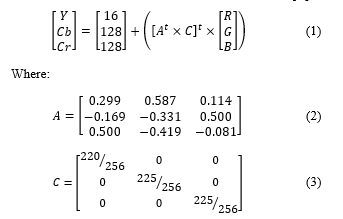
3. Fuzzy Logic
In the YCbCr color space, the transition between a color and another one does not have a defined borderline; namely, it changes gradually from one hue to another. Due to the fact that fuzzy systems work with uncertain data, this system is very appropriate.
A fuzzy set is associated with a linguistic value that is defined by a word, an adjective or a linguistic label. In the fuzzy set, the membership function can take values in the interval (0, 1), making
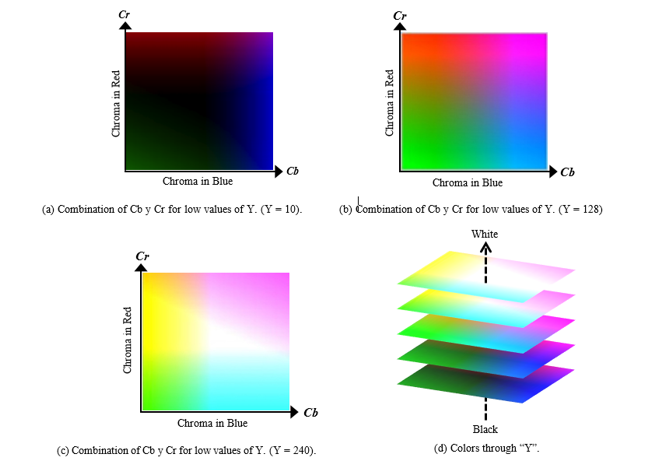
Figure 2: Color coordinate system obtained by combination of Chroma. Value of low illumination (a), value of medium illumination (b), value of high illumination (c), colors through “Y
a gradual transition between zero and one, and not discreetly one such as that in classical sets.
The fuzzy set in a universe of discourse can be defined as shown in (4). 
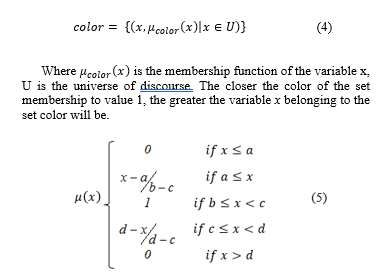
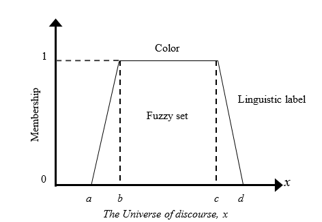
Figure 3: Definition of Trapezoidal Fuzzy Set
Equation (5) defined a trapezoidal fuzzy set type (see Figure 3) which describes the different membership levels [12]. The parameters (a, b, c, d) determined the slopes in the boundary lines of the fuzzy sets. As a fuzzy set, it can be inferred that the maximum level of membership is equal to one, the slope of a line determines the different membership levels and the non-membership is equal to zero. For this system, the overlap in the fuzzy sets describes the inaccurate transition between the hues, as
detailed in Figure 4.
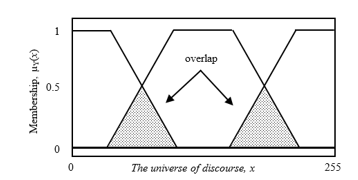
Figure 4: Overlap in fuzzy sets, inaccurate transition of the hue
4. Fuzzy Rules
A fuzzy system inference uses the expert’s knowledge to generate a knowledge base, which will give the system the ability to make decisions. This knowledge base is modeled by creating a rule set, which generates the system output; in this case, it is the membership of pixels within an image above a set or another.
As mentioned, the component “Y” represents the contribution of light existing in a color. In Figure 5, a graphical diagram of the inference of nine fuzzy rules when the colors are considered dark can be seen. That is, when luminance “Y” has a low value. (The first nine rules in Table 1).
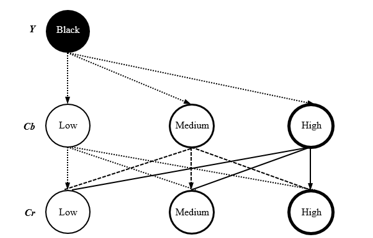
Figure 5: Graphic description of the fuzzy rules
In Table 1, we can see twenty-seven diffuse rules, which are all combinations when we consider three fuzzy sets for each component of the color space YCbCr.
To obtain a crisp output or output image (segmented regions), we need a defuzzification process. The inputs of the defuzzification process are the values of fuzzy membership functions Y, Cb, and Cr, and the output of the defuzzification process is a single number (or the value of one pixel). Many defuzzification techniques have been proposed in literature [12, 13]. The most commonly used method is the WAM (also named centroid). In WAM, the defuzzifier determines the weighted mean (or the center of gravity) of the fuzzy membership functions implicated in each of the knowledge base rules (Table 1). It is given by the algebraic expression in (6).
Where denotes an algebraic sum and A represents the different colors expected at the output, see Table 1.
Table 1: Combination that generate the knowledge base of fuzzy rules.
|
No. Rule |
Description | Output | ||
| Y | Cb | Cr | ||
| 1 | Black | Low | Low | Black |
| 2 | Black | Low | Medium | Black |
| 3 | Black | Low | High | Black |
| 4 | Black | Medium | Low | Black |
| 5 | Black | Medium | Medium | Black |
| 6 | Black | Medium | High | Black |
| 7 | Black | High | Low | Black |
| 8 | Black | High | Medium | Black |
| 9 | Black | High | High | Black |
| 10 | Color | Low | Low | Green |
| 11 | Color | Low | Medium | Yellow |
| 12 | Color | Low | High | Red |
| 13 | Color | Medium | Low | Cyan |
| 14 | Color | Medium | Medium | Gray |
| 15 | Color | Medium | High | Crimson |
| 16 | Color | High | Low | Blue |
| 17 | Color | High | Medium | Violet |
| 18 | Color | High | High | Magenta |
| 19 | White | Low | Low | White |
| 20 | White | Low | Medium | White |
| 21 | White | Low | High | White |
| 22 | White | Medium | Low | White |
| 23 | White | Medium | Medium | White |
| 24 | White | Medium | High | White |
| 25 | White | High | Low | White |
| 26 | White | High | Medium | White |
| 27 | White | High | High | White |
5. Segmentation of Hue Using Fuzzy Logic
The YCbCr color space has a color chart consisting of the combination of the Chroma belonging to the red and blue (Cb and Cr) and different levels of luminance (Y), see Figure 2.
For the universe set “luminance”, we consider three linguistic labels, “Black” which represents the low contribution of light, “Color” where it is considered the optimal lighting to perceive the tone of a color, and “White” representing a high contribution of light, see Figure 6.
In order to reach the perception of color, the presence of luminance without reaching saturation will be necessary.
Different combinations of the components “Cb and Cr” typify the color. By taking this into account, the fuzzy sets are generated in their combination representing the different colors that the system can classify.
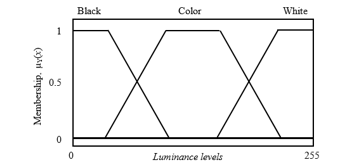
Figure 6: Fuzzy sets for the universe set. “luminance”; Y
Three fuzzy sets are defined, each with their linguistic label respectively for each Chroma component. “Low” when the Chroma saturation in blue or red is low, “medium” when the Chroma saturation is medium, and “high” when the Chroma saturation is high, as detailed in Figure 7.
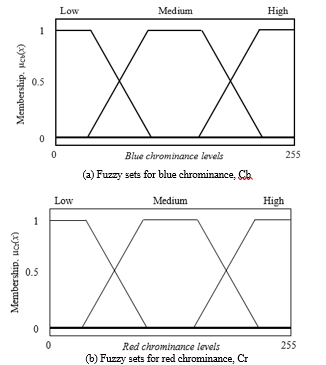
Figure 7: Fuzzy sets of chrominance. (a) Blue chrominance Cb, (b) Red chrominance Cr
The values values (a, b, c, d), which are parameters of (5), represent the form of all the fuzzy sets in a universe set (see Figure 8). By varying these parameters, different slopes in the boundary lines of the fuzzy sets are generated, modifying the zone that represents uncertain data.
Also, it is possible to find a particular hue value by modifying these parameters. For example, if we are looking for red color and its different hue values (the red color region is in the upper left corner in the color palette as shown in Figure 8), it is necessary to expand the region covered by the “Low” set in “Cb” and the “High” set in “Cr”, which means that the value of the parameter “a” in “Cb” should be increased and the value of the parameter “d” in “Cr” should be decreased. The region of interest is then amplified as shown in Figure 9.
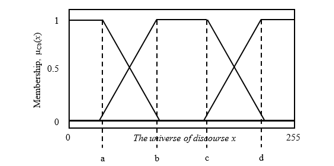
Figure 8: Parameters for controlling the distribution of the fuzzy sets (a, b, c, d)
The numerical values of (a, b, c, d) parameters, which are used in the fuzzy sets for red segmentation, are shown in Table 2.
Table 2: Value of the parameters (a, b, c, d) for the fuzzy sets of Y, Cb, Cr
| Y | Cb | Cr | |
| a | 30 | 95 | 85 |
| b | 60 | 105 | 95 |
| c | 200 | 195 | 145 |
| d | 235 | 205 | 155 |
One of the images tested with the proposed fuzzy inference system is shown in Figure 10. It contains an object with a red hue. In order to explain the different steps that the fuzzy logic segmentation system follows, a pixel will be taken from the processed image.
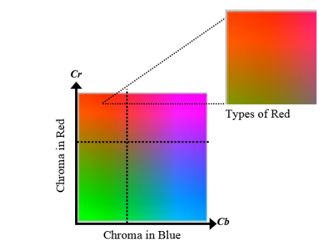
Figure 9: Color model YCbCr. Search of red in the color pallet of the chrominance (Cb and Cr)
This selected pixel corresponds to a reddish object, and it has the following values for Y=143, Cb=94 and Cr=188. The membership values obtained by processing the pixel described above are shown in Table 3.
The membership value shown in Table 3 are introduced in (4) to obtain the numerical values of the system output. Variables named “S” represent the output fuzzy sets (fuzzy Sigleton’s), each of them are located at the expected output value; for example, S10 represents the red color, suggesting that the pixel in the output image will have R = 255, G = 0, B = 0 as a numerical value as long as the numerical value obtained in (3) is similar to S10. Table 4 lists the values of all the fuzzy singleton’s.
Table 3: Membership Value for Each Fuzz Set
| Fuzzy Sets m | Membership Value |
| mBlackY | 0 |
| mColorY | 1 |
| mWhiteY | 0 |
| mLowCb | 1 |
| mMediumCb | 0 |
| mHighCb | 0 |
| mLowCr | 0 |
| mMediumCr | 1 |
| mHighCr | 0 |
Table 4: Fuzzy Singletons Value (Output Functions)
| Output Numerical Value | |
| S1 | 10 |
| S2 | 33 |
| S3 | 56 |
| S4 | 79 |
| S5 | 102 |
| S6 | 125 |
| S7 | 148 |
| S8 | 171 |
| S9 | 194 |
| S10 | 217 |
| S11 | 240 |
To form the output image, each pixel is is processed in the same way. The used method for image processing is shown in Figure 10. At first, the original image is in RGB color space (Figure 10 (a)). Then, the image is transformed into YCbCr color space (Figure 10 (b)) and finally, the fuzzy inference system is applied to the result image (Figure 10 (c)). It is worth noting here that the output singleton sets are represented again in RGB color space to be displayed on screen.
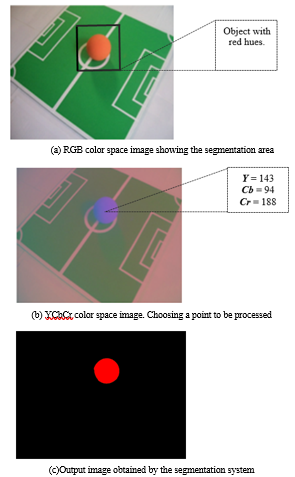
Figure 10: Graphic sequence of the fuzzy segmentation system (a), (b), (c)
6. Experimental Evaluation
To evaluate the effectiveness of the segmentation system by fuzzy logic, the segmentation of the green hue in the original image of Figure 11(a) was proposed. This photo was taken in the laboratory, in a closed room, under semi-controlled lighting conditions and the changes in illumination inside the photo can be noticed. The image contains a green area that simulates the conditions of a (small) soccer field, a red ball and white lines that define the green area.
This particular photo was chosen because our segmentation system will be a part of the vision system of a robotic prototype that serves as a football player.
The segmentation system was designed considering only the red, green and blue contributions in the RGB color space model, in order to define the color of an object and matching the results from the opposite system. The classification in the RGB segmentation was made by obtaining the Euclidian distance between each one of the image’s pixels and the mean of the pixels (red, green, blue) that defines the green color of the image.
The code was developed based on Matlab programming language in its version R2010a (see Appendix A), on a computer with an Intel Core2 Duo T6400 2 GHz. Images were obtained with a Kodak Easy Share CD14 with a resolution of 1280×960, JPG format.
The execution time of the segmentation system when using RGB color space was of 1 min.15 sec. For YCbCr color space it was 55 sec.
The difference between the RGB and YCbCr execution times is mainly due to the fact that, in the RGB color space, each component contributes to obtain a color hue so that the three components are an input of the fuzzy system; in the YCbCr, the component “Y” determined, as a first step, if the pixel has low lighting (black), high lighting (white) or if the lighting is good enough to perceive the hue of a color. The pixel Chroma components to determine the membership level are discussed only in the latter case.
Figure 11(c) shows the result of the segmentation of the RGB color space.
For segmentation in YCbCr, we transform the original image into this color space, due to fact that the image is in RGB color space, Figure 11(a), the rgb2ycbcr function was used for this purpose, which is part of the “image processing” toolbox of Matlab, (see Figure 11(b)). In Figure 11(d) the result of the segmentation can be observed.
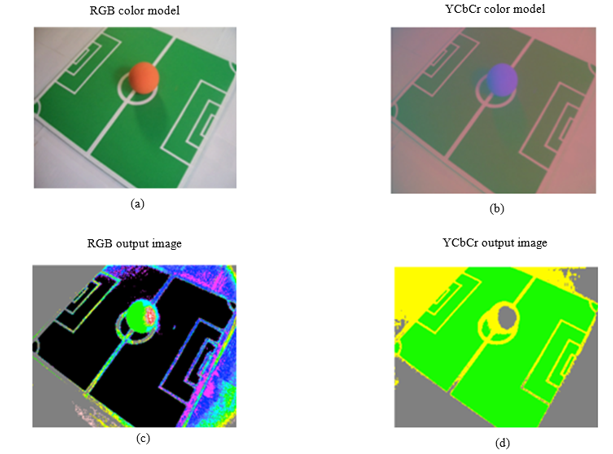
Figure 11: Segmentation process in the RGB and YCbCr color spaces, (a) Original image in RGB color space, (b) Original image transformation into YCbCr color space, (c) Segmentation of green color in RGB, (d) Segmentation of green color in YCbCr
The change in hue due to the variation of lighting was considered in the YCbCr color space, so that, when the images in Figure 11(c) and Figure 11(d) were compared, as expected, we observed a better performance of the segmentation system in YCbCr.
The variation of lighting is not considered for the RGB, so that, the pixels in the top center of the image Figure 11(c), were classified as non-green hue.
In Figure 11(a), three main regions can be seen, one of them is the green region (region of interest), and two more regions that are covered with yellow and gray pixels. The last two regions are the result of the membership levels to the fuzzy sets of the remaining pixels.
The values for the parameters (a, b, c, d) of the fuzzy sets which are used for the segmentation of green color in YCbCr are shown in Table 5.
Table 5: Value of the Parameters (a, b, c, d) for the Fuzzy Sets of Y, Cb, Cr
| Y | Cb | Cr | |
| a | 30 | 95 | 85 |
| b | 60 | 105 | 95 |
| c | 200 | 195 | 215 |
| d | 235 | 205 | 225 |
Another important point to mention is that the equations to conform the fuzzy sets are relatively simple and only require 4 parameters to generate the fuzzy sets that cover a universe set. We have taken advantage of this simplicity and it was implemented in a segmentation system in an FPGA.
A test showing how to generate an output image with three hues by adding the segmentation of green and red color from an input image is shown in Figure 12. The image obtained in Figure 12(d), may be used for classification and recognition of objects contained therein.
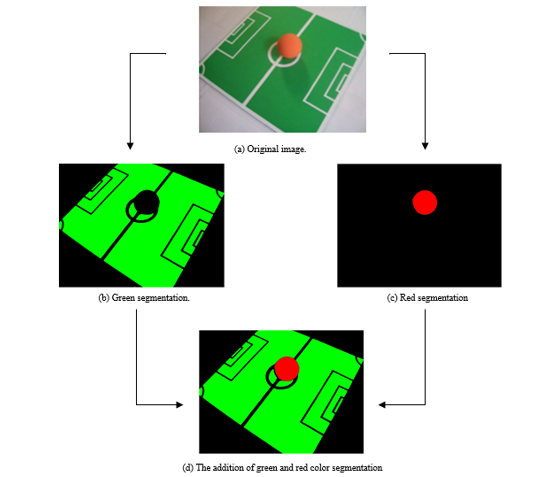
Figure 12: Segmentation process, (a) Original image, (b) Green segmentation, (c) Red segmentation, (d) Addition of b and c
7. Conclusion and Future Works
This paper proposes an application of segmentation of regions in images using fuzzy logic. It exploits the ability of fuzzy sets for modeling accurate data to interpret the transition from one hue to another by using the blue and red chromas in the YCbCr color space.
Trapezoidal sets are proposed for mapping of the chroma to membership levels and is considered the ITU-R Recommendation BT.601-5 in order that the system can be applied to most sensors for the acquisition of digital video.
The combination of the YCbCr color space with the fuzzy inference system demonstrated high adaptability to model different color hues, so different color hues can be segmented into an image.
By the simplicity of the equations, both to generate the fuzzy sets and the calculation of the value of the output of the system, it is possible to have a system of low computational cost and high speed to obtain a response.
MATLAB programing language was used in its version R2010A to develop the system and was applied in two color spaces, RGB and YCbCr, execution times were 1 min. 15 secs and 55 secs, respectively.
Due to the simplicity of the formulas that are used to develop the fuzzy inference system, the implementation in hardware is feasible. In our laboratory, we have implemented the proposed system, using the Spartan 3E development board which contains an FPGA xc3s500e from XILINX Company. The proposed segmentation system has been applied in the object tracking and orientation of robots. Different colors and shapes have been presented to a robot and the execution times obtained allow working with images with continuous sequence.
Conflict of Interest
The authors declare that there is no conflict of interest regarding the publication of this paper.
Acknowledgment
Alvaro Anzueto-Rios thanks CONACYT for the scholarship to finish his doctoral studies. He also thanks the Institute Polytechnic National (IPN Mexico) and UPIITA for the support to complete this paper.
- R. C. Gonzalez, R. E. Woods, Digital Image Processing, Pearson-Prentice Hall, 2008.
- J. C. Russ, The Image Processing Handbook, CRC Press Taylor and Francis Group, 2011.
- W. Burger, M. J. Burge, Principles of Digital Image Processing, Springer-Verlag, 2013.
- O. Marquez, Practical Image and Video Processing using MATLAB, Wiley-IEEE Press, 2011.
- Ganesan, K. B. Shaik, B. S. Sathish, V. Kalist, “Neural network based SOM for multispectral image segmentation in RGB and HSV color space”, International Conference on Circuit, Power and Computing Technologies (ICCPCT 2015), Nagercoil India 2015.
- F. Z. Chelali, N. Cherabit, A. Dejeradi, “Face Recognition System Using Skin Detection in RGB and YCbCr color space”, 2nd World Symposium on Web Application and Networking (WSWAN 2015), Sousse Tunisia, 2015.
- M. Banerjee, S. Muhuri, “A Robust Face Detection Algorithm Based on Fuzzy Color Histogram Model” International Journal of Graphics & Image Processing (IJGIP), 4(4), 296-303, 2014.
- G. Liu, Y. Zhang, A. Wang, “Incorporating adaptive local information into fuzzy clustering for image segmentation” IEEE Transaction on Image processing, 24(11), 3990-4000, 2015.
- T. Chaira, “A novel intuitionistic fuzz c means clustering algorithm and its application to medical images” Applied Soft Computing, 11, 1711-1717, 2011.
- E. Rajaby, S.M. Ahadi, H. Aghaeinia, “Robust color image segmentation using fuzzy C-means with weighted hue and intensity”, Digital Signal Processing, 51, 170-183, 2016.
- C. Liu, L. Wang, “Fuzzy color recognition and segmentation of robot vision scene”, 8th International Congress on Image and Signal Processing (CISP), Shenyang China, 2015.
- J. T. Ross, Fuzzy Logic with Engineering Applications, John Wiley & Sons, 2010.
- S. N. Sivanandam, S. Sumathi, S. N. Deepa, Introduction to Fuzzy Logic using Matlab, Springer-Verlag, 2007.
- ITU-R Recommendation BT.601-5: Studio encoding parameters of digital television for standard 4:3 and wide-screen 16:9 aspect ratios.