Principal Component Analysis Application on Flavonoids Characterization

Adv. Sci. Technol. Eng. Syst. J. 2(3), 435–440 (2017);
 DOI: 10.25046/aj020356
Flavonoid is one of the bioactive compounds that are currently used in pharmaceutical and medicinal industries due to their health benefit. The focus of current research is mainly on the extraction and isolation of bioactive compounds; however non to date has explored on the identification of flavonoids classes under the Fourier Transform Infrared spectroscopy (FTIR). This gap presents an opportunity for the application of statistical analysis which can identify the distinct wavenumbers range of flavone, flavanone and flavonol for their characterization in the FTIR spectrum. Development of algorithm based on principal component analysis (PCA) for the analysis and identification of flavonoids classes based on FTIR spectrum was introduced. Based on the results, five wavenumbers ranges have been identified as the distinct characteristics of flavonol, flavone and flavanone hence used for their identification.
1. Introduction
This paper is an extension of work originally presented at IEEE Student Conference on Research and Development (SCOReD) 2016 [1]. Currently, flavonoids have received much attention especially in medicinal and pharmaceutical industries because of its biological properties such as high antioxidant activity, high radical scavenging, anti-inflammatory, anti-cancer and anti-allergic [2]. Flavonoids are one of the active ingredients used for the formulation of drugs and potential to treat many diseases. Increasing research performed (in vitro) on the importance of flavonoids consumption such as reducing the risk of Parkinson disease [3], may lower risk of ovarian cancer [4] and protecting brain damage [5]. Besides, flavonoids are widely distributed in fruits, plants, vegetables and microorganisms [6].
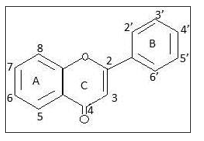
Flavonoid have C6-C3-C6 general structure backbone which consists of two phenolic structures, ring A and ring B attached to heterocyclic ring C as in Figure 1. There are more than 7000 structures of flavonoids from different subgroups have been reported [7]. All flavonoids share a basic C6-C3-C6 phenyl-benzopyran backbone; however differ in their substituents (type, number and position) and in their insaturation [8]. Individual differences within each group are due to variations in number and arrangement of the hydroxyl groups and their extent of alkylation and/ or glycosylation.
As the multiple bioactive compounds presence in compound, the characterization and identification of the bioactive compounds remain challenging due to complicated isolation procedures [9]. Several analytical techniques have been developed for the identification of flavonoids such as the application of High Performance Liquid Chromatography (HPLC) [10], HPLC coupled with photodiode array and mass spectrometry detectors [11], nuclear magnetic resonance (NMR) spectroscopy and mass spectrometry (MS) evidences [12], Thin Layer Chromatography (TLC) plate [13] and many more. However, some disadvantages possessed are less sensitive, expensive and the need for chemist to analyze.
Today, the applications of Fourier Transform Infrared spectroscopy (FTIR) has increased in food, pharmaceutical as well as medicinal applications for the identification of active compounds in plants, fruits, vegetables and microorganisms [14,15,16,17] and particularly has become a powerful analytical tool in the study of active compounds presents in samples. In fact, there have been several studies concerning with the characterization, classification and identification of flavonoids using FTIR [18,19,20].
FTIR has become well-accepted method due to its ease of samples preparation, fast, need little samples size, and does not require the use of solvents which is more economical [21].
FTIR spectrums however are difficult to interpret, unless for the expertise since the library spectrum are limited, and the software used to interpret the results somehow expensive [22]. Principal component analysis (PCA) is one of the chemometric methods that can be used to identify the similarities and differences of the chemical information [23]. Infrared spectroscopy, combined with chemometric, has been used for the identification of active compound [24].
Studies have been performed on the identification of flavonoids [11,12], however non to date has explored on the identification of individual flavonoids under FTIR spectrum coupled with chemometric analysis, which is PCA. Despite some studies performed on the identification of compound using few combination of chemometric techniques such as hierarchical cluster analysis [24], PCA, partial least square (PLS) and factor discriminant analysis (FDA) [25], the application of PCA into the characterization model has not been undertaken yet.
Introduction of the characterization model based on computational method provides the valuable tools with the application of PCA into the model algorithm for rapid identification. The proposed method are unique, since adapted both the structural information provided by PCA based on spectrum data of flavonoids structure with the interaction information from the compound, unlike most current methods [26,27,28]. The adapted characterization model is based on nested if and if else statement builds as an algorithm for the characterization.
Therefore, the objectives of this study are to develop an algorithm utilizing the PCA as the base for the interpretation and analysis of FTIR spectrums and to identify the distinct wavenumbers range of flavone, flavanone and flavonol as for their identification under the FTIR spectroscopy.
2. Literature review
2.1. Fourier Transform Infrared Spectroscopy and Principal Component Analysis Applications
FTIR offers high speed of analysis and needs little or no sample preparation [29]. Moreover, it also provides information on multiple parameters simultaneously [30]. The chemical bonds in material will vibrate once the infrared radiation that interacts with matter is absorbed hence producing the infrared spectrum. Regardless of the structure of the rest of the molecule, the functional groups tend to absorb infrared radiation in the same wavenumber range [22].
Band assignments for flavonoids identification have been studied in some details [31]. Based on studies, different peak shown due to wavenumber shift of different molecules with the same functional group under their wavenumber range; indicate the uniqueness of the molecules under FTIR spectrum hence used for the fingerprint of the molecules. The correlation shows between the infrared band positions and chemical structure becomes the fundamental information for the analyst to identify the unknown molecules or even the structural identification.
According to [22], the wavenumber range between 3500-3200 cm-1 is corresponds to the OH functional group and studies indicated that the overall arrangement of molecular structure will cause the wavenumber shift of the functional groups in their range [31]. Studies performed on phenolic compound for their antioxidant nature using FTIR [32,33]. From the studies, the presence of OH group under FTIR region will cause wavenumber shift depend upon to its oxidant nature.
FTIR spectra on flavonoids structure has been studied extensively [34]. The study highlighted the spectrum wavenumber range which are common for the flavonoid structure is the C=O bond (1630 and 1665cm-1), C-O bond (1000 and 1300 cm-1), and in-plane deformation vibrations of C-H (600 and 980cm-1). Other studies has identified the OH group at the wavenumber at 3300cm-1 , 2970cm-1 and 2856cm-1; meanwhile C=C at 1644cm-1.
Previous studies shown that appropriate application of statistical analysis or chemometric has provides accurate and rapid characterization of plant extract based on analytical spectroscopy that contain multidimensional information [35]. The correlation factors obtained from the PCA analysis within a set of observed variables provides the pattern of the sample [36]. Henceforth, with the application of PCA, the spectrum analysis can be performed for rapid and easier identification.
The application of PCA from the FTIR spectrums has successfully discriminated the Romanian sea buckthorn berries and leaves groups based on its phenolic contents [37]. Correlation between the content of flavonoid in certain frozen fruits pulps with free radical scavenger activity has been identified using the PCA [38]. From the study, flavonoid has shown to exhibit high scavenging activity against hydroxyl radical.
3. Methodology
The main purpose of this study is to develop an algorithm for flavonoids identification utilizing the PCA based on FTIR spectrums. Therefore, following were the steps performed to achieve the objectives.
3.1. FTIR Measurements
Samples of three flavonoids (flavone, flavanone and flavonol) in powder form were purchased from Bumi Pharma Sdn Bhd (Malaysia) that was imported from Sigma Aldrich (UK).
The flavonoids were sent to Centre for Research and Instrumentation, Universiti Kebangsaan Malaysia for FTIR analysis.
- Spectrum 400 FT-IR, Perkin Elmer was used for the sample analysis. The wavenumber range set for the FTIR is 4000-650 cm-1 which is under mid infrared region. The FTIR was performed using the ATR (Attenuated Total Reflectance) where the solid samples (in powder form) were directly applied to the plate for measurements.
- Using the built in algorithm provided from software package of FTIR, the spectrum was preprocessed using baseline correction to produce horizontal baseline shift and smoothing to reduce the noise.
- The preprocessed data extracted in Excel form which consists of absorbance versus wavenumber (cm-1) was recorded for statistical data analysis.
3.2. Statistical Data Analysis
- Data matrix, Xn where (n=1…x) which comprises of transposed data matrix of all flavonoids spectrum under selected wavenumber region (n), was analyzed with PCA on a MATLAB platform.
- Commonly data preprocessing procedures such as standardization and normalization are required prior to performing PCA on a data matrix. Standardization is used to center and scale the data meanwhile normalization is generally used for data which have different units and scale. In this study, only standardization was performed since the data have same units. Figure 2 shows the configuration of the data matrix X, mxp (types of flavonoids x spectral range).
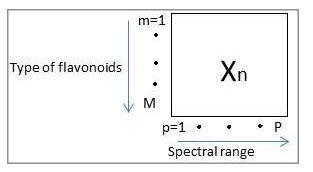
Figure 2: Two dimensional array, Xn of spectrum where n=1…N that represent the number of region, m=1…M that represent type of flavonoids and p=1…P that represent the spectral range. The weighted used for the data is the absorbance value of spectral data corresponds to the wavenumber range. - The similarities and differences based on chemical structure of the flavonoids provide a basis for the flavonoids characterization based on functional group identification offered by FTIR. The molecules that have same functional group will have the peak at the same wavenumber range regardless the rest of the molecules; however differ in wavenumber shift in the wavenumber range due to the whole structure arrangement. Henceforth, the wavenumber shift and the presence of the peak at certain wavenumber region provide the basis for flavonoids structure classification.
- Eight significant regions were assigned in Table for the identification of flavonoids based on their chemical structure. The similarities and differences identified from the PCA were further utilized for development of algorithm for flavonoids identification using nested if else statement as in Figure 6.
Region Wavenumbers (cm-1) Structural identification References 1 4000-3250 Presence of hydroxyl group [22] 2 3140-3000 Presence of di-substitution [22] 3 1670-1620 Unsaturation bonds [22] 4 1650-1600 Conjugation of bonds [22] 5 1600-1500 Aromaticity [22] Table: Five regions assigned for classification of flavonoids under PCA
4. Results
Figure 3 shows the FTIR spectrum for flavone, flavanone and flavonol. From the FTIR spectrum shown in Figure 3, each of flavonoids shows different spectrum due to different structure arrangement. Different peak positions, intensities, widths and shape shown in Figure 3 indicate the structure difference of flavonoids subgroups hence used for the band assignments as in Table.
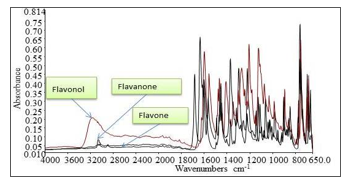
Figure 3: FTIR spectrum in mid IR range for flavonol, flavone and flavanone As seen in Figure 3, the FTIR spectrum of molecules differs at certain wavenumber range even though the molecules have the same functional groups. The presence of hydroxyl group, compared to the other flavonoids for example, will cause the wavenumber shift at particular wavenumber range. Besides that, the overall structure arrangement such as the presence of different substitution will cause wavenumber shift hence producing different spectrum. That is why, the FTIR is powerful method for identification since no different molecules will have same the spectrum; it is the fingerprint data for the molecule.
Five significant regions have been assigned in Table for their identification based on its structural difference as in Figure 5. Figure 4 shows the results of PCA analysis of flavonoids spectrum based on the assigned regions.
In PCA analysis, the correlation factors that contribute by the PCA analysis provide the pattern of the samples. The sample that is close to each other indicates their similarities meanwhile far to each other indicate their differences. This pattern of analysis provides clear discrimination between samples as a tool of identification.
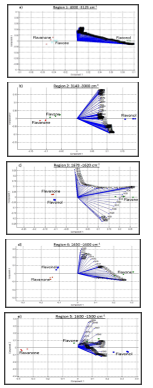
Figure 4. Results of PCA for flavonoids in the region 1 (4a), region 2 (4b), region 3 (4c), region 4 (4d) and region 5 (4e) 5. Discussion
. Flavonoids aglycone can be divided into few subgroups which are flavanone, flavonol, flavone, flavanol, anthocyanidin and isoflavonoid [39]. For flavanone, flavonol and flavone, their variation within the groups is depending upon the presence of OH group at C-3, a saturated single bond between C-2 and C-3, and their conjugation and saturation behavior as in Figure 5 [40].
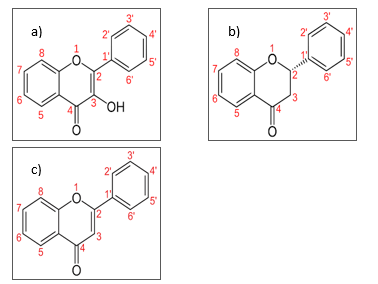
Figure 5. Structure of flavonoids subgroups, a) flavonol b) flavanone c) flavone The differences exhibit by the flavonoids subgroups structure has lead to different spectrum shown in Figure 3 and results of PCA shown in Figure 5.
Based on Figure 4, the identification of flavone, flavanone and flavonol are focusing on the heterocyclic ring C that represents the major structural difference between the flavonoids. Based on Table, 4000-3125 cm-1 has been identified for the presence of hydroxyl group in flavonoids, 3140-3000 cm-1 for the presence of di-substitution of heterocyclic ring C, 1670-1620 cm-1 and 1650-1600 cm-1 for the saturation and conjugation of bonds respectively. Meanwhile, 1600-1500 cm-1 indicates the general aromaticity behavior of the flavonoids.
For flavonol, the presence of hydroxyl group at carbon 3 and di-substitution of heterocyclic ring C at carbon 2 and 3 provides the distinct characteristics of structure arrangement as compared to flavanone and flavone. Based on Figure 4 (a) and (b), for region 1 and 2, clear discrimination shown by PCA analysis on flavonol at wavenumbers 4000-3125 cm-1 and 3140-3000 cm-1due to the presence of hydroxyl group and di-substitution at carbon 2 and 3 respectively as compared to flavanone and flavone.
Once the flavonol is identified, the flavanone and flavone is identified and distinguish based upon their saturation and conjugation bond as in Figure 5. Based on Figure 5, flavanone contain saturated carbon at 2 and 3 meanwhile, the flavone contain unsaturated carbon at 2 and 3. Besides, compared to flavanone, the conjugation of bond particularly presence in flavone. The arrangement of saturation and conjugation characteristics of flavonol that similar to flavanone provides the discrimination between the flavone as compared to flavonol and flavanone. Based on Figure 4 (c) and (d) in region 3 and 4, clear discrimination is shown by the PCA analysis on flavone at wavenumbers 1670-1620 cm-1 and 1650 -1600 cm-1 due to unsaturation and conjugation bonds respectively, as compared to flavanone.
The aromaticity characteristics of the flavone, flavonol and flavanone are differs due to their structure arrangement as in Figure 5 that can be an indication of their individual differences. Based on Figure 4(e) in region 5, clear discrimination is shown by PCA analysis on flavanone, flavone and flavonol due to their aromaticity at wavenumbers 1600-1500 cm-1 that provides their individual difference.
The significant region based on the structural information of the compounds provides the algorithm for the characterization model as shown in Figure 6. The application of PCA is integrated into the model to provide rapid identification of flavone, flavanone and flavonol.
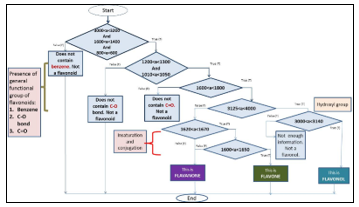
Figure 6. Flow diagram of characterization model algorithm where a is refer to absorbance value The main contribution in this study is, despite other method which utilized much equipment and statistical method for identification and confirmation, with further exploitation on PCA methodology and the informative spectrum data provided by FTIR which not yet fully utilize, will provides the simple, easier, accurate, less expensive and rapid identification of flavonoids subgroups. The selected region based on PCA will provides significant identification of flavonoids based on its structure arrangement. Henceforth, the isolation procedure for example, will be less time consuming and identification of flavonoids presence in fruits and plants can be optimized.
6. Conclusion and recommendation
Application of PCA into the characterization model for rapid identification of flavonoids based on the FTIR spectrums was presented. The results shown that clear discriminations of flavonoids shown at wavenumbers 4000-3125 cm-1 and 3140-3000 cm-1 for flavonol, 1670-1620 cm-1 and 1650-1600 cm-1 for flavone and 1600-1500 cm-1 for individual flavonoids.
The research is still in progress where some individual flavonoids subgroups derivatives such as quercetin, myricetin and luteolin to name a few, were tested under the selected regions for flavonoids characterization and identification.
Besides, further exploitation on the advantages offered by PCA methodology will be performed; for example the studies on contribution plot and confidence limit provided by PCA to enhance and validate the results.
It is recommended that further studies to be performed on the identification of other flavonoid subgroups using proposed method to enhance the identification of flavonoids that is widely distributed in plants and fruits.
- C. H. C. Noh, N. F. M. Azmin, A. Amid, A. L. Asnawi, S. N. Ibrahim, “Development of Algorithm for Flavonoids Classes Characterization” in 14th International Conference Student on Research and Development, Kuala Lumpur Malaysia, 2016.
- S. K. Kumar, M. Suresh, S. A. Kumar, P. Kalaiselvi, “Bioactive compounds, radical scavenging, antioxidant properties and FTIR spectroscopy study of Morinda citifolia Fruit Extracts” International Joutnal of Current Microbiology and Applied Science, 28-42, 2014.
- X. Gao, A. Cassidy, E. B. Rimm, A. Ascherio, “Habitual intake of dietary flavonoids and risk of Parkinson disease” AAN Enterprise, Inc., 1138-1145, 2012.
- A. Cassidy, T. Huang, M. S. Rice, E. B. Rimm, S.S. Tworoger, “Intake of dietary flavonoids and risk of epithelial ovarian cancer” American Society for Nutrition, 1-8, 2014.
- S. L. Xu, C. W. C. Bi, R. C. Y. Choi, K. Y. Zhu, A. Miernisha, T. T. X. Dong, K. W. K. Tsim, “Flavonoids induce the synthesis and secretion of neurotrophic factors in cultured rat astrocytes: A signaling response mediated by estrogen receptor” Hindawi Publishing Corporation, 1-10, 2013.
- S. Dharmaraj, “Marine Streptomyces as a novel source of bioactive substances” World J Microbiol Biotechnol, 2123-2139, 2010.
- O. M. Andersen, K. R. Markham, Flavonoids: Chemistry, Biochemistry and Applications, Boca Raton: CRC Press, 2006.
- P.F. Pinheiro, G. C. Justino, “Structural analysis of flavonoids and related compound: A review of spectroscopic applications” in Phytochemicals-A Global Perspective of Their Role in Nutritrion and Health, D. V. Rao, Eds. Europe: InTech, 33-56, 2012.
- S. Sasidharan, Y. Chen, D. Saravanan, K.M. Sundram, L. Y. Latha, “Extraction, isolation and characterization of bioactive compounds from plants’ extracts” Afr J Tradit Complement Altern Med., 8(1), 1-101, 2011.
- S. Durum, R. N. Allam, M. A., A. S. E. Shazely, “Identification of phenolic acids and flavonoids compounds from some varieties Triticum Aestivum and Triticum” 6(3), 521-530, 2016.
- Z. Daqiu, T. Wenhui, H. Zhaojun, T. Jun, “Identification of flavonoids and expression of flavonoid biosynthetic genes in two coloured tree peony flowers” Biochemical and Biophysical Research Communications,450-456, 2015.
- W. Lingrong, W. Dan, J. Yueming, P. N. K., L. Sen, J. Guoxiang, H. Jirui, Z. Mouming, L. Wei, Y. Bao, “Identification of flavonoids in litchi (Litchi chinensis Sonn.) leaf and evaluation of anticancer activities” Journal of Functional Food, 555-563, 2014.
- K. Samariya R. Sarin, “Identification of flavonoids from Cyperus Rotundus Linn. in vivo and in vitro” Journal Of Drug Delivery & Therapeutics, 3(2), 109-113, 2013.
- Y. S Park, B. G. Heo, K. S. Ham, S. G. Kang, Y. K. Park, A. Nemirovski, “Analytical determination of bioactive compounds as an indication of fruit quality” Journal of AOAC International, 1725-1731, 2012.
- T. S. Preetha, S. N. Mohan, N. M. P., S. R. Deepthi, “Chemical fingerprinting of Spilanthes Scmella L.(Murr.) – An acutely theatened medicinal plant of pharmaceutical importance by HPLC, FTIR and UV-VIS spectoscopic tools” World Journal of Pharmacy and Phamaceutical Sciences, 1275-1287, 2014.
- R. Sahu, J. Saxena, “Ultraiolet-Visible and Fourier Transform Infrared Spectroscopic studies on non-conventional species of Curcuma” Indian Journal of Advances in Chemical Science, 300-302, 2014.
- S. Dharmaraj, “Marine Streptomyces as a novel source of bioactive substances” World J Microbiol Biotechnol. 2123-2139, 2010.
- D. Mrinmay, K. Ashok, D. Jyotirmoy, S. R. Durga, “Isolation and characterization of a flavonoid from ethanolic extract Of Portulaca Quadrifida Linn” American Chemical Society, 5 (1) , 13-20, 2017.
- K. S. Amit, S. Raghvendra, S. Manimegalai, “Identification of flavonoids in methanolic extract of Caryota urens (Fish Tail Palm): A phytochemical screening involving structure analysis by FTIR spectroscopy” Research Journal of Phytochemistry, 9 (3), 127-136, 2015.
- S. Ranjana, D. M. Vijay, “FTIR studies and spectrophotometric analysis of natural antioxidants, polyphenols and flavonoids in Abutilon indicum (Linn) Sweet leaf extract” Journal of Chemical and Pharmaceutical Research, 7(6),205-211, 2015.
- M. Martinez, T. Velazquez, G. Revilla, N. Abarca, and E. Perez, “Application of MIR-FTIR spectroscopy and chemometrics to the rapid prediction of fish fillet quality” CyTA Journal of Food, 369-377, 2014.
- B. C. Smith, Infrared Spectral Interpretation: A Systematic Approach, United States: CRC Press, 1999.
- A. A. F. Zielinski, C. W. I. Haminiuk, A. Alberti, A. Nogueira, I. M. Demiate, and D. Granato, “A comparative study of the phenolic compounds and the in vitro antioxidant activity of different Brazilian teas using multivariate statistical techniques” Food Research International, 246-254, 2014.
- G. Seher, S. Mete, G. Erik, K. Irfan, S. Feride, “Differentiation of Anatolian honey samples from different botanical origins by ATR-FTIR spectroscopy using multivariate analysis” Food Chemistry, 234–240, 2015.
- I. Gouvinhas, J. M. M. M. D. Almeido, T. Carvalho, and A. I. R. N. A. Barros, “Discrimination and characterisation of extra virgin olive oils from three cultivars in different maturation stages using Fourier transform infrared spectroscopy in tandem with chemometrics” Food Chemistry, 174-226, 2015.
- A. Hirri, M. Gammouh, A. Gorfti, F. Kzaiber, M. Bassbasi, S. Souhassou, and A. Balouki, “The use of Fourier transform mid infrared ( FT-MIR ) spectroscopy for detection and estimation of extra virgin olive oil adulteration with old olive oil” Sky Journal of Food Science, 60–66, 2015.
- M. Martinez, T. Velazquez, G. Revilla, N. Abarca, and E. Perez, “Application of MIR-FTIR spectroscopy and chemometrics to the rapid prediction of fish fillet quality” CyTA Journal of Food, 369-377, 2014.
- M. Traore, K. Joeri, and M. C. Antonio, “Application of FTIR spectroscopy to the characterization of archeological wood” Spectrochimica Acta Part A: Molecular and Biomolecular Spectroscopy, 63-70, 2016.
- R. M. Pop, A. D. Buzoianu, I. V. Rati, and C. Socaciu, “Untargeted metabolomics for sea buckthorn (Hippophae rhamnoides ssp. carpatica) berries and leaves : Fourier Transform Infrared spectroscopy as a rapid approach for evaluation and discrimination” Not Bo Horti Agrobo, 545-550, 2014.
- S. A. Kustrin, D. W. Morton, and A. P. Md. Yusoff, “The use of Fourier Transform Infrared (FTIR) spectroscopy and Artificial Neural Networks (ANNs) to assess wine quality” Modern Chemistry & Applications, 2329-6798, 2013.
- M. Rochana, R. Rishob, G. Subham, M. Sougata, “Synthesis characterization and study of antioxidant activity of luteolin – magnesium complex “ 21-26, 2016.
- J. Joby, S. Sudheesh, K. T. M. Sumesh, J. Sony J, J. V. E., “A comparative evaluation of anticancer activities of flavonoids isolated from mimosa pudica, aloe vera and phyllanthus niruri against human breast carcinoma cell line (mcf-7) using mtt assay” International Journal Of Pharmacy And Pharmaceutical Sciences, 6 (2), 2014.
- N. Rajalaxm, P. Ashok, S. Luna, S. Santilata, “Phytochemical analysis of antioxidants from abutilon indicum l. and paederiafoetida l. supported by TLC, FTIR and NMR studies” International Journal of Science and Research (IJSR), 1312-1318, 2015.
- S. M. Manki, A. A. Omotayo, G. L. B. Priscilla, T. M. Wilfred, J. Nazeem, A. S. Everlyne, I. I. Emmanuel, “Electroanalytical determination of catechin flavonoid in ethyl acetate extracts of medicinal plants” Int. J. Electrochem. Sci., 4, 1497 – 1510, 2009.
- G. Royston, V. Y. Emma, K. H. James, M. S. Ian, “Chemometric discrimination of unfractionated plant extracts analyzed by electrospray mass spectrometry” Phytochemistry, 859–863, 2003.
- S. Kallithraka, I. S. Arvanitoyannis, P. Kefalas, and A. El-zajouli, “Instrumental and sensory analysis of Greek wines; implementation of principal component analysis ( PCA ) for classification according to geographical origin” Food Chemistry, 501-514, 2001.
- Pop, R. M., Buzoianu, A. D., Rati, I. V., Socaciu, C., “Untargeted metabolomics for sea buckthorn (Hippophae rhamnoides ssp. carpatica) berries and leaves : fourier transform infrared spectroscopy as a rapid approach for evaluation and discrimination” Not Bo Horti Agrobo, 545-550, 2014.
- L. C. Vissotto, E. Rodrigues, R. C. Chisté, M. D. T. Benassi, and A. Z. Mercadante, “Correlation , by multivariate statistical analysis , between the scavenging capacity against reactive oxygen species and the bioactive compounds from frozen fruit pulps” Food Science and Technology, 57–65, 2013.
- S.V. Knezevic, B. Blazekovic, M. B. Stefan, M. Babac, “Plant polyphenols as antioxidants influencing the human health” in Phytochemicals as Nutraceuticals- Global Approach to Their Role in Nutritrion and Health, D. V. Rao, Eds. Europe: InTech, 155-180, 2012.
- J.K. Praisan, C. C. Wang, S. Barnes, “Mass spectrometric methods for the determination of flavonoids in biological samples” Free Radical Biology & Medicine., 37, 1324-1350, 2004.