Synthesis of Important Design Criteria for Future Vehicle Electric System
Synthesis of Important Design Criteria for Future Vehicle Electric System
Volume 2, Issue 3, Page No 277-283, 2017
Author’s Name: Lisa Braun1,a), Eric Sax2
View Affiliations
1Ph.D. Candidate, Institute for Information Processing Technologies, Karlsruhe Institute of Technology, Germany
2Professor, Institute for Information Processing Technologies, Karlsruhe Institute of Technology, Germany
a)Author to whom correspondence should be addressed. E-mail: lisa.braun@partner.kit.edu
Adv. Sci. Technol. Eng. Syst. J. 2(3), 277-283 (2017); ![]() DOI: 10.25046/aj020337
DOI: 10.25046/aj020337
Keywords: e/e-architecture, Design criteria, Vehicle electric system design

Export Citations
In this article, we give a brief overview of future trends and corresponding stakeholder requests regarding the design of automotive electric and electronic (e/e)-architectures. While today’s optimization is mainly based on the static design criteria of unit costs and weight, three dynamic design criteria are considered decisive factors in the future: voltage stability, vehicle energy consumption and total cost of ownership. It is shown, how quantitative values for each criterion can be derived, on basis of which different designs of a potential future power supply system could be evaluated. Subsequently, their potential influences on the future system design is discussed.
Received: 05 April 2017, Accepted: 02 May 2017, Published Online: 14 May 2017
1. Introduction
This paper is an extension of work originally pre-sented in the 4th International Conference on Elec-trical Systems for Aircraft, Railway, Ship propulsion and Road Vehicles and International Transportation Electrification Conference [1] The focus of [1] is to summarize the results of guided expert interviews on future trends, associated hurdles and requirements of the electric and electronic (e/e)-architecture.
The design of the e/e-architecture of vehicles faces many challenges. The information and communica-tion system has to manage and distribute an amount of data that is rapidly growing due to digitization and new functionalities, while the energy distribution system has to provide sufficient energy to securely supply the growing number of electrical components. This growing number of components, functions and connections makes system complexity ever-increasing
- This also means that development expenditures are growing significantly. Over 40% of the develop-ment expenses of a luxury vehicle is related to e/e [2].
The expert interviews were designed to find out which trends the e/e-architecture will shape in the future, and whether and how the design criteria for development will change. Considering these results, we are expanding our work by synthesizing design criteria that will be important in the future, focus-ing on the power supply system as part of the e/e-architecture. These criteria are based on the trends and the overview given in [1]. We also discuss the ef-fects of such a change in design criteria on the devel-opment of vehicles, and in particular the design of the energy distribution system in the future. This paper is organized as follows: section two dis-cusses current trends concerning the e/e architecture. Section three summarizes important stakeholder re-quests on the design of e/e-architectures. While de-sign criteria that are considered important for future power supply systems are synthesised in section four. Examples show their possible impact on design. Sub-sequently section 5 discusses their influence on future system design. The final section shows conclusions and future works.
2. Trends Concerning the Vehicle Electric System
Today, autonomous driving is one of the most impor-tant trends in the automotive industry. Last year, the number of companies testing autonomous vehicles in California doubled. By March 2017, 27 companies re-ceived Autonomous Vehicle Testing Permits from Cal-ifornia Department of Motor Vehicles.
What is more, in recent years, a change in the mo-bility behaviour can be observed in all the countries of the Triad [3]. In 2015, the number of registered car sharing users in Germany amounted to 1.26 mil-lion already, equating to a six-fold increase since 2011
- This strong growth might even be reinforced even more by the introduction of autonomous vehicles. A possible combination of apps like SMILE, GoogleNow, and e-hailing with autonomous vehicles promises to create ideal robot taxis as part of a multimodal mobil-ity concept to implement mobility as a service [5].
To allow autonomous manoeuvres, an exact envi-ronment model and thus a large number of sensors for environment detection on board the vehicle are necessary. Moreover, networking with other vehicles and the infrastructure is a precondition to avoid dan-gers on the route [1]. Both lead to yet another sig-nificant increase in the amount of data on board [6]. In addition, they must not fail during driving in or-der to ensure safe operation of the vehicle. Therefore, the power supply needs to provide at least two inde-pendent sources, so that the supply of these safety-relevant components is at no time endangered.
To allow for the provision of this growing power demand, a multi voltage power supply is seen as cer-tain. With the 12 V electrical system limited to 3:6 kW maximum power, it became increasingly difficult to provide the growing power demand of new functions such as active roll stabilization (ARS) [7]. The intro-duction of an additional 48 V level shall solve that problem [8].
Further, it is cheaper as high-voltage systems in hybrid vehicles as it is still below 60 V, which means no additional isolation is necessary. The higher volt-age also allows a reduction of cable cross sections while the efficiency of the distribution increases. The weight of the cable harness could be further reduced by using semiconductors instead of fuses and relays
3. Stakeholder Requests
About 90% of the surveyed experts mention costs as an important design feature of the established e/e-architecture, followed by 80% naming weight. Thus, these two criteria are clearly mentioned most fre-quently, see also Figure 1 [1].
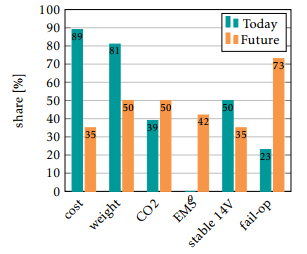
Figure 1 Significance of today’s and future requirements concerning the e/e-architecture.
Concerning future design criteria, however, this picture changes. While the importance of cost and weight sink to 35% and 50%, over 73% of the experts think a fail-operational design is important. Another criterion for safe operation, the stability of the voltage, is considered important in future design by at least one third of the experts. The reference to the reduc-tion of carbon emissions increases from 39% to 50%. In addition, about 40% of the experts are asking for an energy management system (EMS) for the future, while it does not seem to matter at all [1].
The focus on fail-operational is due to current de-velopments in driver assistance with the aim of in-tegrating autonomous driving. Failures are not ac-ceptable and must therefore be prevented by a cor-responding design of the system, mostly realized by redundancy mechanisms. An example how this could be realized for the information and communication architecture is the developed centralized platform computer of the RACE project [10]. A fail-operational power supply is realized through at least two inde-pendent power sources [11]. While this applies to an electric vehicle with DC/DC-converter and one bat-tery in the low-voltage network, sailing with switched off combustion engine or start-stop mode would lead to a system with only one source, if only one battery is installed additionally to the generator [7].
What is more is that voltage stability must be guar-anteed even with fast load changes and high power peaks. An EMS could therefore contribute to the sta-bilization of the voltage as well as the reduction of the consumption and associated emissions.
However, the experts’ answers do not allow any conclusion as to whether these changes in the values are due to actual changes in the prioritization or due to the current trends and associated expected future problems. In the case of costs in particular, it seems questionable whether their significance in the future will actually decrease so clearly. Nevertheless, these figures allow conclusions to be drawn on expected changes in the development. In the following, impor-tant future design criteria of the power supply system are derived from this selection.
4. Synthesis of Important Design Criteria
Not technical aspects are the main problem for achieving future solutions but legacy restrictions and fixed corporate structures, which go along with the structure of the vehicle’s e/e-architecture [1]. Design criteria that consider future changes can help to weigh up possible solutions in the early stages of develop-ment. Therefore, the aim of the derived design pa-rameters is to provide the advantages and disadvan-tages of the various designs of the power supply sys-tem even in an early development phase. For this rea-son, they must provide measurable target variables, with the aid of which different designs can be evalu-ated and an optimal solution can be derived. Firstly, to guarantee the safe operation the voltage stability must be guaranteed. This is an essential con-straint for the integration of safety-relevant functions. Although fail-operational is of great importance for the design of future e/e-architectures due to the re-sults in [1], no corresponding evaluation criterion is developed in the following. In addition to the require-ment of a redundant power source, an isolated view of the power supply system does not seem to make sense. Rather, an intelligent combination of measures in the communication and power supply network can save required redundancy effort, e.g. through a com-bination of powerline communication and power over dataline for safety-relevant components [12]. Secondly, at the latest since the diesel-gate, vehi-cle emissions have been the focus of attention. Weight reduction as well as higher efficiency of the power dis-tribution or reduction of the power consumption e.g. through EMS can help to reduce the energy consump-tion of the vehicle as well as the corresponding emis-sions. There is a conflict, however, between a light weight wire harness with small cable cross-sections and the achievement of minimal power losses through the distribution, as small cross-sections increase the cable resistance. In order to find an optimum com-promise, the vehicle consumption is therefore chosen as a further design criterion. Finally, today the costs per function must be min-imal. We expect this to change in the future due to the growing volume of car sharing and stricter emis-sion limits. Operators of car sharing fleets are less interested in the purchasing prize than in the total cost of ownership. Simultaneously, the operating time and thus the influence of the travel costs on the total cost of ownership increases. For this reason, not only development and production costs but also operating costs must be taken into account in minimizing costs in the future.
4.1 Voltage Stability
For safe operation of e/e-systems, it is important that the voltage limits of 11 V and 16 V are maintained at the sinks, otherwise the functionality is not, or only partially, provided. Via the buffer of the voltage to these limits, for example, in an extreme driving sce-nario, it is possible to compare different configura-tions of the power supply system [13].
The disadvantage of this method is that it does not provide any information about the temporal be-haviour of the voltage. The minimally determined value could be anything between an outreach and a constant curve or a broadband noise within the deter-mined range. Conclusions on the scattering can, for example, be drawn with the so-called quantiles. This is a method of statistics in which an ordered data series is split into two equal halves by the median. The box plot can thus be formed over the interquartile distance be-tween the 25% quantile and the 75% quantile. The median indicates which voltage level the curve varies, and the size of the box between the 25% value and the 75% value shows how strong this variation is. Alternatively, the standard deviation s based on the empirical variance can be used as a further method of statistics for evaluation. It indicates the average deviation of the measured values xi from the mean value x¯ of n data points. The smaller the stan-dard deviation, the more stable is the curve of the volt-age for the observed time interval. The standard devi-ation is calculated as follows [14]: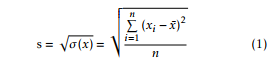
Figure 2 shows voltage curves with varying volatility. The blue curve shows a strong fluctuation around 12V. The green curve fluctuates considerably less by 14V. The orange curve includes a voltage jump after 300s. Before the jump, it is comparatively stable at 11V, then stable at 14V. Figure 3 shows that for the blue and green curves the fluctuation and its corre-sponding voltage level can be represented well with the box plot. However, the jump of the orange curve is not evaluated correctly. The values before the jump are considered as outreach and therefore this curve appears incorrectly as the most stable.
If the mean value is replaced by the system volt-age of 14:3 V the standard deviation in figure 4 can as well consider the voltage level in the evaluation. Fig-ure 4 shows that the standard deviation, in contrast to the box plot, correctly reflects the stability of the voltages in figure 2 and the green voltage curve is cor-rectly recognized as the most stable followed by the orange. Therefore, the standard deviation appears to be a suitable parameter to evaluate voltage stability.
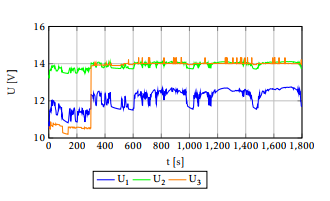
Figure 2 Voltage curves with variing volatility.

Figure 3 Box plots of shown voltage curves.
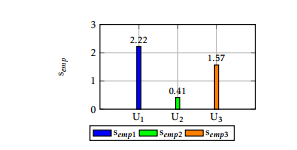
Figure 4 Standard deviation of shown voltage curves.
| 4.2 Vehicle Energy Consumption |
| In Europe, the allowed CO2-emissions will be reduced to 95 gCOkm2 by 2020, while the full fines will reach 95 eg |
| from 2019 onward [15]. What makes it even more dif-ficult is the fact that from 2020 onwards a new test method with a realistic driving cycle, the Worldwide harmonized Light duty driving Test Cycle (WLTC), for the determination of the emissions takes effect. It is expected that the discrepancy between the actual consumption and the calculated standard values will drop from an average of about 45% in 2015 to 23% in 2020 [16]. Conversely, this means that if the ac-tual consumption is constant, the measured standard emissions are increased by 22%. |
| One reason for this is the fact that the consump-tion optimization of the vehicles to the unrealistic, static speed profile of the previous New European Driving Cycle (NEDC), no longer takes effect. With-out the untypically high dead times and frequent stops, the previous high influence of consumption-reducing measures such as start-stop-automatic and downsizing is reduced [17]. Other factors such as weight reduction and the reduction of transmis-sion losses in the power supply network are instead brought into the focus. |
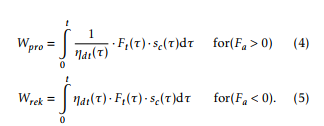
| The specific vehicle consumption BsV per 100 km can be calculated as a function of the distance trav-elled sc and the needed propulsion energy Wpro and recuperation energy Wrek. If no recuperation is inte-grated, Wrek is zero. |
The total drive resistance Ft is composed of several values: the rolling resistance Fr , the slope resistance Fs, the air resistance Fl and the acceleration resistance Fa which are calculated as follows [18]:
| Ft | = Fr (mveh) + Fs(mveh) + Fl (vc(t)) + Fa(mveh; a(t)) | (6) | ||||||||||||||
| Fr | = mveh g cr | (7) | ||||||||||||||
| Fs = mveh g sin( (t)) | (8) | |||||||||||||||
| 1 | l cW Aveh vc(t)2 | |||||||||||||||
| Fl = | (9) | |||||||||||||||
| 2 | JW h + i2 JEn | ! | ||||||||||||||
| F | a | = F | a:trans | + F | a;rot | = a(t) | m | veh | + | (10) | ||||||
| rstat rdyn | ||||||||||||||||
The rolling resistance Fr and the slope resistance Fs
depend on the vehicle weight mveh and the gravity g. The coefficient cr takes into account the walk losses
which occur on the road. indicates the slope angle of the street. The air resistance Fl is calculated from
the front surface Aveh, the air density l , the air drag coefficient cW , and the air inflow velocity vc(t) of the
vehicle. The resistance Fa, which is dependent on the acceleration a, consists of a weight-dependent transla-tory part and a rotational part. The latter depends on the moment of inertia of the wheels JW h and engine
JEn, the translation i and the static rstat and dynamic rdyn free radius.
The energy consumption of the electrical compo-nents and the power distribution WE can be deter-mined either by measurement in a test stand or, es-pecially in early development phases, by means of a model-based analysis. In both cases, an operating model of the loads Pi (t) is required to determine the energy consumption, as it fixes the current flow and thus the losses PV ;dst(t) during transmission. What is more, in a vehicle with an internal combustion engine
- (ICE), the efficiency of the drive d and the efficiency of the generator g must be considered. In the case of an electric vehicle, this would instead be the efficiency of the high voltage battery and the DC/DC-converter. In order to determine the specific consumption BsE, the values have to be converted to a distance of 100 km analogous to the driving consumption
| (3) | WE = | t | 1 | 0 | n | Pi ( ) + PV ;dst( ) | 1 | d (11) | |||||
| Z | d ( ) | g ( ) | i=1 | ||||||||||
| 0 | B | X | C | ||||||||||
| B | C | ||||||||||||
| 100 | B | C | |||||||||||
| B | C | ||||||||||||
| B | C | ||||||||||||
| BsE = WE | @ | A | (12) | ||||||||||
| sc | |||||||||||||
The sum of both specific consumption values pro-vides the total consumption of the vehicle, which is to be optimized.
280
- Braun et al. / Advances in Science, Technology and Engineering Systems Journal Vol. 2, No. 3, 277-283 (2017)
Table 1 Vehicle data of a small car (A), a SUV (J) and an electric luxury car (F).
| Parameter | unit | A | J | F | ||||
| propulsion | ICE | ICE | electric | |||||
| weight | [kg] | 885 | 2,435 | 2,000 | ||||
| standard | [ | kW h | ] | 38.7 | 80.84 | 22.04 | ||
| consumption | 100km | (=4:5l) | (=9:4l) | |||||
| standard | [ | gCO2 | ] | 93 | 218 | 0 | ||
| km | ||||||||
emission
The given standard values in table 1 are mea-sured with the established New European Driving Cy-cle (NEDC). Assuming that both ICE-vehicles would be 50 kg lighter, the power consumption per 100 km of the small car could be reduced by 0:89 kWh and the standard emissions by 2:4 g. For the SUV, the consumption would drop by 0:91 kWh which would lead to 2:45 g less emission per km. In comparison, the high efficiency of the electric drive train with 3:71 kWh enables a significantly higher reduction in consumption by weight reduction. These values are calculated in MATLAB with the given equations (2) to (10) and the cycle data of the NEDC.
To calculate the equivalent electrical energy con-sumption during the NEDC, an average speed of 33.6 kmh is assumed. It is further assumed that the effi-ciency of the ICE is 35%, the efficiency of the genera-tor is 75%, while the efficiency of the high-voltage bat-tery and the DC/DC-converter is 95%. Under these circumstances a reduced electrical energy consump-tion of 78 W for the small car, 80 W for the SUV and 1125 W for the electric car would have the same effect.
4.3 Total Cost of Ownership
Since, on the one hand, the permissible emission limit values GCO2;0 fall, and on the other hand, higher stan-dard values are to be expected by the more realistic determination in the future, the deviating develop-ment costs of alternative designs are estimated with the help of CO2-emission penalties.
The allowed emission limit GCO2 of a vehicle is cal-culated depending on its weight mveh and the weight correction factor m0 [15]:
GCO2 = GCO2;0 + 0:0457 (mveh m0). (13)
For each automobile manufacturer its fleet limit value is calculated with the individual emission limit of their different vehicle models and their sales fig-ures. If the fleet emission exceeds this value, a penalty of e95 will be due for each gram from 2019 onwards.
The production costs can be estimated from the sum of the material costs of the power supply sys-tem. Furthermore, the operating costs can be deter-mined from the specific driving consumption and the respective energy costs of the vehicle. Taxes for petrol vehicles in Germany are also dependent on the spe-cific CO2-emissions and the engine displacement of the vehicle.
Table 2 Emission penalties and annual travel costs of the example vehicles at a running distance of 36,500km a year.
| Parameter | unit | A | J | F | |||||||
| propulsion | ICE | ICE | electric | ||||||||
| allowed | [ | gCO2 | ] | 72.74 | 143.58 | 123.7 | |||||
| emission limit | km | ||||||||||
| emission | [e] | 1,735 | 7,070 | 0 | |||||||
| penalty per | |||||||||||
| car in 2019 | |||||||||||
| cost energy | [ | e | ] | 0.1605 | 0.1605 | 0.2869 | |||||
| kW h | |||||||||||
| specific cost | [ | e | ] | 6.21 | 12.97 | 6.32 | |||||
| 100km | |||||||||||
| Travel | [ | e | ] | 2,267 | 4,736 | 2,308 | |||||
| a | |||||||||||
| expenses per | |||||||||||
| year | |||||||||||
| taxes | [ | e | ] | 198 | 496 | 0 | |||||
| a | |||||||||||
(Germany)
Table 2 shows the associated costs of the three ve-hicles given in table 1. First of all, table 2 shows that considering the weight correction factor of 1,372 of the year 2016, the emission limit of 95 gCO2 per km, and today’s standard emission, both vehicles with in-ternal combustion engine are significantly above the emission limit. Considering the new test procedure mentioned above, the high penalty per sold vehicle could rise even further. The annual taxes calculated in Germany are also dependent on CO2-emissions and therefore are the highest for the SUV.
For the comparison of different alternatives of the power supply network, an additional statistical calcu-lation of the service costs is dispensed with since it is assumed that due to the low failure rates of electrical systems these will be similar for all alternatives.
- Influence on Future System De-sign
While existing evaluation criteria such as unit costs and weight are static and can therefore be determined directly from the system design [19], all design crite-ria defined here depend on the dynamic operation of the vehicle and the electrical loads. Consequently, an operational model is essential for the determination of these criteria.
In order to evaluate the stability of the voltage, a worst-case scenario appears to be fitting, as is cur-rently used when designing the energy source. How-ever, for an accurate determination of the energy con-sumption and operating costs, the operation has to be taken into account over a longer period of time, as the ambient conditions such as light, weather and tem-perature change substantially over the course of a year and thus the use of the electrical loads varies. The cre-ated operating models of the loads must allow to ad-just the environmental conditions, the route, and the driver in order to simulate the energy consumption of
www.astesj.com 281
- Braun et al. / Advances in Science, Technology and Engineering Systems Journal Vol. 2, No. 3, 277-283 (2017)
the electrical network in a realistic manner.
In the established determination of the standard consumption, electrical loads are switched off if pos-sible. Thus, they are not considered when measuring the standard consumption and emission.
If for the implementation of safety, critical func-tions voltage stability is an indispensable constraint, it must be fulfilled at all costs. In particular, in the case of speed-dependent power generation in a combus-tion vehicle, a minimum battery capacity is required to maintain the voltage limits at all times. The stan-dard deviation allows to evaluate different designs. It can for example be used to define a maximum allowed deviation value for a design to be considered stable. If a stable architecture is to be selected, designs with high storage capacity are preferred. Considering the fail-operational request for a redundant power source for internal combustion vehicles, the power supply network will likely contain at least two batteries in-dependent of the other design criteria. In addition, bus or ring topologies are preferable to the existing star topology since these allow a simple distribution of the energy sources in the network in order, for ex-ample, to ensure the supply of the components in the event of a fault in the supply line [20].
The defined cost analysis also shows that the unit costs over the emission penalty as well as the oper-ating costs depend on the consumption and conse-quently on the energy efficiency of a vehicle. Con-sequently, future architectures follow a trade-off be-tween an energy-efficient design and small unit cost. A reduction of the consumption of the energy supply system by 200 W of the SUV discussed in the previous section by means of a system more expensive by e 570 would be cost neutral due to the 6 g lower emissions and therefore reduced penalties. But an equivalent reduction of the emission by a weight reduction of 125 kg would only result in a reduction of the penal-ties by e 50, since the permissible emission limit also drops to 138.1 gCO2 per km.
This shows that in this combination of evaluation criteria the optimization of the efficiency of the en-ergy distribution is preferred to the optimization of the weight. In contrast, in the case of an electric vehi-cle, the optimization of the weight has a greater effect on the consumption, because of the high efficiency levels in the supply of the electrical network as well as the drive train. To minimize the operating costs, it does not matter how the reduction of the energy con-sumption is realized.
In summary, a redesign of the established power supply system to reduce the power consumption would not only lead to lower operating costs, but could also reduce the product price of ICE vehicles. In contrast to of today’s cost optimization, higher costs per function through higher development or produc-tion costs might be acceptable as long the saved emis-sion penalty costs are even or higher. These assess-ment criteria therefore call into question the estab-lished optimization approaches of the cable harness based on unit costs and weight.
Today, the introduction of a power bus with semi-conductor switches instead of existing fuses in estab-lished vehicle models seems to be economically un-profitable due to the high development and material costs. If, however, the design criteria determined here are applied, the additional costs associated with the introduction would be acceptable if weight or effi-ciency savings in the electrical grid lead to equal or higher savings in emission penalties.
6 Conclusion
Electrification and digitalisation combined with new functions challenge the established e/e-architecture. Hence, it must change to meet future requirements. To be able to compare different alternatives of the power supply network, important design criteria are derived from prioritized stakeholder requests, taking into account the trends identified.
The stability of the voltage is an important bound-ary condition for the increasing integration of safety-relevant components into the vehicle. It is shown that using the standard deviation not only the voltage lim-its, but the temporal fluctuations in the assessment of the voltage stability of different design alternatives can be considered. This allows to evaluate different designs concerning their expected stability.
Moreover, consideration of the energy consump-tion of the whole vehicle allows to find an optimum compromise between minimal weight and minimal electrical losses. On the one hand, the energy con-sumption of the vehicle combined with the usual en-ergy costs of the different drive alternatives determine the specific operating costs. On the other hand, the energy consumption will significantly influence the selling price of a vehicle in the future by means of the emission penalties if the emission limit values are ex-ceeded. This means that higher development or pro-duction costs for a redesign of the established power supply system are acceptable as long as they are equal or below the saved penalty costs. An additional bonus is that a higher efficiency lead to lesser operating costs which are of high importance for fleet vehicles e.g. for car sharing especially.
Since a weight reduction also reduces the permis-sible emission limit values of a vehicle, an equiva-lent reduction of the emission over a more efficient energy distribution system has a higher effect on the penalty savings. Therefore, the found optimization criteria call into question the established optimization approaches of the cable harness based mostly on unit costs and weight.
In future research, we will investigate the extent to which different freedoms in shaping the energy net-work can influence and facilitate the fulfillment of these criteria. For this purpose, a modelling envi-ronment in MATLAB/SIMULINK is created, which al-lows to examine alternative designs of the power sup-ply network with regard to the dynamic design crite-ria defined here and to derive optimal combinations.
- L. Braun, M. Armbruster, E. Sax, “Stakeholder Issues Concerning the Automotive E/EArchitecture” in 4th International Conference on Electrical Systems for Aircraft, Railway, Ship propulsion and Road Vehicles and International Transportation Electrification Conference, Toulouse France, 2016.
- E. Frank, R. Wilhelm, R. Ernst, A. SangiovanniVincentelli, M. Di Natale, “Methods, Tools and Standards for the Analysis, Evaluation and Design of Modern Automotive Architectures” in Design, Automation and Test in Europe, 659-663, 2008.
- W. Schade, C. Zanker, A. Kuehn, S. Kinkel, A. Jaeger, T. Hettesheimer, T. Schmall, “Zukunft der Automobilindustrie”, Buero fuer TechnikfolgenAbschaetzung beim deutschen Bundestag, AB152 (working report), 2012.
- Bundesverband CarSharing, “CarSharingJahresbilanz 2015: Wachstum und Konsolidierung im deutschen CarSharing-Markt”, press release, 29.02.2016
- F.-J. van Audenhove, L. Dauby, O. Korniichuk, J. Pourbaix. “The Future of Urban Mobility 2.0: Imperatives to shape extended mobility ecosystems of tomorrow”, Arthur D Little and UITP, 2014.
- M. Klauda, M. Schaffert, A. Lagospiris, G. Piel, S. Kappel, and M. Ihle, “Position of Points 2020 – Paradigm Shift in E/E Architectures”, ATZ Elektron Worldw, 10(02), 4-11, 2015.
- L. Braun, M. Armbruster, F. Gauterin, “Trends in vehicle electric system design: State-of-the Art Summary” in Vehicular Power and Propulsion Conference, Montreal Canada, 2015.
- T. Doersam, S. Kehl, A. Klinging, A. Radon, O. Sirch, “The New Voltage Level – 48V for Vehicle Power Supply”, ATZ Elektron Worldw, 7(01), 10-15, 2012.
- A. Graf, J. Kositza, T. Raithel, “Leading Edge Automotive Power Distribution”, ATZelektronik wordlwide 8(03), 14-17, 2013.
- S. Sommer, A. Camek, K. Becker, C. Buckl, A. Zirkler, L. Fiege, M. Armbruster, G. Spiegelberg, A. Knoll, “RACE: A Centralized Platform Computer Based Architecture for Automotive Applications”, in International Electric Vehicle Conference, Santa Clara CA USA, 2013.
- G. Weiss, P. Schleiss, C. Drabek “Fail-operational E/E Architecture for Highly-automated Driving Functions”, ATZ Elektron Worldw 11(03), 16-21, 2016.
- W. Langhoff, M. Ernst, “Living wiring system bionics as a model for E/E architectures of the future”, ATZ Elektron Worldw 9(04), 40-45, 2014.
- J. Kloetzl, D. Gerling, “Stability in automotive power nets: Definitions, algorithms and experimental validation”, in 14th European Conference on Power Electronics and Applications, Birmingham England, 2011.
- T. Cleff, Deskriptive Statistik und moderne Datenanalyse: Eine computergestuetzte Einfuehrung mit Excel, PASW (SPSS) und STATA, Gabler Verlag, 2012.
- EUROPEAN PARLIAMENT AND OF THE COUNCIL of 11 March 2014 amending Regulation (EC) No 443/2009 to define the modalities for reaching the 2020 target to reduce CO2 emissions from new passenger cars, Regulation (EC) No 443/2009
- U. Tietge, S. Daz, P. Mock, J. German, A. Bandivadekar, N. Ligterink, “From Laboratory to Road: A 2016 Update of Official and Real-World Fuel Consumption and CO2 Values for Passenger Cars in Europe”, International Council on Clean Transportation, 2016.
- A. Steward, A. Hope-Morley, P. Mock, and U. Tietge, “Quantifying the impact of real-world driving on total CO2 emissions from UK cars and vans”, element energy, 2015.
- S. Pischinger, U. Seiffert, Vieweg Handbuch Kraftfahrzeugtechnik, ATZ/MTZ-Fachbuch, Springer Vieweg, 2016.
- L. Brabetz, M. Ayeb, O. Baumgarten, “Tool-based Optimization of the Topology of an Electrical Distribution System (EDS)”, SAE Int. J. Engines 9(3),2016.
- U. Dieckhoefer, V. Hoffmann, U. Hornfeck, “Decentralised Wiring System Architecture Power Distribution Next Generation”, ATZ Elektron Worldw 11(01), 38-41, 2016.