Monitoring power breakers using vibro acoustic techniques
Monitoring power breakers using vibro acoustic techniques
Volume 2, Issue 3, Page No 1771-1776, 2017
Author’s Name: Horia Balan1, a), Traian Varodi1, Mircea I. Buzdugan2
View Affiliations
1Technical University Cluj-Napoca, Department of Energy and Management, F.I.E, 400114, Romania
2Technical University Cluj-Napoca, Department of Building Services Engineering , F.I., 400114, Romania
a)Author to whom correspondence should be addressed. E-mail: horia.balan@eps.utcluj.ro
Adv. Sci. Technol. Eng. Syst. J. 2(3), 1771-1776 (2017); ![]() DOI: 10.25046/aj0203216
DOI: 10.25046/aj0203216
Keywords: power breaker, connecting, disconnecting, reliability, maintenance

Export Citations
Speaking about the commutation’s equipment, it can be said that the best solution in increasing reliability and lowering the maintenance costs is a continuous monitoring of the equipment. However, if the price/quality ratio is considered, it is obvious that, for the moment, the diagnosis can be also an acceptable solution. Nowadays the predictive maintenance for equipment’s diagnosis is currently replacing the preventive diagnosis. An efficient modality of lowering the maintenance costs is to online monitoring the power breakers, during their operation in the power systems. Consequently any connecting/disconnecting operations may be used in diagnosing a power breaker. Thus any supplementary and superfluous tests and/or maintenance maneuvers are avoided. The paper presents the operational maintenance in a power station with three high voltage active breakers, Areva type. The method of establishing the state of a breaker consists in the comparison between the signature of the acoustic signal provided by the manufacturer and the signal issued from the testing operation of the breaker’s state. The software processing procedure and the methodology of determining the faults of the monitored equipment are also developed. All the tests on the circuit breaker are made according the prescriptions of normative.
Received: 05 April 2017, Accepted: 06 June 2017, Published Online: 23 September 2017
1. Introduction
Nowadays there is a major concern in using acoustic vibrations for monitoring medium and high voltage breakers. The results of this method are comparable to the traditional test results of power breakers. Moreover, the vibration method gives online supplementary information, unavailable when using traditional methods.
The use of the vibro acoustic method is possible because even though the same number of connecting/disconnecting maneuvers is made, in the signature of the vibro acoustic signal there are much more distinctive events. These issues can be solved using supplementary processing and filtration of the vibration signals.
Measurements performed in a transformer substation compared to those performed in the laboratory highlight some low duration interference of acoustic signals in the first set of measurements. These interferences have led to errors in the results, but after finding out the noise sources, i.e. of the perturbations, and processing the registered signals using software analysis and filtering, consistent conclusive results were obtained.
Mainly, the conclusion was that the vibration monitoring methods operate similarly both in the field and in the laboratory.
2. Breakers’ Maintenance
Nowadays the maintenance policy of power breakers is oriented to corrective maintenance, acting in the moment that a fault occurs and on planning maintenance, which uses pre-established maintenance criteria periodically programmed.
Power breakers represent one of the key components in every electric power transmission and distribution system. It is the very last component in the control system that has to protect the system against damages determined by faults. In the moment of a fault in the power system operation, the breaker should operate safely, even though there was a long period of previous lack of maneuvers. For a proper operation, medium and high voltage power breakers are periodically redrawn from the power systems in order to be submitted to measurements and functional tests [1].
The main components of the breakers represent their so called “active part” and have the role to maintain and break the current in the electrical installations in which they are commissioned. These are:
- the extinguishing chamber (the breaking chamber),
- the ancillary equipment,
- the electric insulation equipment (the insulating column, air, oil, vacuum, SF6, etc.).
The control and the auxiliary element have the role to transmit the commutation command (connecting/ disconnecting) to the breaker. This category is composed by:
- connecting/disconnecting circuits,
- auxiliary commuters,
- contactors,
- relays,
- thermostats,
- the density control device SF6,
- fuses,
- blocking devices, etc.
The driving mechanism represents the component that provides the mechanical energy necessary to move the contacts. It consists in:
- the transmission mechanism,
- the energy accumulator,
- the control elements (the non electric ones),
- the control devices,
- the dumping elements,
- the compressors,
- the pumps, etc.
The most used types of driving mechanisms are:
- devices accumulating energy in springs
- devices with hydraulic drive
- devices with oleo pneumatic drive [2]
3. Acoustic Vibrations of Breakers
The aim of measuring vibrations at a power breaker is to make possible the diagnosis of its operational status without performing any traditional tests. For a proper processing and a real result, the vibration signal is registered during a connecting/disconnecting process and is compared with a reference signal of the same type. The reference signal must be a known previous registration corresponding to a proper operation of the breaker. The point is that when the vibration fingerprints are performed, one can detect the contact imperfections, the mechanical faults or any other faults which are obvious in the vibration’s signature modification of the breaker.
Some practical aspects of the experiments [3] must be considered, like as an overvoltage in the data recording system. In order to prevent the failure of the recording system, an overvoltage protection system should be installed, and the accelerometer should be insulated with respect to the ground.
For a breaker that had been previously tested in the sense of vibration signal during its long time operation, the time errors may be compared in the terms of commutation times. The advantage of the dynamic time warping (DTW) analysis is that the time error is related to a certain moment of the maneuver [4]. The traditional measurements of the commutation time, according to the existing standards, provide details about the total commutation time, but provide no information about the moment and the evolution area of the maneuver due to the time error.
When the vibration signals determined by the movement of the operation mechanism is measured, it is possible to find some hidden and serious faults of the breakers, even though they were tested using traditional methods and have been considered in a proper functional status.
The measurement of the current drawn by the operating inductor cannot be replaced by the DTW analysis. However if the accelerometer is located in the vicinity of the inductor, it is possible to register vibrations, when the inductor is energized.
When the impulse is recorded with a higher sampling frequency, in this case more than 500 kHz, it is possible to estimate the impulse duration. See Fig. 1 in which the duration of the pulse is 2 μs (where x represents the measured value, the red line represents the evolution of the signal and the dotted line represents the width of the impulse).
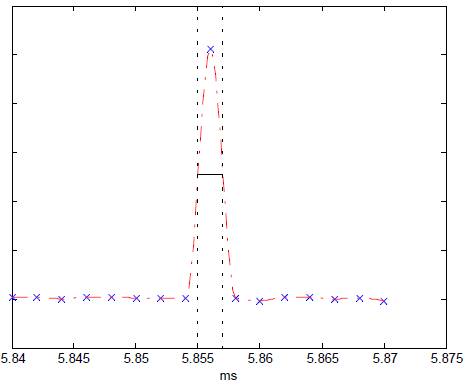 Fig.1: Impulse recorded at a sampling frequency of 500 kHz [5]
In the case of such pulses it is very difficult to mention a fault or a non functionality, because when measuring with accelerometers, the measurements may be affected by high voltage pulses captured by the cables linking the piezoelectric sensors and the measurement device, even though they are shielded and/or separately supplied.
If sound recordings are performed and processed, one can obtain information on the operating anomalies and of their causes. Applying an appropriate electro acoustic measurement and analysis method, conclusions on several faults can be drawn.
Due to the interdiction of mounting sensors on commissioned breakers, sound records may be suitable for the diagnosis of several types of faults.
4. Methods of Processing Acoustic Signals
Current or vibration signals measurements are in general performed in time domain. In order to identify the frequency components of signals it is necessary to use the Fourier transform. The Fourier analysis is useful in the study of the signals in general and in the study of harmonic functions in particular (Fig. 2).
Any periodic function f(t) = f(t+T), may be written as an infinite sum of sinusoidal harmonic oscillations, each of them having frequencies equal to integer multiples of a minimum frequency, namely the fundamental frequency, according to eq. 1 [7]:
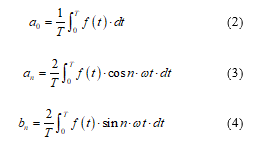
![]() Components appearing in the sums of the eq. 1 are called harmonic components and deserve to determine the signal spectrum, a0 being the continuous component. The coefficients an and bn are determined using the following equations [7]:
Components appearing in the sums of the eq. 1 are called harmonic components and deserve to determine the signal spectrum, a0 being the continuous component. The coefficients an and bn are determined using the following equations [7]:
 Figure 2. Sinusoidal signals [6]
 The Wavelet technique is more and more used in the analysis and the synthesis of the sounds, due to the advantages with respect to the fast Fourier transform [8].
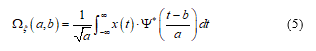
The continuous wavelet transform of a finite energy signal x(t), Ψ(t) represents the “mother Wavelet function” and it is the convolution product of x(t) with the wavelet scaled and conjugated function Ψ*, according to the eq. (5) [9]:
 In order to be a Wavelet function, every function must satisfy the following admissibility condition [9]:
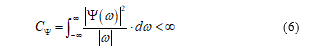 where Ψ(ω) is the Fourier transform of Ψ(t) and CΨ depends on the chosen Wavelet transform [10]. The Wavelet functions are asymmetric, having a finite duration and a zero mean value.
![]() Using the calculated coefficients of the Wavelet functions, the original signal x(t) can be restored.
Using the calculated coefficients of the Wavelet functions, the original signal x(t) can be restored.
The Wavelet coefficients appreciate the resemblance between the signal x(t) and the function Ψa,b(t). The use of the Wavelet transform consists in the choice of “mother Wavelet” functions. A certain number of “mother Wavelet” functions exist, but for the choice and the use of these functions, several particularities application depending must be considered.
Dynamic Time Warping is the method comporting two signals, the first one unknown and the second one a reference signal. The result of the comparison of the two signals is a function describing the temporal variation of the misalignment between the two signals. For an optimal result, the cumulated distance of the differences between the two signals must reach a minimum. In other words, considering the function from its initial point to its final point and cumulating at each step the distance between the characteristics of the frames, in the last point, the distance has to be the minimum one [11].
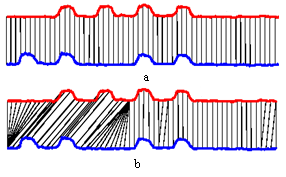 Fig.3: Alignment of two signals by the Euclidian method (a) and by the DTW method (b) [11]
Dynamic Time Warping (DTW) is an algorithm of aligning two time series, which was at its origins developed for the speech recognition. In the time series analysis, the dynamic deformation in time is an algorithm of measurement of the similitude of two temporal sequences that can be variable in time and in speed [12].
How resembling could be for instance the signals A and B from Fig. 3 (signal A is denoted with a red line and signal B with a blue line).
A method that modifies the time axis by contraction or dilatation is needed in order to superimpose the two signals without modifying the phase of the signals or to displace the time axis. The approximation used in the Euclidian method is used quite often, but the method is not able to perform an accurate comparison between signals which are not in phase.
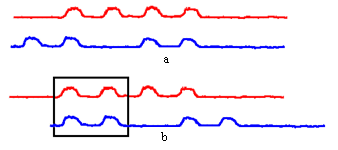 Fig.4: Alignment of two signals by displacement on the time axis [11]
The dynamic time warping (DTW) method is able to perform an alignment of events between the two signals, even though they are not in phase (Fig. 4).
5. Experimental Results
The experimental determinations are performed on a high voltage power breaker, Areva, GL 310 F3/4031 O/VR, with SF6, consisting in two columns of poles, the base frame and a driving mechanism. The columns with poles consist in an insulator which is isolating the operating voltage with respect to the ground and an insulator of the chamber in which the breaking unity is located.
The experiment consisted in recording the sound depicted in Fig. 5, in the stages of connecting arming and locking of the power breaker.
The objective of the determinations is to automatically identify the existence of the three stages (connection, arming and locking), of the operating mode, (the normal operating, or the abnormal operating mode) of the whole ensemble consisting in the three 110 kV power breakers, on the three phases L1, L2 and L3.
The dynamic warping method is used and the spectrograms are depicted in Figs. 6 and 7.
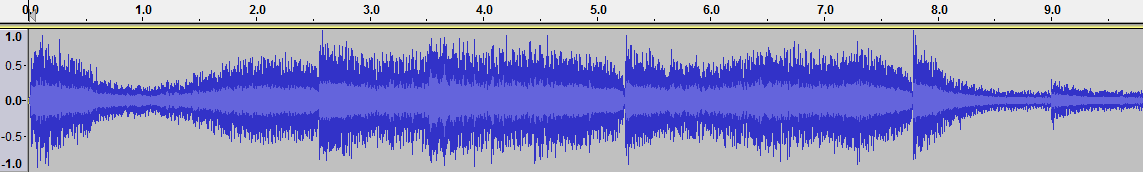 Fig.5: Audio signal
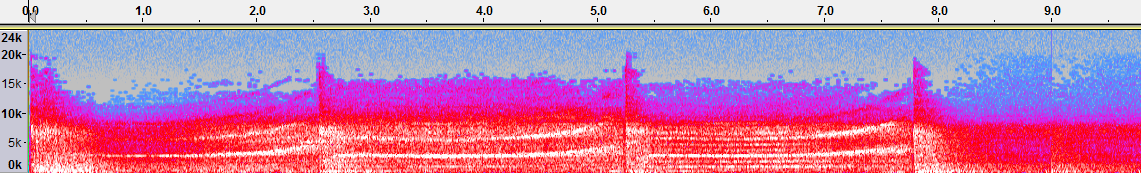 Fig.6: Audio signal spectrogram
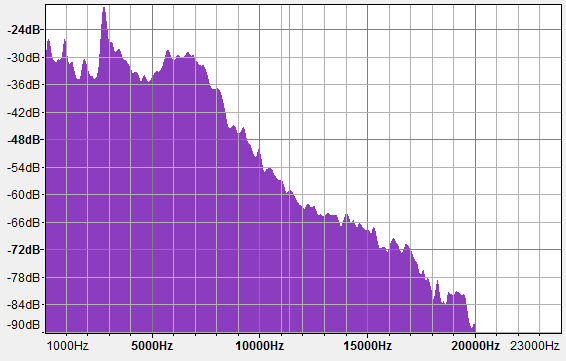 Fig.7: Magnitude versus frequency spectrum
The method that is checking out the breaker status consists in using the software Test_DTW. The software allows the comparison of each line signal with respect to the reference signal. The values obtained after the time alignment and the comparison, highlight the status of the power breaker.
The simulations have been performed using the Matlab platform.
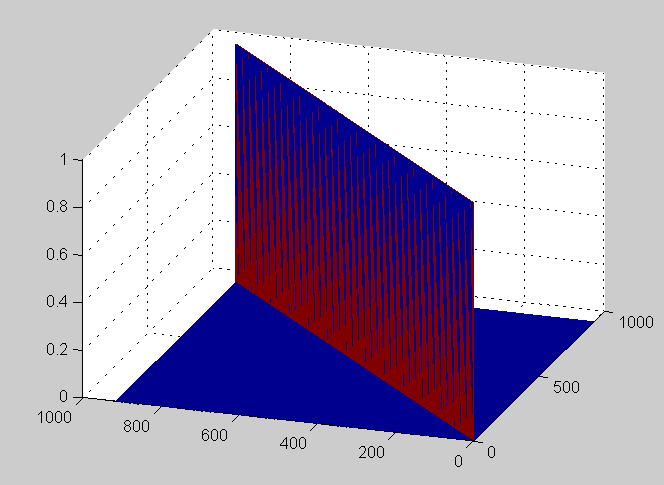 Fig.8: The match matrix M. Comparison of the reference signal O_R1 with itself.
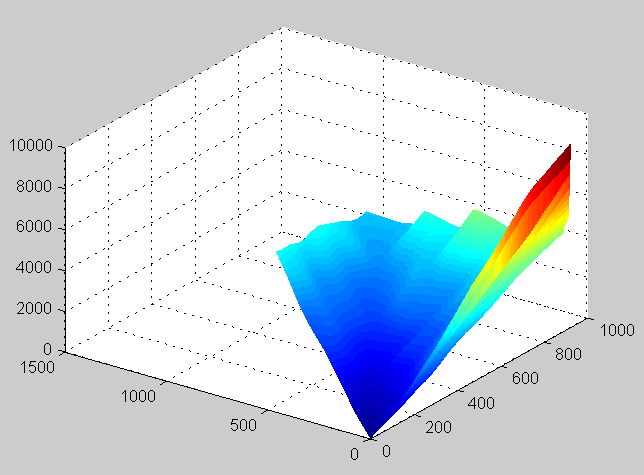 Fig.9: Cumulated distance D matrix
In order to highlight the accuracy of the method, Fig. 8 depicts a sort of a self test, consisting in a comparison between the reference signal with itself. Due to the fact that the values of the algebraic sum of the cumulated magnitudes are perfectly superimposed on the diagonal of the base square, the validity of the solutions is confirmed. The lack of superposition on the diagonal of the matrix highlights the existence of failures.
On the other hand, Fig. 9 indicates a breaker fault, highlighted by the comparison between the reference signal OR-1 and the signal OR 2.
6. Conclusions
Due to the permanent development of the electrical energy generating sources, the problem of the modernization of the transmission and distribution networks became a matter of high necessity. Consequently the need of higher reliability of equipment the cost reductions are compulsory. At the same time the maintenance problem is an acute one.
The costs with the maintenance process can be influenced by the reduction of the regular maintenance operations which in several cases are even not necessary. These costs can be optimized by passing from the classic corrective maintenance to the preventive maintenance using efficient methods.
The development and the implementation of the monitoring systems for power breakers became a necessity and a constant concern for the equipment manufacturers who provide equipment with embedded sensors. Due to the nowadays trend of monitoring and of the diagnosis of the medium and high voltage power breakers, the research topics should be focused on the monitoring, measurement and analysis of the sounds made be the vibration signals of the power breakers. This method represents a good choice because on one hand the vast majority of the power breakers commissioned until now has no embedded sensors and on the other hand the sensors cannot be mounted on the power breakers.
The sound analysis method proposed is a non invasive one which comply the safety norms, the measuring equipment being kept at a safety distance with respect to the operating equipment.
The monitoring systems presented in the paper have the following advantages:
- obtain information according the operating faults or anomalies;
- significantly mitigate the maintenance costs, by increasing the time duration between two faults;
- simplify the diagnosis process;
- increase significantly the life time of the power breakers;
- optimize the maintenance costs;
- maximize the investments efficiency;
- reduce the reaction time in case of functional faults.
Highlighting the specific type of fault that occurs at the commutation equipment will represent the topic of a further work. The present paper highlight only the benefits of the monitoring method that is able to offer the software processing procedure and the methodology of determining the faults of the measurements outcomes.
- Huang Lingjie, Wang Wei, Wu Zhensheng, Xu Lijie, Research on the model of HV SF6 circuit breaker fault diagnosis based on fuzzy theory, International Conference on Condition Monitoring and Diagnosis, Beijing, China, 2008;
- M. Adam, A. Barboi „Electric Equipment II” Ed. Gh. Asachi, Iasi 2002 (in Romanian);
- H.K. Hoidalen; M. Runde, “Continuous Monitoring of Circuit Breakers Using Vibration Analysis”, IEEE Transaction on Power Delivery, Vol. 20, No. 4, 2005, pp 2458 – 2465;
- M. Runde et al., ”Vibration analysis for diagnostic testing of circuit-breakers”, IEEE Trans. On Power Delivery, vol. 11, 1996;
- Tat Wai (Alan) Leung. Predictive Maintenance of Circuit Breakers. Waterloo, Ontario, Canada, 2007;
- http://ro.math.wikia.com/wiki/Analiz%C4%83_Fourier;
- http://newton.phys.uaic.ro/data/pdf/Introducere%20in%20analiza %20Fourier.pdf;
- P. S. Addison, “Low-Oscillation Complex Wavelets”, Journal of Sound and Vibration (2002) 254(4), pp. 733-762;
- M. Răducanu, L. Stanciu, A. Mateescu, Time- frequency transformers used in telecommunications: Fast Fourier transform and Wavelet transform, Telecomunicaţii, no.1/2007, (in Romanian)
- Shie Qian, “Introduction to Time-Frequency and Wavelet Transforms”, Upper Saddle River, New Jersey: Prentice Hall PTR, 2001;
- E. Keogh Exact indexing of Dynamic Time Warping http: /www.cs.ucr. edu;
- M. Runde; G.E. Ottesen; B. Skyberg; M. Ohlen, “Vibration Analysis for Diagnostic Testing of Circuit Breakers” IEEE Transactions on Power Delivery Vol. 11, No. 4, 1996, pp.1816-1823;