Soft Handoff Evaluation and Efficient Access Network Selection in Next Generation Cellular Systems
Soft Handoff Evaluation and Efficient Access Network Selection in Next Generation Cellular Systems
Volume 2, Issue 3, Page No 1616-1625, 2017
Author’s Name: Moses Ekpenyong1, a), Daniel Asuquo1, Samuel Robinson1, Imeh Umoren2, Etebong Isong2
View Affiliations
1Department of Computer Science, University of Uyo, P.M.B. 1017, 520003, Uyo, Nigeria
2Department of Computer Science, Akwa Ibom State University, Ikot Akpaden, Nigeria
a)Author to whom correspondence should be addressed. E-mail: mosesekpenyong@uniuyo.edu.ng
Adv. Sci. Technol. Eng. Syst. J. 2(3), 1616-1625 (2017); ![]() DOI: 10.25046/aj0203201
DOI: 10.25046/aj0203201
Keywords: Cellular network, Soft handoff, Machine learning

Export Citations
The increased motivation (by service providers) to offer user-centric and seamless communication services – that satisfies users’ quality of experience (QoE), has manifested a myriad of challenges in the field of wireless communication; and given the increased traffic capacity and sudden explosion of cellular devices, communication systems are constantly threatened by performance related issues – including soft handoff. Although intelligent techniques have evolved to provide solutions to these issues, they are yet to flourish in the area of soft handoff. This contribution therefore proposes a framework that integrates two components: (i) machine learning methodologies: self-organizing map (SOM) and pattern classification – for robust performance evaluation of available soft handoff data; (ii) multiple attribute decision making mechanisms (MADM): the Analytical Hierarchy Process (AHP) – which result feeds the Technique for Order of Preference by Similarity to the Ideal Solution (TOPSIS) – for efficient access network selection.
Implementation of component one of the design revealed that SOM enabled a precise visualization of handoff features that influenced the system performance; and the error levels of training, validation and test dataset, with number and percentage of correct and incorrect classifications, were obtained from our pattern classifier.
Implementation of component two of the design for four heterogeneous (access) networks indicated that although network two (N2) was selected as best access network by TOPSIS and network three (N3) by Synthetic Extent Analysis (SEA) – a method adopted in a related paper, for a particular application; both TOPSIS and SEA selected N1 as second best alternative access network and network four (N4) as third best alternative network, despite the issue of ranking abnormality in TOPSIS. Further, AHP and TOPSIS can effectively be applied as MADM algorithms in handoff decision framework for selecting the best available network for handoff.
Received: 03 June 2017, Accepted: 04 August 2017, Published Online: 24 August 2017
1. Introduction
The integration of diverse but complementary cellular and wireless technologies in the next generation wireless networks requires the design of intelligent handoff decision algorithms to enable mobile users equipped with contemporary multi-interfaced mobile terminals to seamlessly switch network access and experience uninterrupted service continuity anywhere and anytime. Recently, various schemes have been implemented to enhance the quality of multimedia traffic [4], but such schemes are yet to offer good estimates of the traffic load and throughput. Handoff is an essential element of cellular communications, as efficient handoff algorithms are a cost-effective way of enhancing the capacity and quality of service (QoS) of cellular systems. Traditional handoff mechanisms are mostly based on received signal strength (RSS) from current access point (AP) or base station (BS). The method to decide handoff based on RSS is considered as the simplest method to handoff decision [1], but on the other hand, it may not have sufficient reliability because of RSS fluctuation [2]. Further, each network in a heterogeneous network has different RSS threshold; hence, RSS-based method results in inefficient handoff, unbalanced load, and frequent service interruption. The heterogeneous network concept was introduced to satisfy the demands of network traffic capacity and data rate [3], and consists of multiplatform networks with various radio access technologies. Conventionally, a mobile user may roam and accomplish handoff using single criteria such as RSS, but the co-existence of different networks with different RSS thresholds degrades the network performance. As such researchers exploit other parameters such as signal to interference and noise ratio (SINR), current location of mobile user, and network conditions for initiating handoffs.
The continuous developments and evolving generations of the cellular network technologies are influenced heavily by increased traffic capacity; high data consumption; and demand for better service quality – sufficient to satisfy end-users’ quality of experience (QoE), but, state-of-the-art solutions are yet to parallel these challenges. Next generation cellular systems are expected to leverage the challenges of previous generations and provide ubiquitous connectivity, zero latency and high-speed connection. It is also expected (in the future) that devices should integrate heterogeneous radio access technologies (RATs) in order to improve the network performance as well as satisfy users’ quality of experience.
Vertical handoff which occurs between base stations (BSs) with diverse wireless network interfaces, enables mobile subscribers to seamlessly make connections with the new BS before terminating with the previous BS. Network selection for subscribers with multiple connection interfaces however, creates a huge challenge for heterogeneous wireless environment. This raises the concern for innovative approaches to access network selection to ensure: seamless and always best connected (ABC) service to mobile subscribers, maximized resource utilization, and increased revenue to network operators. One promising solution is the use of multiple attribute decision making (MADM) methodology to handle the multiple attribute requirements of each access network for efficient handoff.
In this paper, we engage the prioritization of various handoff decision variables – to improve on the overall network performance. The current work is an extension of our FTC’16 paper [5]. First, we subject the available (handoff) input data to two machine learning procedures: (i) unsupervised analysis of inherent patterns; and (ii) supervised classification of the system performance. We then proceed further to demonstrate the use of two MADM techniques – analytic hierarchy process (AHP) and Technique for order of Preference by Similarity to the Ideal Solution (TOPSIS) – for the network selection problem. The AHP is used to determine the weights of decision criteria, which are later fed into TOPSIS and used to assist the network to rank the access networks. Our focus is on the handoff decision phase and aimed at satisfying mobile subscriber through the ABC concept. Further, the performance of TOPSIS in network ranking is compared with the synthetic extent analysis using decision criteria values obtained in [5].
This paper is structured as follows: A critical review of literature on related works is done in section 2; Section 3 presents the materials and methods required for accomplishing the study; Section 4 discusses the results obtained; and Section 5 offers conclusion to the study.
2. Related Works
Macro-diversity can change the transmission power required to service a mobile station with regards to its location. Although this contributes to improving the system performance, it can also cause unexpected call-dropping after handoff. For multimedia traffics which require high data rates, macro-diversity is necessary. In [6] an analytical soft handoff model considering macro-diversity effect was developed. Using analytic and simulation method, a performance evaluation of blocking probability, handoff failure probability and the region-transition failure probability was carried out. Their results were also compared with previous analytic models to illustrate the effect of macro-diversity on the system performance. The system was found to be useful for managing the determination of optimal resource allocation, cell configuration, and admission strategy. In a similar research, Chung and Cho [7], had proposed an analytical model of soft handoff when multimedia services are served in CDMA based intelligent transport system (ITS). They evaluated the performance of soft handoff scheme using analytical and simulation method, and considered key performance metrics such as blocking probability, handoff failure probability and carried traffic – obtained for the system management parameters considered in [6]. Ma, Cao, Liu and Trivedi [8] investigated the features of cellular geometry in CDMA systems with soft handoff, which distinguishes the controlled area of a cell from the cell coverage area. Important characteristics of the cellular configuration were used to propose a new design for efficient call admission control (CAC) in CDMA systems and the construction of a continuous-time Markov chain (CTMC) model for CAC in CDMA with soft handoff queue. Closed-form solutions were also obtained with algorithms that provide stability in loss probabilities computation and the determination of the optimal number of guard channels. To apply the loss formulas, their proposed modelling techniques were used to evaluate and compare the performance of conventional and proposed soft handoff schemes. Numerical results showed the effectiveness of the proposed Markov chain models as well as benefits of the new soft handoff scheme. A neural network (NN) approach was proposed in [9] to optimize the operation of cellular networks, where an analytical equation was derived to establish the effect of essential handoff contributory factors, with data obtained from base stations of an operational network carrier, and trained using a back-propagation NN algorithm. Their results showed that the network performance improved with large data size. A self organizing map was then used to visualize the existing system for the purpose of improving further, its performance.
Heterogeneous multi-radio networks are emerging with architectures that compromise hierarchical deployments of increasingly smaller cells [10]. These deployments may employ multi-radio access technologies to communicate with the network infrastructure, and calls for a dynamic access network selection. Various schemes have been implemented for access network selection during handoff in heterogeneous wireless networks, but most of them are usually optimization procedures and only useful for the reduction of handoff latency instead of improving QoS. One of the important aspects of seamless communication for ubiquitous computing is the dynamic selection of best access network. Ajuja, Singh and Khanna [11] considered bandwidth availability as the dynamic parameter for network selection in heterogeneous environments. A bootstrap approximation based algorithm is deployed in temporal and spatial domains to check its robustness. Numerical results showed that their algorithm reduced the estimation error, overhead, and improved reliability, compared to the existing algorithm.
To assure the required QoS for various applications run by the mobile user (MU) and avoid frequent handoff errors in heterogeneous networks, an AHP method for network selection was introduced in [12]. AHP performs decision selection on the basis of different handover parameters such as QoS, communication cost, availability and reputation of a network, etc, and combines the average of each criterion to decide an appropriate network for handoff. The AHP method has been employed by different researchers for efficient network selection in WLANs, but the method has not achieved the desired success in cellular networks [12]. A similar scheme was proposed to enhance the QoS of a network through the optimization of different handoff parameters such as data rate and handoff latency [1], and the decision for handoff was performed using a hybrid of fuzzy logic and analytic hierarchy approaches. A hierarchal scheme for discovering network selection rule based on media independent handoff (MIH) optimization has been proposed in [13]. In their experiment, a number of APs/BSs in a particular zone were connected to a zone media independent information system (MIIS) server attached to both the local and global MIIS servers. The energy consumption rate of a MU directly depends on the available networks scanned during a handoff process. Different schemes based on the energy efficient network selection for multimedia based applications have been proposed in [14, 15]. The schemes adopted the concept of adapt-or-handoff for balancing the multimedia traffic during a handoff process, thereby saving energy consumed due to the insignificant degradation in quality. Hence, energy consumption during the selection of networks is important and should be considered carefully. In order to optimize the energy consumption of multiple interfaces, Doppler, Ribeiro and Kneckt [16] have proposed a two-step scanning mechanism for obtaining band/channel information within a specific area. In their scheme, the MU scans highly reachable channels and provides each MU with the network density information as it enters a new area.
One major issue in handoff is how to optimize the decision time in selecting the access network with the best signal quality among the available one at the exact time needed by the mobile users. It is therefore necessary that mobile network operators provide good control and decision-making algorithms that optimize the soft handoff process – to avoid false initiation alarm, and select the best available network. Various MADM techniques for handoff decision optimization abound in the literature (c.f. [17-20]). However, no one technique is superior as there exist drawbacks in them such as ranking abnormality, subjective experts’ judgment, uncertainties in human preference and penalizing behaviour towards poor attributes. In this paper, AHP and TOPSIS are combined for performance evaluation of network selection in heterogeneous wireless environment during handoff. Furthermore, the selection of these models is based on the following evaluation criteria [21]: internal consistency and logical soundness, transparency, ease of use, data requirements are consistent with the importance of the issue being considered, realistic time and manpower resource requirements for the analytical process.
The idea with AHP is to form a comparison matrix for each pair of criteria or alternatives such that the paired comparisons produce weighting scores that measure how much importance the criteria or alternatives have with each other. It begins by decomposing a complex decision problem into a hierarchical structure comprising the goal to be achieved at the top of the hierarchy, followed by criteria needed to achieve the goal and possibly the alternatives for each criterion at the bottom of the hierarchy. The major steps in AHP hierarchal structure are presented in [22-23]. The method tries to optimize decision making when decision makers are faced with conflicting qualitative and quantitative data. It optimizes decision making by enabling decision makers, in its final ranking, to choose the best solution among several alternatives across multiple criteria to attaining a specific goal. The ability of the method to capture both subjective and objective data in a quantitative manner for evaluation as well as the provision of a mechanism for checking the consistency ratio of the evaluation measurements makes it a veritable tool for decision making. The use of TOPSIS as a classical MADM algorithm is aimed at identifying an alternative that will have the shortest distance from the positive ideal solution and the farthest distance from the negative ideal solution [24]. The algorithm calculates positive and negative ideal solutions based on the attribute values available for each alternative.
In [25] a modified ‘‘ELECTRE’’ algorithm that provides complete ranking of the networks in application scenarios where the utility of some attributes is non-monotonic was presented. In [26], they compared the performance of “PROMETHEE” with “AHP” in terms of consistency, ranking abnormality, robustness, and accuracy. In [27], a comparison among different decision making techniques was made to check their pros and cons in terms of selection of network for sensor based applications. Results indicate that AHP appears more stable, less prone to risk and penalizing judgment behaviour. Also, more than 80-85% of the time, the results made by AHP, TOPSIS, Simple Additive Weighting (SAW) and Multiplicative Exponent Weighting (MEW) were the same. In [28], an access network selection algorithm that uses AHP and TOPSIS was proposed, but crucial QoS parameters such as RSS and available bandwidth resources were not considered in the selection process. However, it has been shown that the available bandwidth, received signal quality, battery life of the MT, security level, cost of service per byte, and distance between MT and BS are important parameters when considering vertical handoff decisions [29-31].
A QoS mechanism was proposed in [5] for improved handoff decisions in mobile communication networks. The proposed design adopted a hybrid channel perception tool to train observed key performance channel characteristics for system channel behaviour discovery. A HMM framework was adopted to ensure that the available channels were not completely consumed during handoffs. Estimates obtained from the training were then passed to a Fuzzy-based model to select the appropriate access network or base station. Their results showed that the proposed system could sustain handoffs at an average of 80%, compared to the empirical system, which average gave 50%. Further, two multiple attribute decision making (MADM) methods: fuzzy AHP and synthetic extent analysis (SEA) were used to assign weights to certain criteria influencing handoff decision, and the alternative access networks ranked based on weight priority scores in order to select the most optimal access network for a particular application.
3. Materials and Methods
The methodology adopted for the soft handoff evaluation integrates two machine learning tools. The self organizing map (SOM) – an unsupervised classifier is first used to cluster the input data in order to observe the inherent patterns exhibited by the existing system. The stipulated threshold for handoff success rate set by the Nigerian Communications Commission (NCC) – the communication regulatory body in Nigeria, was then used to generate the target class. Both data classes (input and target) are later fed into a (supervised) feed-forward pattern classifier, to explain the performance of the classification algorithm. The system framework is shown in Figure 1.
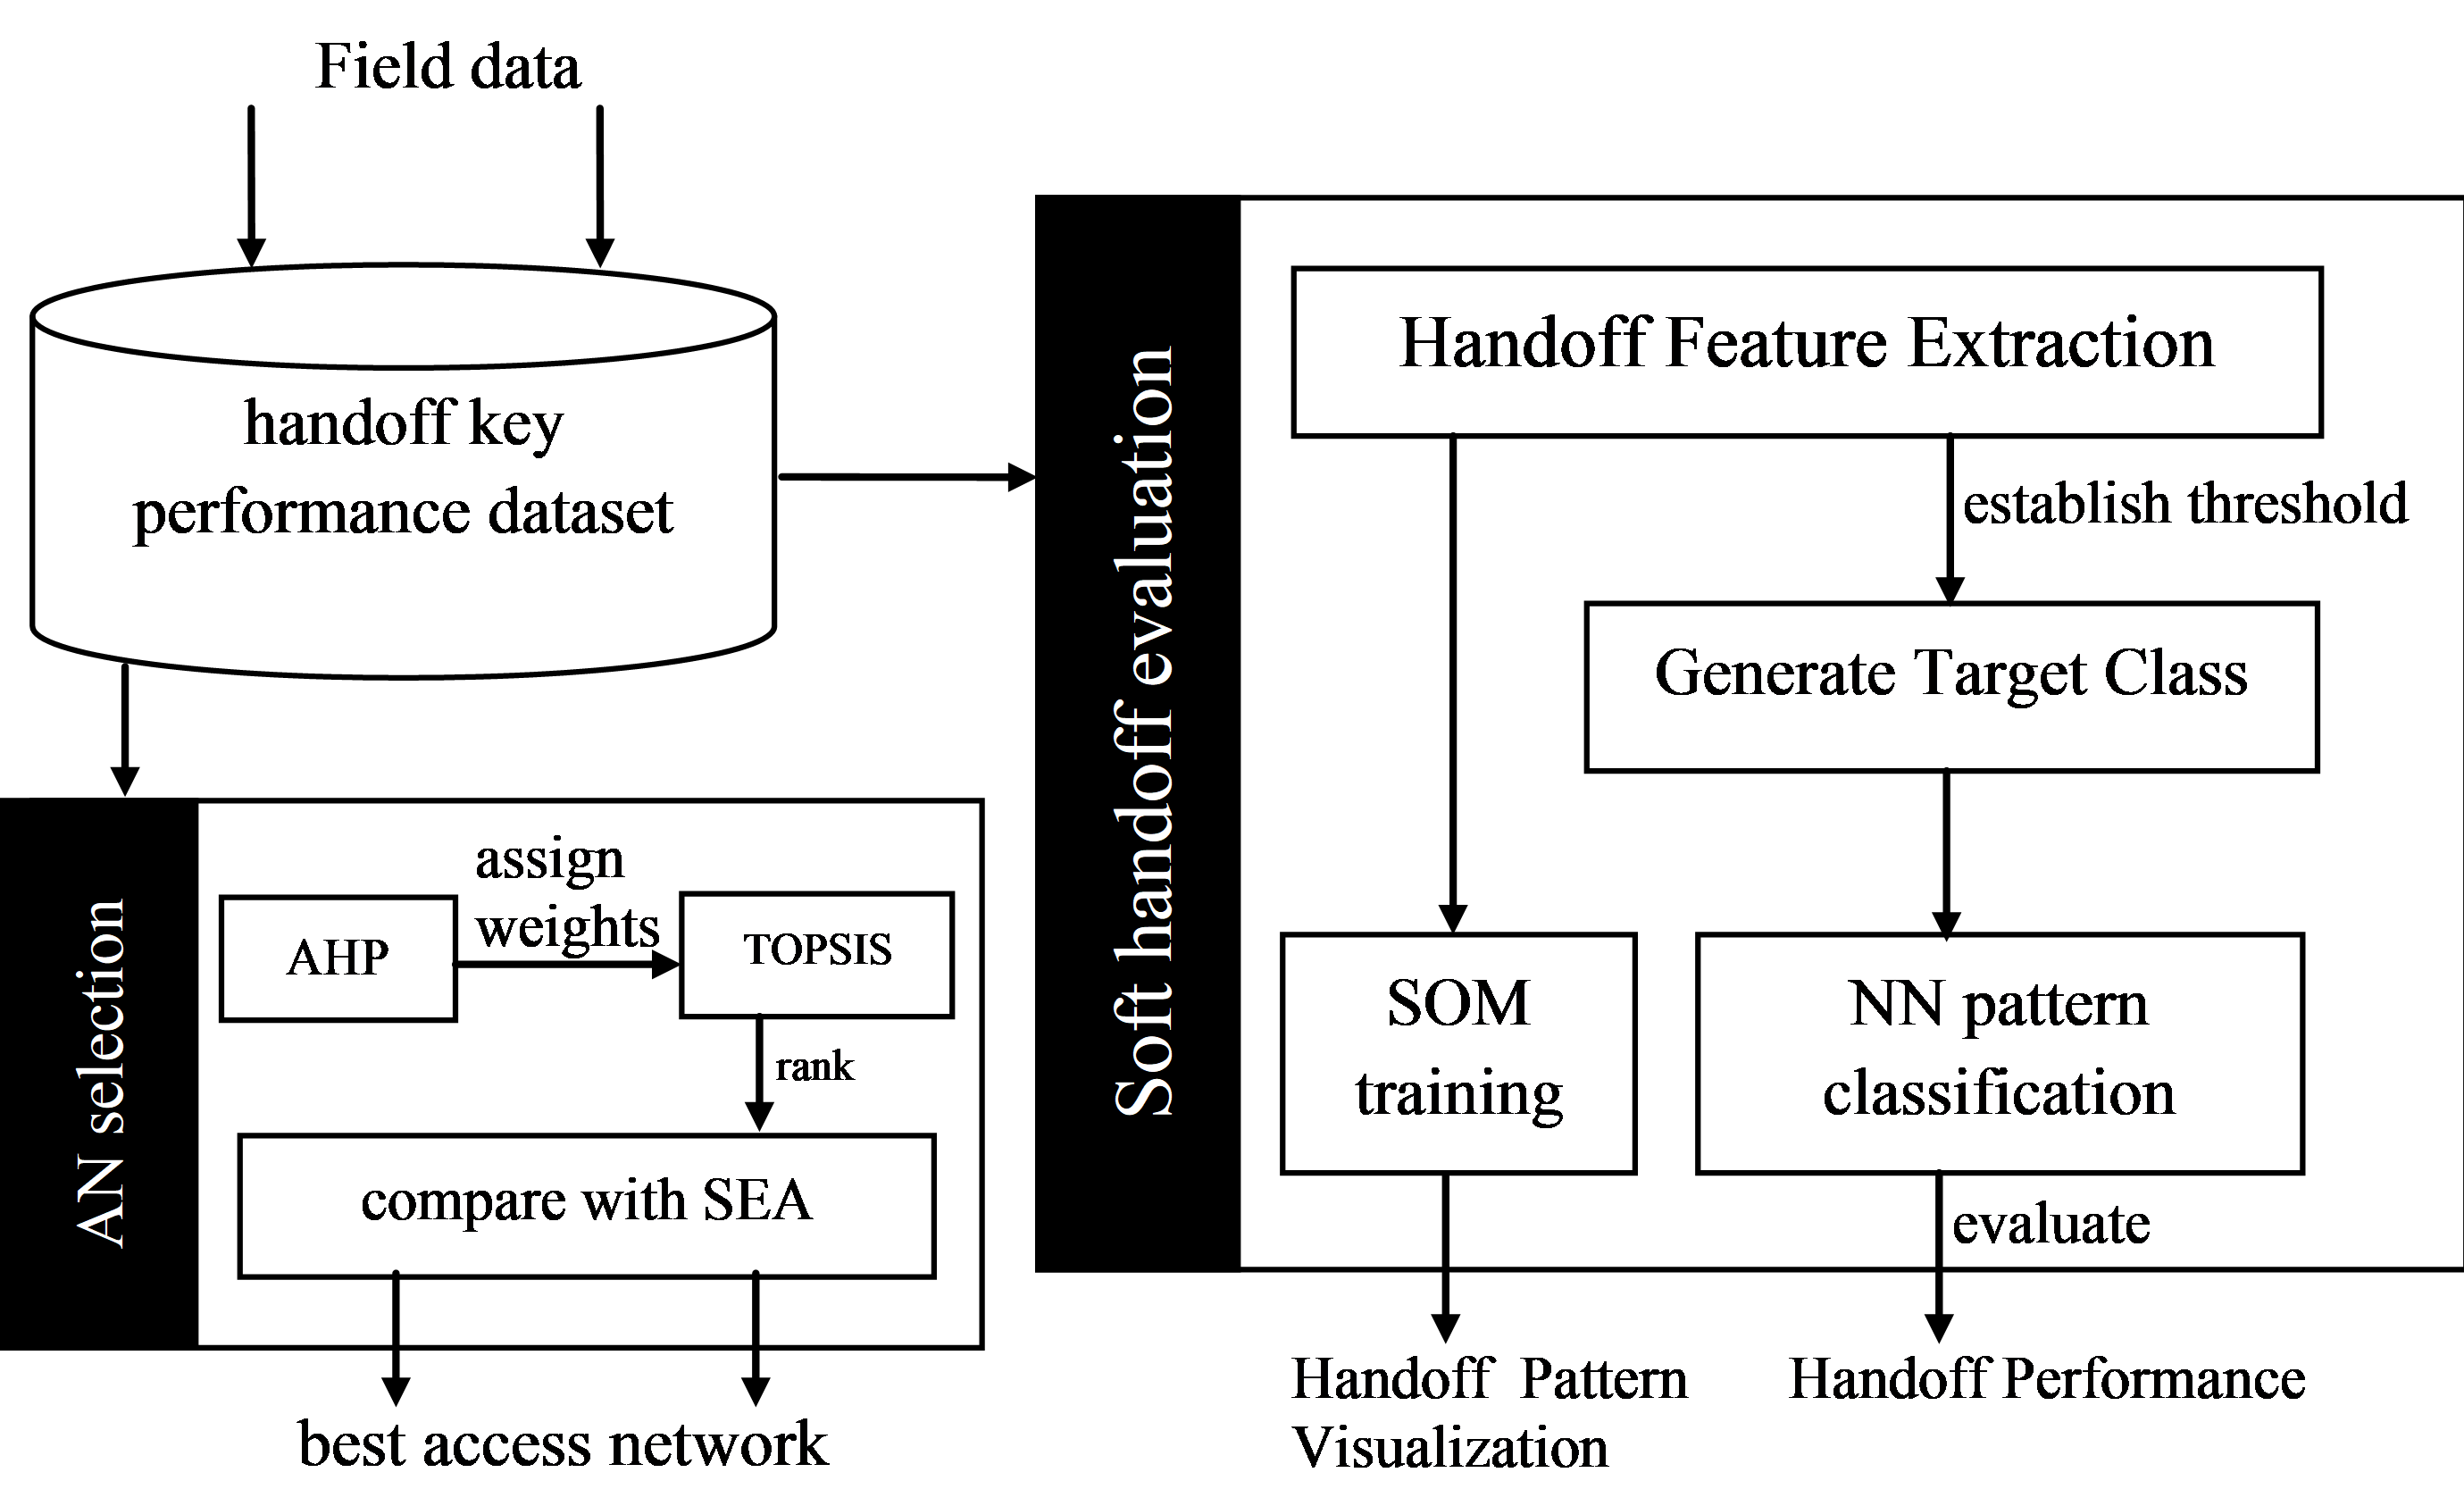 Figure 1. Proposed system framework
To ensure effective comparison between SEA and TOPSIS, the most promising values generated from the membership functions of the triangular fuzzy numbers in the fuzzy-AHP method in [5] were used to construct the AHP pair-wise comparison matrix for the considered criteria necessary for handoff decision. The AHP process in the end assigns weights to criteria which are used by the TOPSIS method to perform final ranking of the access networks. The alternative access network is the one with the highest value of relative closeness to ideal solution. We also compare the access network selection results of SEA technique – obtained in [5] with TOPSIS, to evaluate the efficiency of both selection techniques, in selecting the best access network for handoff.
3.1. Key Performance Dataset
Dataset for the soft handoff evaluation experiment consists of the input class and the target class. Sample data points for the input and generated target classes are presented in Table 1. The input data are real-time measurements acquired from 49 base station controllers (BSCs) of an operational cellular network carrier, at busy hours. These data were gathered over a period of one month, and are required for evaluating the existing system.
The input data extracted for this experiment include: drop call rate (DR); cell availability (CA); base station controller availability (BSCA); carried traffic (CT); block call rate (BR); up-link throughput (UL_TH); down-link throughput (DL_TH); and handoff success rate (HOSR). The target class is made up of three features namely, not satisfactory (C1: class 1); satisfactory (C2: class 2); and very satisfactory (C3: class 3). Data for the target class were obtained through the following classification rule: (if HOSR<90, C1=1, else, C1=0); (if 91 HOSR 95, C2=1, else, C2=0); (if 95 HOSR 100, C3=1, else, C3=0).
After generating the target class, 7 samples (about 14% of the data) were not satisfactory (fell into class 1), 42 samples (about 86% of the data) were satisfactory (fell into class 2), and none (0% of the data) was very satisfactory (fell into class 3). The analysis indicates that the handoff performance of the existing system was not optimal, as no data fell into the third class.
Table 1. Sample input data points and generated target classes
| Input class | Target class | ||||||||||
| SN | DR | CA | BSCA | CT | BR | UL_TH | DL_TH | HOSR | C1 | C2 | C3 |
| 1 | 1.1200 | 99.8700 | 93.3800 | 402.0800 | 0.1200 | 11.7000 | 33.8100 | 88.6600 | 1 | 0 | 0 |
| 2 | 0.9000 | 99.8900 | 97.5900 | 569.1900 | 0.2100 | 11.3200 | 30.3200 | 91.2100 | 0 | 1 | 0 |
| 3 | 1.1800 | 99.7700 | 93.7800 | 507.7200 | 0.3300 | 10.7400 | 28.8800 | 92.3300 | 0 | 1 | 0 |
| 4 | 0.7400 | 99.7300 | 97.9400 | 645.3700 | 2.1900 | 7.1700 | 23.6100 | 93.6600 | 0 | 1 | 0 |
| 5 | 0.9000 | 99.6600 | 90.7800 | 615.9900 | 0.7900 | 9.7200 | 25.6600 | 91.7300 | 0 | 1 | 0 |
| 6 | 0.9700 | 99.5900 | 96.1000 | 889.1500 | 0.3500 | 8.4000 | 22.2700 | 93.5100 | 0 | 1 | 0 |
| 7 | 1.0300 | 95.3500 | 96.0200 | 1065.5200 | 0.7700 | 3.5600 | 11.8400 | 92.8100 | 0 | 1 | 0 |
| 8 | 0.6800 | 95.5000 | 94.0200 | 1030.3100 | 0.3800 | 8.0200 | 24.0500 | 93.6300 | 0 | 1 | 0 |
| 9 | 1.0700 | 98.0400 | 91.3200 | 647.5300 | 0.9500 | 8.5000 | 24.8200 | 93.3300 | 0 | 1 | 0 |
| 10 | 1.2300 | 98.0000 | 97.4600 | 423.2100 | 0.0600 | 10.8300 | 29.1200 | 88.9600 | 1 | 0 | 0 |
| 11 | 1.4300 | 97.9500 | 95.6100 | 455.8500 | 0.3700 | 14.0200 | 36.1900 | 92.0900 | 0 | 1 | 0 |
| 12 | 1.0800 | 99.8400 | 95.1700 | 395.0600 | 0.1200 | 8.5200 | 26.1800 | 92.7000 | 0 | 1 | 0 |
| 13 | 1.0300 | 99.9700 | 92.7100 | 250.8900 | 0.0300 | 10.8900 | 33.1200 | 90.3900 | 0 | 1 | 0 |
| 14 | 1.3200 | 99.7800 | 96.1300 | 151.9700 | 0.3800 | 12.2700 | 35.9600 | 88.6500 | 1 | 0 | 0 |
| 15 | 1.4600 | 94.6700 | 96.1900 | 990.6200 | 2.9700 | 9.0700 | 25.4800 | 88.5500 | 1 | 0 | 0 |
| 16 | 1.0500 | 98.5000 | 98.3300 | 685.7000 | 0.1700 | 10.7900 | 26.9600 | 91.4000 | 0 | 1 | 0 |
| 17 | 0.8500 | 98.4800 | 95.0300 | 346.4200 | 0.1500 | 11.5300 | 28.7300 | 93.4300 | 0 | 1 | 0 |
| 18 | 1.4900 | 97.3500 | 97.4300 | 239.4500 | 0.0200 | 11.6200 | 30.0000 | 92.3300 | 0 | 1 | 0 |
| 19 | 1.1200 | 97.3100 | 65.4500 | 106.7000 | 0.0300 | 6.5600 | 21.8100 | 91.5700 | 0 | 1 | 0 |
| 20 | 0.6600 | 97.3500 | 94.7300 | 556.2900 | 0.0500 | 9.6000 | 30.4300 | 95.2700 | 0 | 1 | 0 |
3.2. SOM Methodology
One major feature of artificial neural networks (ANNs) is its ability to adapt to an environment by learning to improve its performance at emulating behaviourial characteristics of an object in an unsupervised manner. The basic SOM is as a nonlinear, ordered, smooth mapping of high-dimensional data manifolds onto the elements of a regular, low-dimensional array, and the mapping is implemented as follows:
- define the set of input variables as a real vector, ;
- associate with each element in the SOM array a parametric real vector: – also called a model;
- define a distance measure between and , denoted as .
In this paper, we adopt the incremental SOM algorithm with a rectangular map topology, as shown in Figure 2.
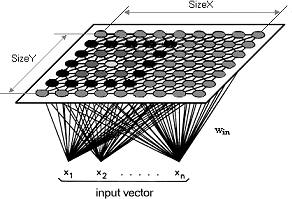 Figure 2. SOM topology; Source [32]
The image of an input vector x on the SOM array is then defined as the array element that best matches with , where the index . The main task here is to define mi in such a way that the mapping is ordered and descriptive of the distribution of . The process in which such mappings are formed is defined by the SOM algorithm. This process is then likely to produce asymptotically converged values for the models mi, the collection of which will approximate the distribution of the input samples , even in an ordered fashion. Vector may be compared with all the in any metric. In many practical applications, the smallest of the Euclidian distance can be made to define the best matching node (BMN), defined by the subscript:
.
3.3. Pattern Recognition Methodology
Pattern recognition is the process of classifying input data into classes based on key features. Two classification methods to pattern classification are identified in the literature and include: supervised and unsupervised classification. This paper adopts the supervised method to pattern classification. The need for pattern recognition in handoff algorithms is essential for evaluating the robustness of communication systems. Pattern recognition application to the handoff process assumes that mobile users travel along same paths within the radio coverage area, and their movements follow the topological structure of the road infrastructure or the architectural structure of the environment. These patterns are then exploited to make handoff decisions and to define the locations where handoff executions are desirable through training of the network – to identify such locations. Pattern recognition can be implemented in a variety of ways and algorithms, and the setting up of a complete pattern recognition based handoff decision system should consider the following tasks:
- Handoff location determination: defining the location depends on the choice of criteria for what an optimal or good enough position a handoff should occur;
- Pattern formation: generating pattern trace of the street, path, etc., with the collected metric samples. The components of the pattern trace are feature matrices associated with the surrounding BSs/APs, which are often referred to as class representatives.
- Data sample collection: using data samples of a chosen metric around the chosen handoff location to train and validate the recognized patterns.
In this paper, a two-layer feed-forward network, with sigmoid transfer function in the hidden layer, and a soft-max transfer function in the output layer is proposed. The number of hidden and output neurons are set to 10 and 2, respectively, and the number of elements in the target vector (the number of categories or classes) is 3 (see Table 1). The input data were randomly divided such that 70% of the samples were for training, 15% for validation, and 15% for testing. The neural network architecture showing the pattern recognition components is presented in Figure 3.
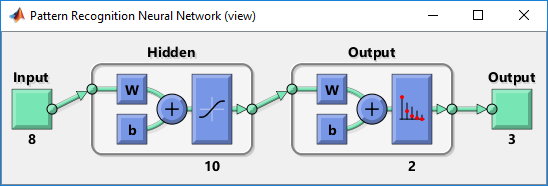 Figure 3. Pattern recognition network architecture
3.4. AHP Methodology
The application of the AHP method to a complex problem usually involves the following major steps [22-23]:
- Define the unstructured problem by describing the hierarchy with the goal at the top, followed by criteria at the lower levels and then alternatives at the bottom.
- Construct a set of pair-wise comparison matrices among decision elements (criteria and alternatives) by establishing priorities among them based on a preference scale of 1 to 9 as shown in table 2.
Table 2. AHP preference scale
| Scale | Definition |
| 9 | Extreme importance |
| 7 | Very strong importance |
| 5 | Strong importance |
| 3 | Moderate importance |
| 1 | Equal importance |
| 2, 4, 6, 8 | Intermediate values |
- Estimate the relative weights (wk) of the decision elements using eigenvector method; where , where is the geometric mean of the kth row.
- Aggregate these relative weights and synthesize them for the final measurements of the decision alternatives.
- Compute the consistency ratio (CR) to determine the acceptability or otherwise of the chosen criteria or alternative; where (CI is the consistency index, and RI is the random index).
3.5. TOPSIS Methodology
The final weight measurements from AHP are used by TOPSIS for ranking of alternatives. In the TOPSIS method two artificial alternatives are hypothesized, i.e. the positive and negative alternatives. The basic rule behind these hypotheses is that the chosen alternative should have shortest distance from positive ideal solution and longest distance from negative ideal solution. TOPSIS makes the decision of alternative that is very near to the best result and very far from pessimistic alternative. The first step transforms attribute dimensions into non-dimensional attributes, which allows comparisons across criteria. The following steps describe the TOPSIS algorithm for network selection.
- Compute root of sum of squares to standardized the overall decision matrix of weights of criteria obtained from AHP method;
- Normalize the decision matrix of criteria acquired from the four candidate networks as listed in Table 1 using (1).
(1)
- Generate the weighted normalized matrix by multiplying the normalized decision criterion with its assigned weight as in (2)
(2)
- Determine the positive ideal solution and the negative ideal solution as in s (3) and (4)
(3)
(4)
However, for beneficial criteria, and while for non-beneficial criteria, and .
- Determine separation from ideal solution by calculating the similarity distance as expressed in (5) and (6),
, (5)
, (6)
- Determine the relative closeness to the ideal solution by calculating as in (7)
, (7)
- Rank the access networks according to the descending order of .
4. Results
4.1. SOM Visualization
We visualize the feature component planes of the SOM in Figure 4. The component planes show which features has a significant influence on the clustering results. Dark colors represent relatively small values while light colors represent relatively large values. Hence as expected, CA, BSCA, CT and HOSR have high range values, whereas DR, BR, UL_TH, and DL_TH have low range values, as predicted. Interestingly, (DR and BR); (UL_TH and DL_TH); and (BSA and HOSR); exhibit similar patterns, and thus signifying strong correlation between the component planes. In practice, we can say that these variables occur in sequence. For instance, block calls usually occur before drop calls, uplink transmission must occur before downlink transmission, and base station controller availability determines the handoff success rate. Cell availability and carried traffic show dissimilar patterns, indicating in practice that one component cannot determine the other – i.e., the carried traffic does not determine cell availability, or vice versa.
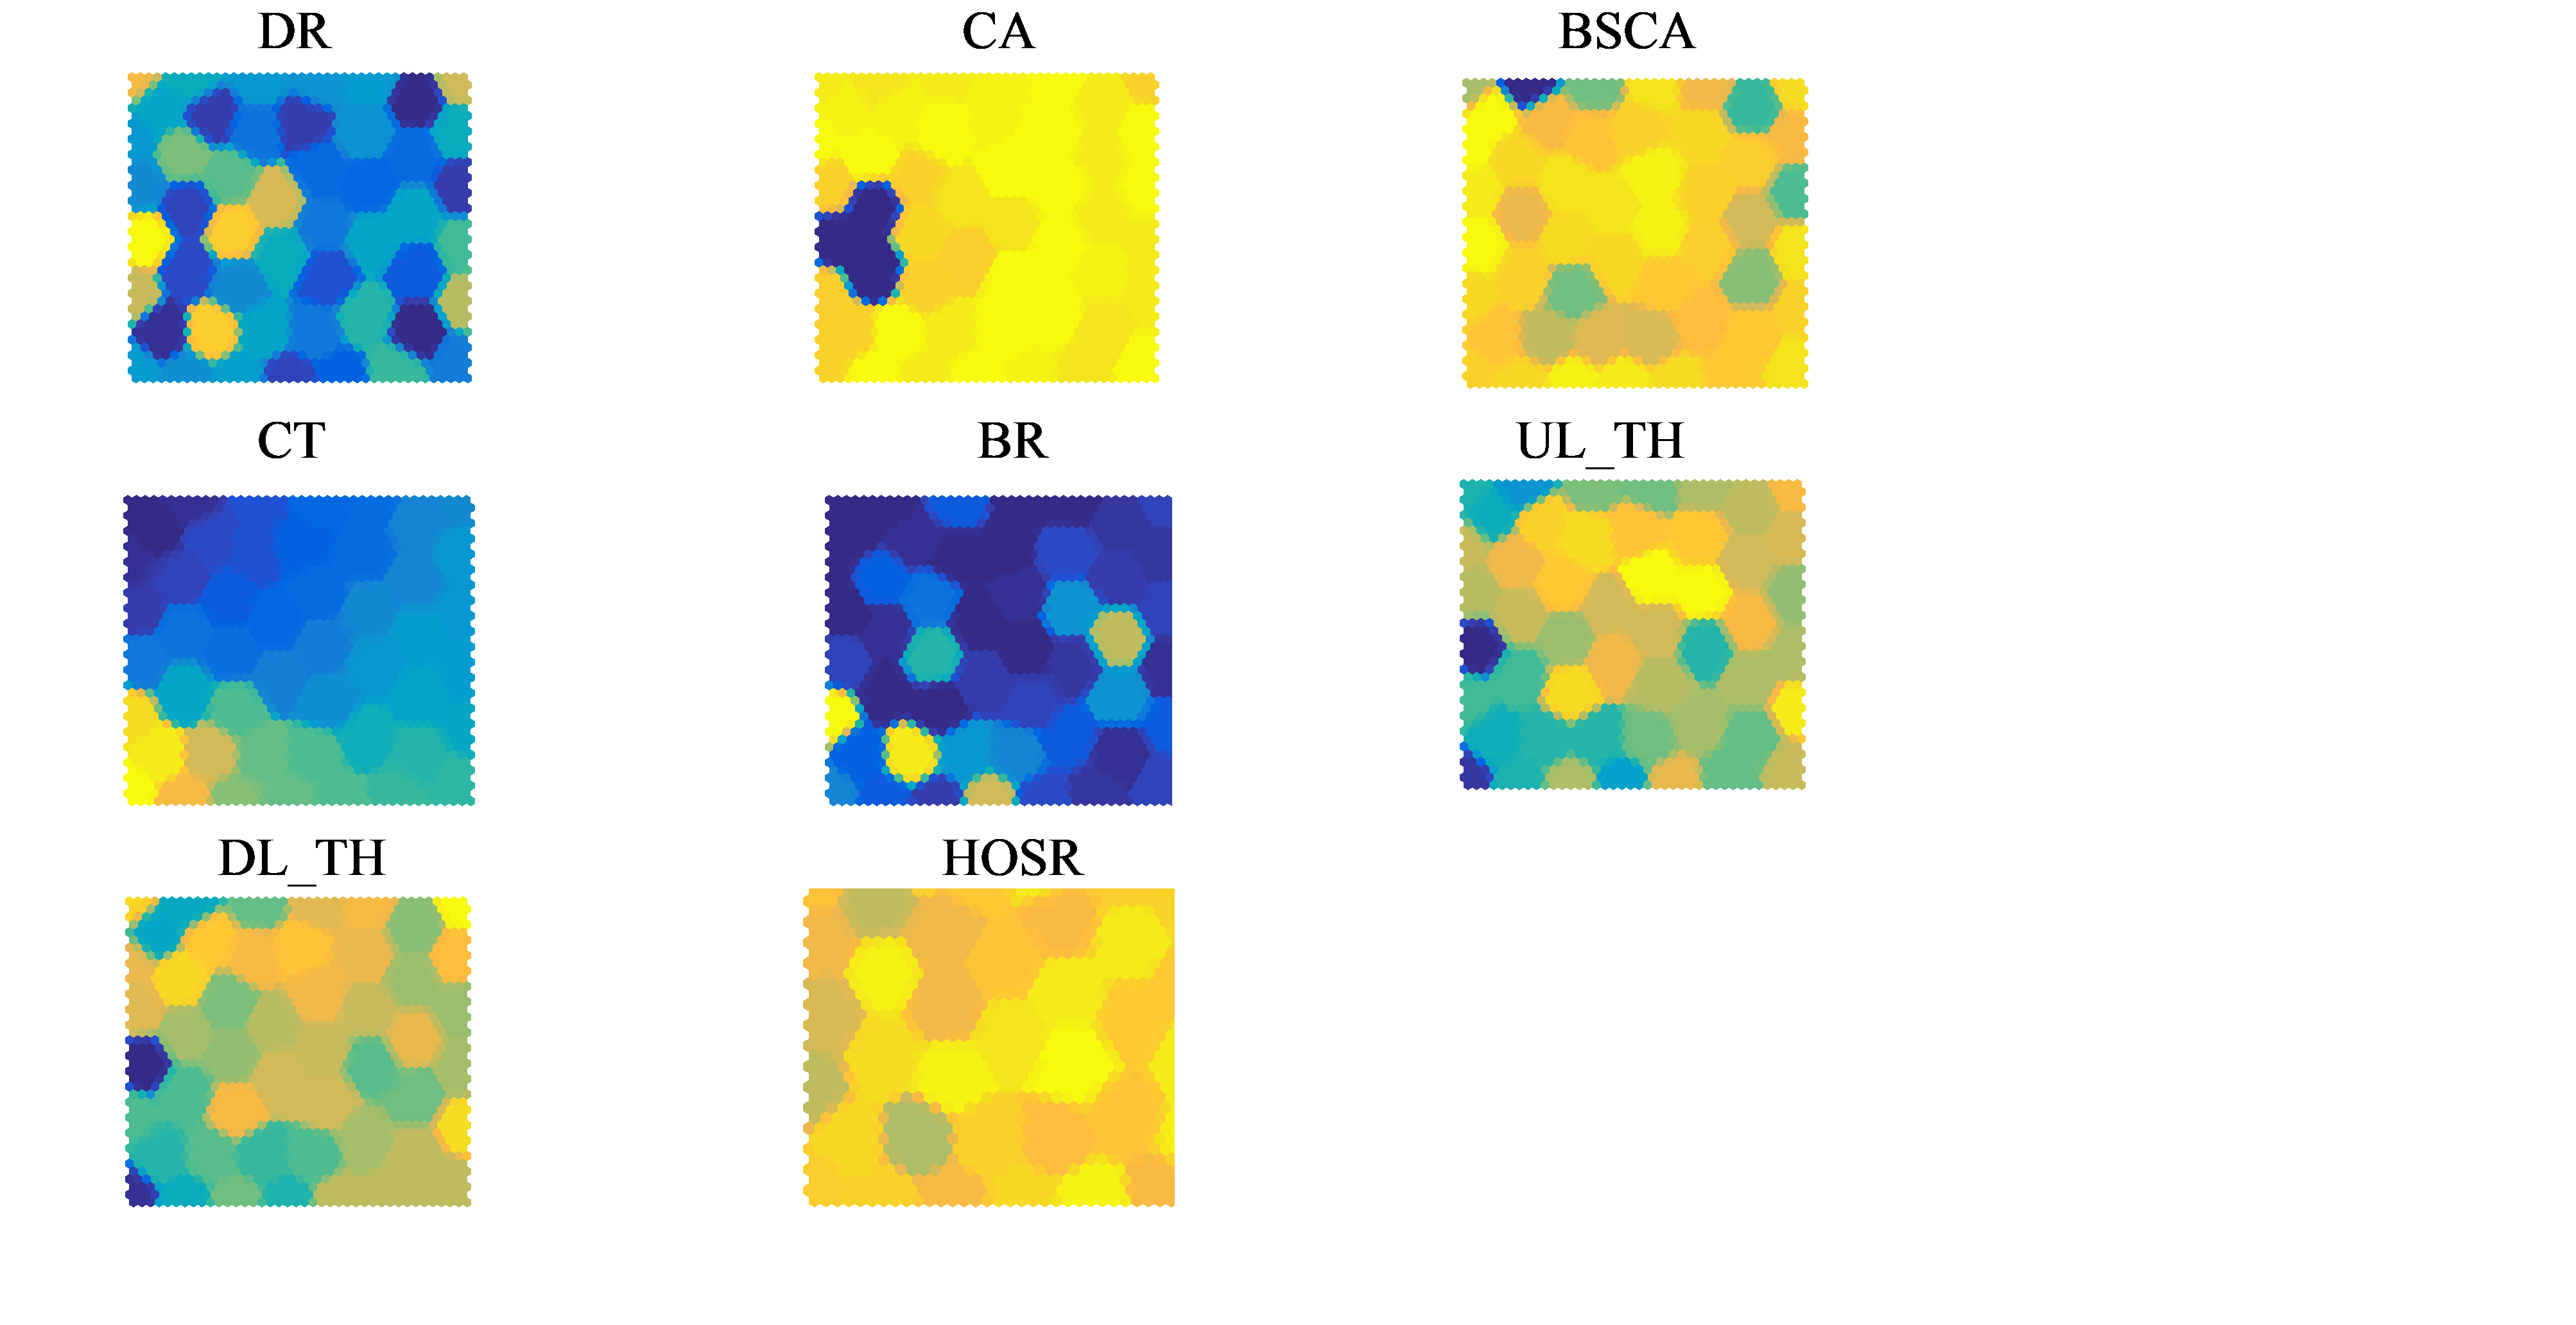 Figure 4. SOM component planes for selected features
4.2. Pattern Classification
Figure 5 shows the performance plots of the neural network for training, validation and test data. We observed that although the error reduced rapidly after the third epoch of training, the validation and test errors were still high even up till the ninth epoch. But the degradation did not cause an over-fit in the training data, and the best validation performance was 0.0559.
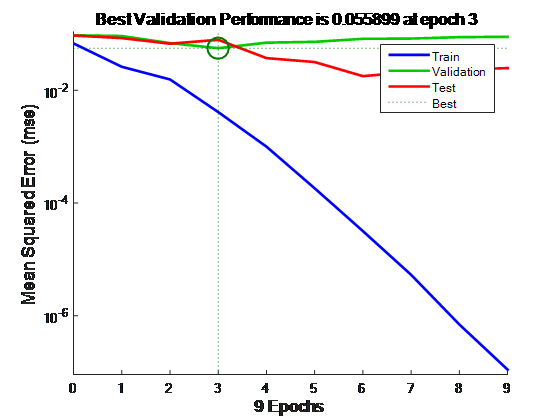 Figure 5. Neural network performance plot for handoff feature data
In Figure 6, the confusion matrix plots for training, validation and test performances of our classifier are shown. We observed that the data were well trained, but some validation and test errors were noticed, as evidenced in Figure 5. The first three diagonal cells in Figure 6 show the number and percentage of correctly classified observations. We concentrate on the overall confusion matrix that takes into account the overall performance of the training, validation and test cases. Hence, 5 BSCs were correctly classified as not satisfactory, corresponding to 10.2% of the overall BSCs within the study area. Similarly, 42 BSCs were correctly classified as satisfactory, corresponding to 85.7% of all BSCs under study. None of the satisfactory cases were incorrectly classified as not satisfactory, 2 of the not satisfactory cases were incorrectly classified as satisfactory – representing 4.1% of all BSCs. Now, out of the 7 not satisfactory predictions, 100% were correct. Also, out of 42 satisfactory predictions, 95.5% were correct, while 4.5% were wrong. Out of 7 not satisfactory cases, 71.4% were correctly predicted as not satisfactory, and 28.6% were predicted as satisfactory. Out of 42 satisfactory cases, 100% were correctly classified as satisfactory and none as not satisfactory. The overall prediction was 95.9%, with 4.1% wrong classifications.
The Receiver Operating Characteristic curve (or ROC curve) shows the tradeoff between sensitivity and specificity (any increase in sensitivity will be accompanied by a decrease in specificity), and is presented in Figure 7. It plots the true positive rate against the false positive rate for the different possible cut-points of the classifier. As can be seen, the distortion in the test data plot is not unconnected with the high total misclassification of not satisfactory cases as satisfactory (see Figure 7). Even with this distortion which came as a result of validation and test errors (see Figure 6), the overall ROC seems a more accurate test, as evidence in the closeness of the curves to the left hand border are noticed, except for the third class (C3) which had no recorded data.
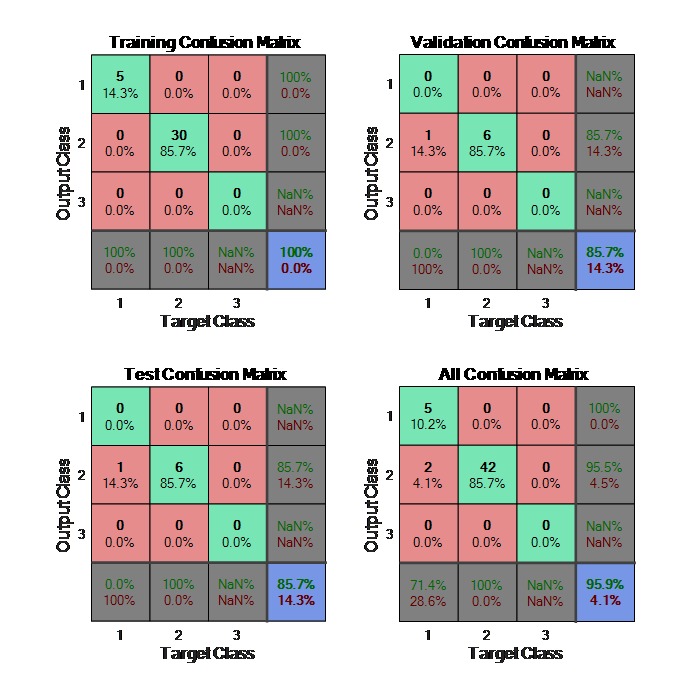 Figure 6. Confusion matrix plots for evaluating our pattern classifier
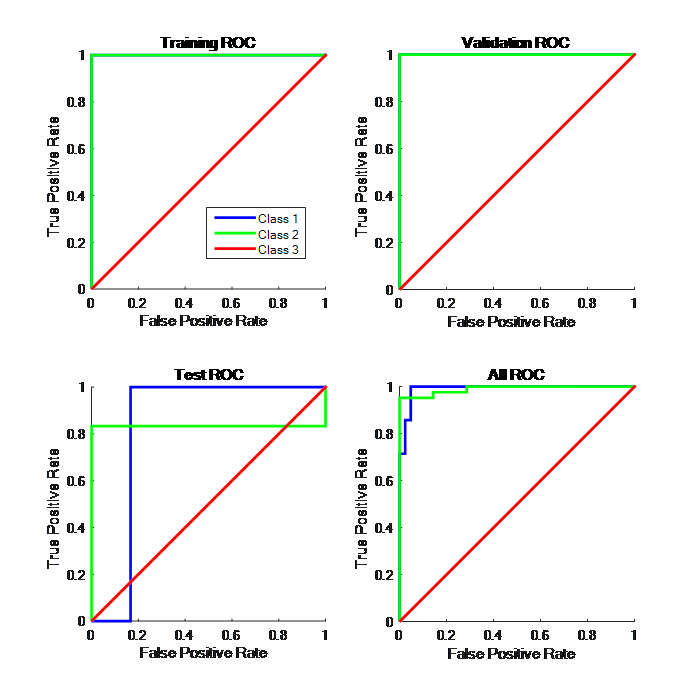 Figure 7. ROC curves showing sensitivity and specificity tradeoffs
4.3. AHP Analysis
To evaluate the performance of synthetic extent analysis and TOPSIS algorithms in network selection, an application scenario of four heterogeneous networks N1, N2, N3, N4 is considered which typically denotes 4G-LTE, 3G-UMTS1, 3G-UMTS2, and WiFi. In such a scenario a MS is assumed to be connected to N1 network and is traversing through an area overlapped by three more networks N2, N3, and N4. So, four networks are available simultaneously to the MS. The MS has to select the best network from the available networks for handoff. For selection process, AHP and TOPSIS algorithms are applied using the most promising values in the membership function of the triangular fuzzy numbers of the Fuzzy AHP method in [5], as AHP values for assignment of weights to criteria. The essence is to comparatively evaluate the performance of synthetic extent analysis with TOPSIS in terms of best network selection. Decision is based on assessing various criteria from each network: Quality of Service (QoS), Available Bandwidth (AB), Security, Cost, Battery Life, Distance between Mobile Node and Base station (DMNBS. The overall decision matrix for the criteria values for network selection are shown in Table 3.
Table 3. Decision matrix showing criteria values
| Criteria | N1 | N2 | N3 | N4 |
| QoS | 0.29 | 0.12 | 0.41 | 0.18 |
| AB | 0.45 | 0.18 | 0.27 | 0.09 |
| Security | 0.40 | 0.13 | 0.20 | 0.27 |
| Cost | 0.33 | 0.17 | 0.39 | 0.11 |
| B. Life | 0.12 | 0.41 | 0.18 | 0.29 |
| DMNBS | 0.33 | 0.13 | 0.20 | 0.33 |
Assignment of Criteria Weights by AHP
Weights are measures of relative importance of criteria. Most of the existing network selection algorithms have employed AHP methodology for assigning weights to the criterion. In AHP, weights are assigned according to the knowledge and perception of the decision maker. It performs measurement through pair-wise comparisons and relies on the judgment of experts to derive priority scales. The AHP procedure for weight determination consists of the following steps:
- Construct pair-wise comparison matrix for the criterion at each level. For each pair, within each criterion award a score, on a scale between 1 and 9 to the better option, and a reciprocal of this value to the other option in the pair. The pair wise comparison matrix of the criteria for handoff calls is shown in Table 4.
Table 4. Citeria-by- criteria pair-wise comparison matrix
| Scale | 5 | 7 | 4 | 2 | 3 | 4 |
| Criteria | QoS | AB | Security | Cost | B.Life | DMNBS |
| QoS | 1.00 | 0.71 | 1.25 | 2.50 | 1.67 | 1.25 |
| AB | 1.40 | 1.00 | 1.75 | 3.50 | 2.33 | 1.75 |
| Security | 0.80 | 0.57 | 1.00 | 2.00 | 1.33 | 1.00 |
| Cost | 0.40 | 0.29 | 0.50 | 1.00 | 0.67 | 0.50 |
| B.Life | 0.60 | 0.43 | 0.75 | 1.50 | 1.00 | 0.75 |
| DMNBS | 0.80 | 0.57 | 1.00 | 2.00 | 1.33 | 1.00 |
| Total | 5.00 | 3.57 | 6.25 | 12.5 | 8.33 | 6.25 |
- Determine the geometric mean of each row for each matrix and normalize the results to obtain the weights for each criterion. This results in table 5.
Table 5. Normalized criteria-by-criteria comparison matrix and weights
| QoS | AB | Security | Cost | B.Life | DMNBS | Wei-ghts (wk) | |
| QoS | 0.20 | 0.20 | 0.20 | 0.20 | 0.20 | 0.20 | 0.20 |
| AB | 0.28 | 0.28 | 0.28 | 0.28 | 0.28 | 0.28 | 0.28 |
| Security | 0.16 | 0.16 | 0.16 | 0.16 | 0.16 | 0.16 | 0.16 |
| Cost | 0.08 | 0.08 | 0.08 | 0.08 | 0.08 | 0.08 | 0.08 |
| B.Life | 0.12 | 0.12 | 0.12 | 0.12 | 0.12 | 0.12 | 0.12 |
| DMNBS | 0.16 | 0.16 | 0.16 | 0.16 | 0.16 | 0.16 | 0.16 |
- Check the consistency of the pair-wise comparison in the normalized matrix. The original comparison matrix is considered not consistent if the columns in its normalized matrix are not identical. Ideally, if is less than or equal to 0.1, the pair-wise comparison is considered acceptable; otherwise the subjective judgment is revised. TOPSIS algorithm requires weights to be assigned to each criterion for further computation of positive and negative ideal alternatives, where the positive ideal alternative is considered to be one with the best value for all attributes.
4.4. TOPSIS Analysis
From the steps in TOPSIS method (see section 3.4), the following results were obtained:
Step 1: Root of sum of squares computation (see Table 6)
Table 6: Root of Sum of Squares for each Criteria
| Criteria | N1 | N2 | N3 | N4 | RSS |
| QoS | 0.29 | 0.12 | 0.41 | 0.18 | 0.46 |
| AB | 0.45 | 0.18 | 0.27 | 0.09 | 0.56 |
| Security | 0.40 | 0.13 | 0.20 | 0.27 | 0.54 |
| Cost | 0.33 | 0.17 | 0.39 | 0.11 | 0.55 |
| B. Life | 0.12 | 0.41 | 0.18 | 0.29 | 0.55 |
| DMNBS | 0.33 | 0.13 | 0.20 | 0.33 | 0.52 |
Step 2: Decision matrix normalization (see Table 7)
Table 7. Normalized decision matrix of criteria
| Criteria | N1 | N2 | N3 | N4 |
| QoS | 0.63 | 0.26 | 0.89 | 0.39 |
| AB | 0.80 | 0.32 | 0.48 | 0.16 |
| Security | 0.74 | 0.24 | 0.37 | 0.50 |
| Cost | 0.60 | 0.31 | 0.71 | 0.20 |
| B. Life | 0.22 | 0.75 | 0.33 | 0.53 |
| DMNBS | 0.63 | 0.25 | 0.38 | 0.63 |
Step 3: Weighted normalized decision evaluation (see Table 8)
Table 8. Weighted normalized decision matrix
| Criteria | N1 | N2 | N3 | N4 |
| QoS | 0.13 | 0.52 | 0.18 | 0.08 |
| AB | 0.22 | 0.09 | 0.13 | 0.05 |
| Security | 0.12 | 0.04 | 0.06 | 0.08 |
| Cost | 0.05 | 0.03 | 0.06 | 0.02 |
| B. Life | 0.03 | 0.09 | 0.04 | 0.06 |
| DMNBS | 0.10 | 0.04 | 0.06 | 0.10 |
Steps 4 and 5: Determination of/and separation from positive and negative ideal solutions (see Tables 9 and 10)
Table 9. Separation from positive ideal solution
| Criteria | N1 | N2 | N3 | N4 |
| QoS | 0.15 | 0.0 | 1.16 | 0.19 |
| AB | 0.0 | 0.02 | 0.0081 | 0.03 |
| Security | 0.00 | 0.0064 | 0.0036 | 0.0016 |
| Cost | 0.0001 | 0.0009 | 0.0 | 0.0016 |
| B. Life | 0.0036 | 0.0 | 0.0025 | 0.0009 |
| DMNBS | 0.0 | 0.0036 | 0.0016 | 0.0 |
| 0.392 | 0.176 | 1.084 | 0.473 |
Table 10. Separation from negative ideal solution
| Criteria | N1 | N2 | N3 | N4 |
| QoS | 0.0025 | 0.1936 | 0.01 | 0.0 |
| AB | 0.0289 | 0.0016 | 0.0064 | 0.0 |
| Security | 0.0064 | 0.0 | 0.0004 | 0.0016 |
| Cost | 0.0009 | 0.0001 | 0.0016 | 0.0 |
| B. Life | 0.0 | 0.0036 | 0.0001 | 0.0009 |
| DMNBS | 0.0036 | 0.0 | 0.0004 | 0.0036 |
| 0.2057 | 0.4459 | 0.1375 | 0.078 |
Step 6: Computation of relative closeness (see Table 11)
Table 11. Relative closeness to ideal solution
| Criteria | N1 | N2 | N3 | N4 |
| 0.392 | 0.176 | 1.084 | 0.473 | |
| 0.2057 | 0.4459 | 0.1375 | 0.078 | |
| 0.5977 | 0.6219 | 1.2215 | 0.551 | |
| /( | 0.344 | 0.717 | 0.113 | 0.142 |
Step 7: Access network ranking (see Table 12)
Table 12: TOPSIS Ranking of the access networks
| S/N | Network | TOPSIS Rank |
| 1 | N1 | 2 |
| 2 | N2 | 1 |
| 3 | N3 | 4 |
| 4 | N4 | 3 |
4.5. Performance Comparison
From [5], the SEA ranking placed the four networks in the following order as shown in table 13.
Table 13. Access Network ranking by synthetic extent analysis
| S/N | Final weight | Access Network | Ranking |
| 1 | 0.33 | N1 | 2 |
| 2 | 0.11 | N2 | 4 |
| 3 | 0.34 | N3 | 1 |
| 4 | 0.21 | N4 | 3 |
The results indicate that for the same set of network decision criteria values, the selected network significantly varies for some reasons. The ranking order of Synthetic Extent Analysis is different from that of TOPSIS for handoff decision in heterogeneous networks. Both methods have similar ranking results for selecting N1 access network and N4 access network as second and third best alternative for roaming by mobile subscribers. Whereas TOPSIS considers N3 as negative ideal solution since if selected presents the user with minimum benefit attributes and maximum cost attributes, synthetic extent analysis considers N2 as least network to switch connection to.
5. Conclusion
Diverse technologies deployed by individual operators in heterogeneous wireless environments require innovative network selection methodologies for provision of always best connected (ABC) services to mobile subscribers. Handling multiple attributes or parameters with different relative importance from each network during handoff decision phase is a huge challenge in such network environment. This paper has exploited two machine learning techniques to visualize the performance of handoff in an existing system; and report on the error levels experienced by the network. It also proposed the use of two multiple attribute decision making (MADM) methods – Analytic Hierarchy Process (AHP) and Technique for Order of Preference by Similarity to the Ideal Solution (TOPSIS) for access network selection and compares the performance of TOPSIS and Synthetic Extent Analysis (SEA) [5] – in ranking the alternatives after assignment of weights to network criteria by AHP.
- M. Zekri, B. Jouaber, and D. Zeghlache. Context aware vertical handover decision making in heterogeneous wireless networks. In Proceedings of the 35th IEEE Conference on Local Computer Networks (LCN ’10): 764–768, Denver, Colo, USA.
- X. Yan, Y. A. Sekercioglu, and S. Narayanan. A survey of vertical handover decision algorithms in Fourth Generation heterogeneous wireless networks. Computer Networks, 54(11): 1848–1863.
- G. Mahardhika, M. Ismail and R. Nordin (2014). Vertical Handover Decision Algorithm Using Multicriteria Metrics in Heterogeneous Wireless Network. Journal of Computer Networks and Communications 2015: 1-8, 2015.
- J. Shi, J. Wu, A. Paul, L. Jiao, and M. Gong, Change detection in synthetic aperture radar images based on fuzzy active contour models and genetic algorithms, Mathematical Problems in Engineering, 2014.
- M. Ekpenyong, D. Asuquo, E. Isong, I. Umoren, and R. Akpan. Optimizing Soft Handoff Latency and Access Network Selection for Next Generation Mobile Communication Networks, In Proceedings of IEEE Future Technologies Conference (FTC 2016), San Francisco, 213-223, 2016.
- Y. Chung and S. Park. Performance evaluation of soft handoff considering macrodiversity effect in multimedia CDMA systems. Telecommunication Systems, 53(2): 179-194, 2013.
- Y. Chung and D-H. Cho. Performance evaluation of soft handoff for multimedia services in intelligent transportation systems based on CDMA. IEEE Transactions on Intelligent Transport System, 4(4): 189-197, 2003.
- X. Ma, Y. Cao, Y. Liu and K. S. Trivedi. Modeling and Performance Analysis for Soft Handoff Schemes in CDMA Cellular Systems. IEEE Transactions on Vehicular Technology, 55(2): 670-680, 2006.
- M. Ekpenyong, J. Isabona and E. Isong. Handoffs Decision Optimization of Mobile Celular Networks. In Proceedings of International Conference on Computational Science and Computational Intelligence, Las Vergas: 698-703, 2015.
- S. Andreev, M. Garasimenko, O. Galinina, Y. Koucheryavy, N. Himayat, S-P. Yeh and S. Talwar (2014). Intelligent Access Network Selection in Converged Multi-radio Heterogeneous Networks. IEEE Wireless Communications, 21(6): 86-96.
- K. Ahuja, B. Singh and R. Khanna (2016). Network Selection Based on Available Link Bandwidth in Multi-Access Networks. Digital Communications and Networks, 2(1): 15-23.
- H. Pervaiz and J. Bigham, “Game theoretical formulation of network selection in competing wireless networks: an analytic hierarchy process model,” in Proceedings of the 3rd International Conference on Next Generation Mobile Applications, Services and Technologies (NGMAST ’09), 292–297, Cardiff, UK, 2009.
- F. Buiati, L. J. G. Villalba, D. Corujo, J. Soares, S. Sargento, and R. L. Aguiar, “Hierarchical neighbor discovery scheme for handover optimization,” IEEE Communications Letters, 14(11), 1020–1022, 2010.
- R. Trestian, O. Ormond, and G.-M. Muntean. Energy-quality-cost tradeoff in a multimedia-based heterogeneous wireless network environment, IEEE Transactions on Broadcasting, 59(2), 340–357, 2013.
- A. Paul, Dynamic power management for ubiquitous network devices. Advanced Science Letters, 19(7), 2046–2049, 2013.
- K. Doppler, C. B. Ribeiro and J. Kneckt, On efficient discovery of next generation local area networks, In Proceedings of IEEE Wireless Communications and Networking Conference, 269–274, Cancun, Mexico, 2011.
- P. Tran and N. Boukhatem. Comparison of MADM decision algorithms for interface selection in heterogeneous wireless networks. In IEEE 16th International Conference on Software, Telecommunications and Computer Networks, 119–124, 2008.
- A. Sgora, D. D. Vergados, P. Chatzimisios. An Access Network Selection Algorithm for Heterogeneous Wireless Environments. In IEEE Symposium on Computers and Communications (ISCC), Riccione (Italy), 890–892, 2010.
- M. Lahby, L. Cherkaoui, and A. Adib. Network selection algorithm based on Diff-AHP and TOPSIS in heterogenous wireless networks. In IEEE proceedings of International conference on multimedia computing and systems, 485–490, 2012.
- K.S.S., Anupama, S. S. Gowri, and B. P. Rao, Network selection in heterogeneous wireless environment using decision making algorithms-TOPSIS AND PROMETHEE, Journal of Theoretical and Applied Information Technology, 75(2), 2015.
- J. Dodgson, M. Spackman, A. Pearman and L. Phillips. Multi-criteria analysis: a manual, Department for Communities and Local Government: London, 2009.
- T. L. Saaty. Decision making with the analytic hierarchy process, Int. J. Services Sciences, 1(1), 83-98, 2008.
- D. E. Asuquo and U. A. Umoh. Analytic hierarchy process for QoS evaluation of mobile data networks, International Journal of Computer Networks & Communications, 7(6), 125-137, 2015
- M. Dagdeviren, S. Yavuz, and N. Kılınç. Weapon selection using the AHP and TOPSIS methods under fuzzy environment. Expert Systems with Applications, 36, 8143–8151, 2009.
- F. Bari and V. Leung, Application of ELECTRE to Network Selection in a Heterogeneous Wireless Network Environment, Wireless Communications and Networking Conference, Hong Kong, 3810-3815, 2007.
- K. S. S. Anupama, S. S. Gowri, B. P. Rao, and T. S. Murali. A PROMETHEE Approach for Network Selection in Heterogeneous Wireless Environment, International Conference on Advances in Computing, Communications and Informatics, Greater Noida (India), 2560-2564, 2014
- H. A.Vine. Comparison between MADM algorithms for Vertical Handoff Decision, Technical Journal, University of Technology and Engineering, Taxila, 1-9, 2010.
- A. Sgora1, P. Chatzimisios and D. D. Vergados, Access Network Selection in a Heterogeneous Environment Using the AHP and Fuzzy TOPSIS Methods, Mobile Lightweight Wireless Systems, In Proceedings of the 2nd International ICST Conference (MOBILIGHT’10), May 10–12, 2010, Barcelona, Spain, LNICST 45, pp. 88–98. Springer, Berlin, Germany 88-98, 2010.
- I. Alkhayat and A. Kumar. End-to-End Mobility Solution for Vertical Handoff between Heterogeneous Wireless Networks, IEEE, 2009.
- Chandralekha and P. K. Behera. Optimization of Vertical Handoff Performance Parameters in Heterogeneous Wireless Networks”, International Journal of Modern Engineering Research (IJMER IJMER, 1(2), 597-601, 2011.
- R. A. Saeed, WiFi/WiMAX Seamless Convergence with Adaptive Vertical Handover for Continuity of Internet Access. Advances in Internet of Things, 1: 32-37, 2011.
- T. Kohonen. The Self-Organizing Map. In Proceedings of the IEEE, 78: 1464–1480, 1990.