Lookup Tables-based mean level detection of spatially distributed targets in non Gaussian clutter
Lookup Tables-based mean level detection of spatially distributed targets in non Gaussian clutter
Volume 2, Issue 3, Page No 1508-1514, 2017
Author’s Name: Nabila Nouara), Atef Farrouki
View Affiliations
Laboratoire SISCOM, Département d’électronique, Faculté de Sciences et Technologies, Université des Frères Mentouri, Constantine 1, Algeria
a)Author to whom correspondence should be addressed. E-mail: nabila_nouar@yahoo.com
Adv. Sci. Technol. Eng. Syst. J. 2(3), 1508-1514 (2017); ![]() DOI: 10.25046/aj0203189
DOI: 10.25046/aj0203189
Keywords: Distributed targets, MDS, Lookup Tables, CFAR detection, Inverse Gamma distribution, Parameters estimation, Maximum Likelihood

Export Citations
In this paper, Constant False Alarm Rate (CFAR) detection of spatially distributed targets embedded in compound Gaussian clutter with Inverse Gamma texture is addressed. By taking into account the fact that clutter parameters are unknown in practical situations, we propose mean level based on Lookup Tables detectors, that operate as a two-step approach, which consists of computing threshold factors that maintain a Constant Probability of False Alarm (Pfa) using intensive Monte Carlo simulations, and storing these factors in Lookup Tables, this first step is done independently from the detection algorithm. Then, at the detection stage, the detectors structure is associated to the Maximum Likelihood (ML) estimation technique to estimate the shape and the scale parameters, and compare them to the closest integer and half integer values in the Lookup Tables, to select the suitable threshold factor. Under the High Resolution Radar (HRR) assumption, the target is spread over a number of cells according to the Multiple Dominant scattering centers (MDS) representation. The binary total binary hypothesis tests are derived using the expression of the overall target energy, which is computed as the sum of the energies reflected from each cell.
Performance analysis of the proposed detectors is carried out using Monte Carlo simulation for various couples of clutter parameters and MDS models, and are compared to those of the Cell Averaging Based on Lookup Tables detector (CA-LT). In order to assess the performances of the proposed detectors in terms of the radar resolution, their performances are compared to the case of point-like targets.
Received: 30 May 2017, Accepted: 18 July 2017, Published Online: 15 August 2017
1. Introduction
It is well established in Radar detection systems that High Resolution Radar systems (HRR) can resolve a target into a number of scatterers, leading to a spatial distribution of the target energy on a number of cells, which is commonly referred to as “distributed targets”. This paper is an extension of the work presented in [1] , in which the detection of spatially distributed targets in compound Gaussian clutter with Inverse Gamma texture has been addressed. In fact, Two detectors are proposed: the Greatest Of based on Lookup Tables (GO-LT) , and the Smallest Of based on Lookup Tables detector(SO-LT) . As for the CA-LT [2], and Both detectors are designed to operate without à priori information about the clutter parameters by first storing threshold factors that maintain a Constant Probability of False Alarm (Pfa) in Lookup Tables, and then estimating the actual clutter parameters using the Maximum Likelihood (ML) method to select the suitable threshold factor to be used in the hypothesis test.
The target energy is considered spread over a number of cells, according to the MDS concept, three MDS models are taken into account, and both the target energy profile and the scatterers locations are specified for each considered model. Moreover, expressions of binary hypothesis tests for both detectors are derived using the expression of the total target energy, formerly proposed in [2]. Detection Performances of (GO-LT) and (SO-LT) are analyzed in terms of the Probability of Detection (Pd) using intensive Monte Carlo simulations, and is compared to those of the Cell-Averaging based on Lookup Tables detector (CA-LT) [2] assuming different MDS models, number of primary cells and couples of clutter parameters.
In [2], the authors introduced the Cell averaging based on Lookup Tables detector (CA-LT), which detects spatially distributed targets embedded in K-distributed clutter with unknown parameters. An expression of the binary hypothesis test for range spread targets has also been derived using the expression of the total target energy, and the performances of the CA-LT have been compared to those of the Logarithmic Cell Averaging detector CAL [12]. Another based on Lookup Tables approach, with non-coherent integration of multiple pulses have been proposed. The latter is designed to detect range spread targets without a priori information about the clutter parameters. By taking into account the non-coherent integration technique, and the target energy profile, the authors derived a new expression of the range spread target energy, and an expression of the binary hypothesis test. The performances of the proposed detectors have been compared to those of OS-GLRT [13], and results indicated that even though both detectors present better detection performance when the target is uniformly distributed on the primary cells, the (M-pulse CA-LT ) still outperforms the OS-GLRT [13]. Detection of range spread targets under the Gaussian assumption has been widely explored with reference to the MDS target model [4]. Initially, it has been analyzed under the Gaussian assumption (see [5,6 and references therein]) . However, with the support of experimental data, it has been demonstrated that the clutter samples from sea clutter returns are better described as a compound Gaussian process. The latter is the product of a temporally slowly varying texture component and a locally rapidly varying speckle component [ 4, 7, 8, and 9]. Consequently, various adaptive detection schemes of range spread targets embedded in compound Gaussian clutter have been proposed and investigated. For instance, the GLRT-based detector [8], the detectors with Rao and Wald tests [4], the GLRT linear quadratic (GLRT-LQ) [9]. Also, the Non-Scatterer density dependent GLRT (NSDD-GLRT) [10], the normalized adaptive matched filter (NAMF) [11] have been investigated under compound Gaussian assumptions.
2. Assumptions and problem formulation
2.1. Clutter model
Under the HRR assumption, sea clutter returns are better described using the compound Gaussian model. In fact, the clutter is sampled from the ith range cell, and is expressed as the product of two components, namely, the texture and the speckle , as follows:
Where is a stationary complex Gaussian process, and and represent the in-phase (I) and quadrature (Q) components of respectively [16]. In this work, we consider that the texture component follows the Inverse Gamma distribution [14], with the Probability Density Function (PDF) of [14, 15]:
Where α is the shape parameter, β represents the scale parameter and Γ (.) is the Gamma function.
Consequently, the magnitude of the clutter, denoted by can be written as [14,15]
The PDF of , namely , is expressed as [16]:
2.2. Target model
According to the MDS representation, the target is considered spread over a finite number of cells , also referred to as “primary data, and its total energy , namely Δ, is expressed as the sum of the partial energies reflected by each range location as follows [2]:
Where are multiplicative factors representing the energy proportion of the kth range cell, and refer to the group under test. Motivated by the work presented in [1,2].We consider in this paper three MDS models , with three and (Np=3) four primary cells (Np=4) . The total useful energy backscattered from each cell and corresponding range locations are given in Table 1.
Table 1: Discrete Scatterers Locations and the amount of the total reflected energy.
|
Model Number |
Cell number | |||
| 1 | 2 | … | Np | |
| 1 | 1/Np | 1/Np | … | 1/Np |
| 2 | 1/2 | 1/2 | 0 | 0 |
| 3 | 1 | 0 | 0 | 0 |
3. Greatest Of and Smallest Of based on Lookup Tables detectors
3.1. Working principle of GO-LT and SO-LT
The proposed detectors are based on the Greatest Of (GO) detector and the Smallest Of (SO) detector to detect spatially distributed targets embedded in compound Gaussian clutter with inverse Gamma texture. The (GO-LT) and (SO-LT) are designed to detect distributed targets using Lookup Tables (LT) and online clutter parameters estimation. As illustrated in Figure 1, the threshold factors that maintain a constant Pfa are computed for different couples of clutter parameters using intensive Monte Carlo simulations and are stored in Lookup Tables (LT). At the detection stage, the clutter parameters the are not a priori, and must be estimated. Therefore, the detectors structures are associated to the Maximum Likelihood estimation (ML) method, which estimates the shape and the scale parameters , . These estimates are compared to the couples of clutter parameters in the Lookup Tables and are approximated to the closest integer or half integer pre-computed value of , once the closest couple of clutter parameters is selected, the suitable threshold factor is indexed accordingly .
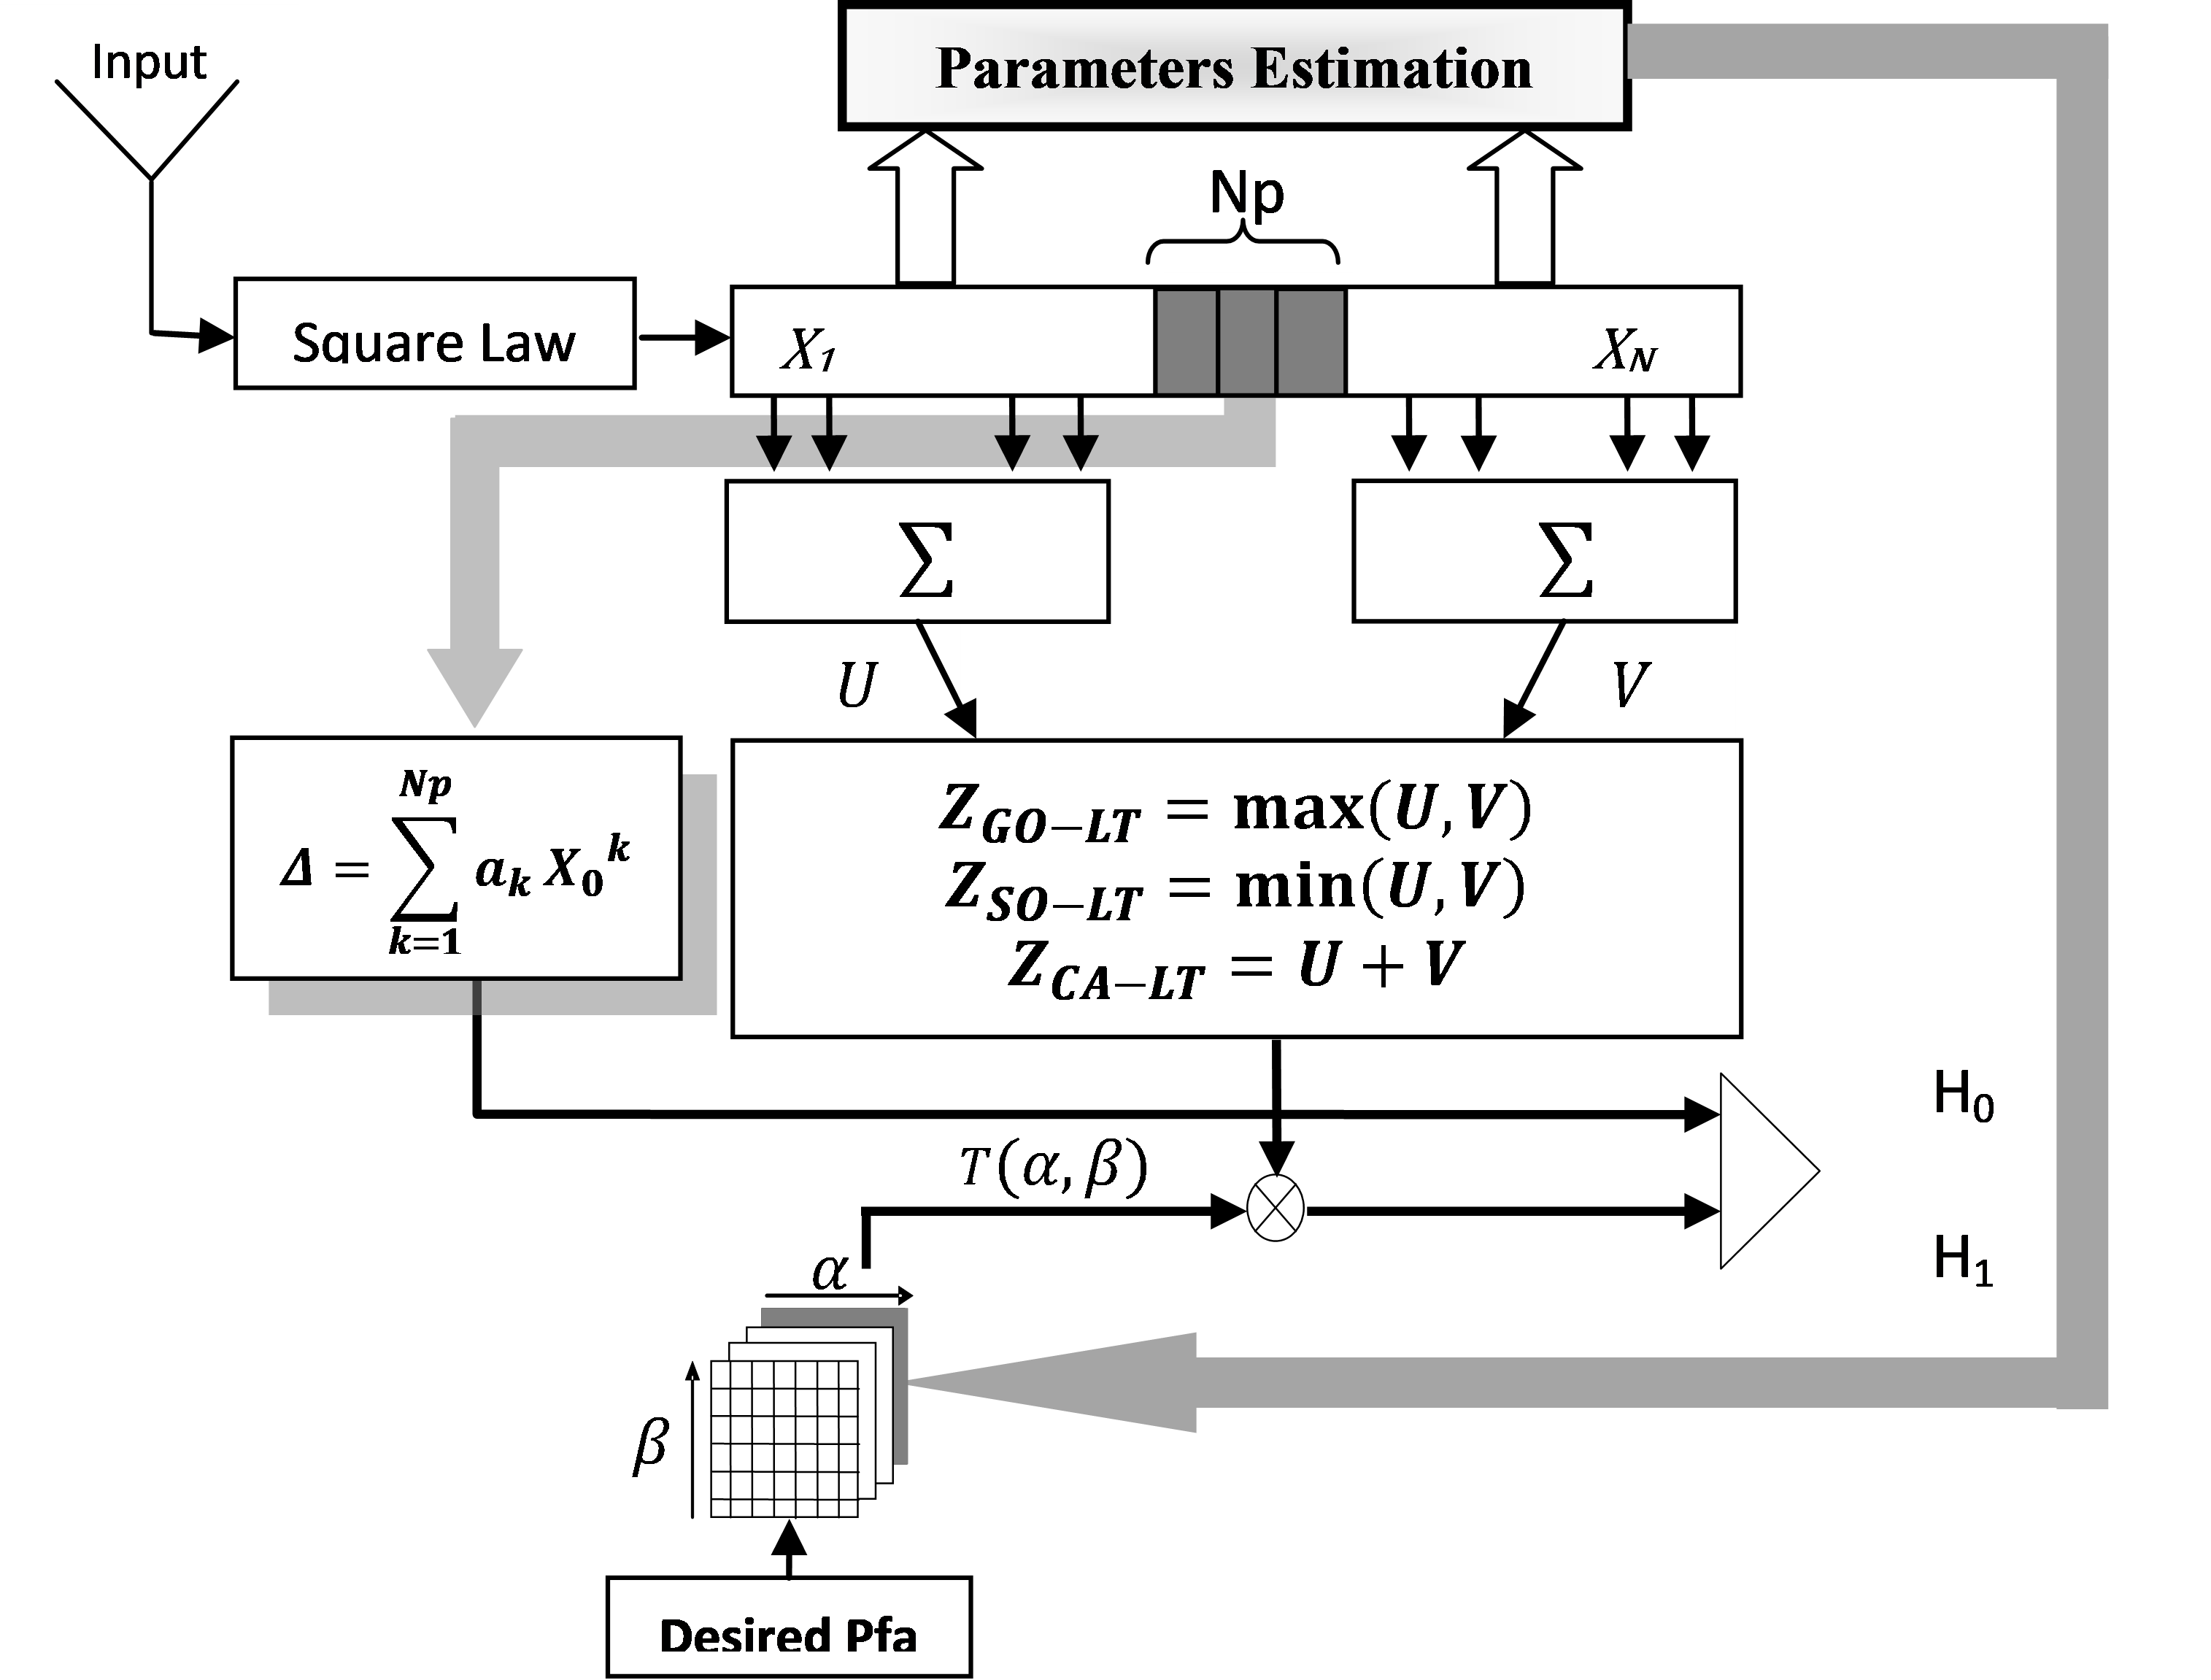 Figure 1: Working principle of GO-LT, SO-LT and CA-LT
The decision about the presence or the absence of a distributed target among the group under test if taken by comparing the total reflected energy Δ to the adaptive threshold multiplied by the clutter level estimate Z. With respect to the proposed detectors, (GO-LT) and (SO-LT), we refer to the clutter level estimates as ZGO-LT and ZSO-LT respectively. The latter are estimated using the N reference cells by selecting the greatest and the smallest of the outputs U and V, as follows:
Here, the outputs U and V are computed as the average of the leading and the lagging reference windows respectively:
Where N/2 refers to the length of the lagging and the leading window.
Moreover, it is well known that in the CA-LT detector [2], the clutter level, namely, ZCA-LT is estimated by computing the mean of the reference cells surrounding the primary cells as follows:
Consequently, the binary hypothesis tests of the GO-LT, SO-LT and CA-LT detectors can be respectively written as:
It is important to note that the previous binary hypothesis test can be used to detect point like-targets by setting Np to 1, and Δ to in (11). Otherwise stated, when the number of primary cells reduces 1, we obtain a single cell under test which leads to:
3.2. Clutter parameters estimation using the Maximum Likelihood (ML) approach
Since the clutter parameters are not known in real radar application, many estimation methods, such as the (ML) estimation method [16] have been explored. In this study, we consider two mean level based on Lookup Tables detectors that are each associated to the (ML) method. The latter is associated to the detectors structure to estimate the shape and the scale parameters in order to automatically switch to the suitable threshold factor T among the pre-computed values in the Lookup Tables. This method is used to estimate the clutter parameters of the compound Gaussian clutter with inverse Gamma texture. As presented in [16], the ML estimate of the shape parameter, namely , is expressed as a function of the clutter samples as follows:
The scale parameter is estimated using the following concentrated Log Likelihood function of β, [16]:
The ML estimate of β, namely, , is a zero point of this function [16]. Therefore, we use the following approach:
First, we compute the function for different values of the scale parameter β. Then, the estimate of β corresponds to the value of β that leads to a zero point of the function.
4. Results and discussion
Performance analysis of the proposed detectors is carried out using Monte Carlo simulations based on 100/Pfa independent trials and considering a nominal Pfa=10-3 and Pfa=10-2.
We analyze the effect of different clutter parameters (α,β)= (1.5,1), (2,1),(2.5,1), and (3,1) on the detection performances of the proposed detectors. For the target, it is considered distributed over Np=3 and Np=4 primary cells respectively, and three MDS models that describe the target energy profile are investigated. Moreover, by taking into account the clutter parameters estimation approach, we set N=64 reference cells
We also consider the following Signal to Clutter Ratio (SCR):
Here , The parameter σ is used to generate the primary cells for different SCR. The term refers to the target power. As for the CA-LT detector [2], the cells under test are scaled by and are summed according to (5). The target’s envelope echoes are described as independent random variables distributed according to the Chi-square law with mean square value [1].
4.1. Threshold factors T(α,β)
The threshold factors maintaining a Constant Pfa of 10-3 of the detectors GO-LT, SO-LT and CA-LT , assuming Np=4 primary cells are given in Table 2, Table 3 and Table 4 respectively. From Table 2 , that refers to the (GO-LT) detector, we observe that for the couple (α,β)=(2,1) , the threshold factor T=0.1514, where as for the couple (α,β)=(1.5,1) the threshold factor T=0.1920 . In fact, the threshold factor values continue decreasing as the shape parameter α increases, which is the case of α=3, where the highest values of T (T=0.1262) is required to maintain a Constant Pfa. Moreover, for couples of parameters with the same values of the scale parameter β, we have the same value of T. For instance, if we consider different couples (α,β) with α=1.5 : (α,β)=(1.5,1) , (1.5,1.5) and (1.5,2) , the required value of T is 0.1920.
From Table 3 and Table 4, we observe that the (SO-LT) and the (CA-LT) detectors exhibit the same behavior with regards to the threshold factors. Lower values of the threshold factor T(α, β) are required to maintain a Constant Pfa for higher values of the shape parameter α, and the same values of T are required to maintain a Constant Pfa when different values of β are considered.Hence, the scale parameter β does not affect the Pfa of all detectors. Hence, it can be scaled to 1 (β=1). We conclude that the proposed detectors guarantee the CFAR property with regards to the scale parameter. Also, by comparing the threshold factors of all detectors, we observe that the SO-LT exhibits the lowest threshold factors for any couple of parameters (α, β).
Table 2: Threshold factors of the detector GO-LT Np=4 , Pfa=10-3
| α β | 1.5 | 2 | 2.5 | 3 |
| 1 | 0.1920 | 0.1514 | 0.1352 | 0.1262 |
| 1.5 | 0.1920 | 0.1514 | 0.1352 | 0.1262 |
| 2 | 0.1920 | 0.1514 | 0.1352 | 0.1262 |
Table 3: Threshold factors of the detector SO-LT Np=4 , Pfa=10-3
| α β | 1.5 | 2 | 2.5 | 3 |
| 1 | 0.2573 | 0.1950 | 0.1715 | 0.1605 |
| 1.5 | 0.2573 | 0.1950 | 0.1715 | 0.1605 |
| 2 | 0.2575 | 0.1950 | 0.1715 | 0.1605 |
Table 4: Threshold factors of the detector CA-LT Np=4 , Pfa=10-3
| α β | 1.5 | 2 | 2.5 | 3 |
| 1 | 0.1090 | 0.0842 | 0.0745 | 0.0681 |
| 1.5 | 0.1090 | 0.0842 | 0.0745 | 0.0681 |
| 2 | 0.1090 | 0.0842 | 0.0745 | 0.0681 |
Table 5: Threshold factors of the detector GO-LT Np=4, Pfa=10-2
| α β | 1.5 | 2 | 2.5 | 3 |
| 1 | 0.1080 | 0.0915 | 0.0900 | 0.0848 |
| 1.5 | 0.1080 | 0.0915 | 0.0900 | 0.0848 |
| 2 | 0.1080 | 0.0915 | 0.0900 | 0.0848 |
Table 6: Threshold factors of the detector SO-LT Np=4, Pfa=10-2
| α β | 1.5 | 2 | 2.5 | 3 |
| 1 | 0.1320 | 0.1202 | 0.1109 | 0.1100 |
| 1.5 | 0.1320 | 0.1202 | 0.1109 | 0.1100 |
| 2 | 0.1320 | 0.1202 | 0.1109 | 0.1100 |
For comparison purposes, we also present threshold factors maintaining a Constant Pfa of 10-2 of the detectors GO-LT, SO-LT and CA-LT , assuming Np=4 in Table 5, Table 6 and Table 7 respectively. We observe that the threshold factors exhibit the same behavior with regards to the clutter parameters, and that the scale parameter β still does not affect the threshold factors values. We also observe that among the three detectors, the SO-LT still requires the lowest value of the threshold factor. On the other hand, by comparing the obtained values of the threshold factors with Pfa=10-2 (Table 5, Table 6, Table 7) to those obtained with Pfa=10-3,(Table 2, Table 3, Table 4), it is clear that the threshold factor is affected by the value of the prescribed Pfa. In other terms, if we consider the same couple of parameters (α,β), the value of the threshold factor that required in the case of Pfa (10-2) is lower than the the threshold factor required in the case of (10-3).
Table 7: Threshold factors of the detector CA-LT Np=4, Pfa=10-2
| α β | 1.5 | 2 | 2.5 | 3 |
| 1 | 0.0581 | 0.0520 | 0.0488 | 0.0475 |
| 1.5 | 0.0581 | 0.0520 | 0.0488 | 0.0475 |
| 2 | 0.0581 | 0.0520 | 0.0488 | 0.0475 |
At this point , it is also important to stress that the previous results have been obtained considering four primary cells (Np=4). Thus , for comparison purposes , and in order to analyze the proposed detectors for different scenarios, we also considered the case of three primary cells (Np=3). The threshold factors T(α, β) that are required to maintain a Constant Pfa of 10-3 in case of three primary cells (Np=3) for the GO-LT, SO-LT and CA-LT are given in Table 8, Table 9 and Table 10 respectively. An interesting result is that higher values of threshold factor T are required to maintain a Constant Pfa for a lower number of primary cells. Otherwise stated , by comparison to the case of (Np=4) , if we decrease the number of primary cells (Np=3), the threshold factor that is required to maintain a Constant Pfa increases .
Table 8: Threshold factors of the detector GO-LT Np=3, Pfa=10-3
| α β | 1.5 | 2 | 2.5 | 3 |
| 1 | 0.2210 | 0.1750 | 0.1520 | 0.1450 |
| 1.5 | 0.2210 | 0.1750 | 0.1520 | 0.1450 |
| 2 | 0.2210 | 0.1750 | 0.1520 | 0.1450 |
Table 9: Threshold factors of the detector SO-LT Np=3, Pfa=10-3
| α β | 1.5 | 2 | 2.5 | 3 |
| 1 | 0.2785 | 0.2240 | 0.1950 | 0.1800 |
| 1.5 | 0.2785 | 0.2240 | 0.1950 | 0.1800 |
| 2 | 0.2785 | 0.2240 | 0.1950 | 0.1800 |
Table 10: Threshold factors of the detector CA-LT Np=3 , Pfa=10-3
| α β | 1.5 | 2 | 2.5 | 3 |
| 1 | 0.1244 | 0.0954 | 0.1520 | 0.0778 |
| 1.5 | 0.1244 | 0.0954 | 0.1520 | 0.0778 |
| 2 | 0.1244 | 0.0954 | 0.1520 | 0.0778 |
4.2. Detection performance
In this section, we examine the detection performances of the GO-LT, SO-LT and CA-LT detectors considering different couples of clutter parameters , MDS models and numbers of primary cells Np , including the conventional case of single range cell , i.e, point like target.Performances are plotted using the Pd versus SCR plots. Detection performances of GO-LT, SO-LT and CA-LT for Np=4 (MDS-1) and Np=3 (MDS-1) considering different couples of clutter parameters (α,β) are presented in Figure 2 and Figure 3, respectively
We first observe that all detectors exhibit better detection performance for higher values of the shape parameter α, which is the case of the couple (α,β)=(3,1). However , all detectors behave the same for any couple of parameters, i,e, all detectors present the same behavior with the couples (α,β)=(1.5,1), and (α,β)=(3,1). This result remains true for any number of primary cells (Np=3 or Np=4).
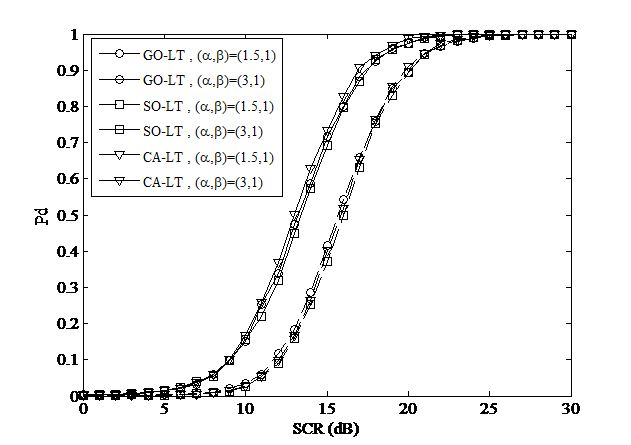 Figure 2: Pd of GO-LT, SO-LT and CA-LT for different clutter parameters (α, β) for Np=4 , MDS-1 ,Pfa=10-3
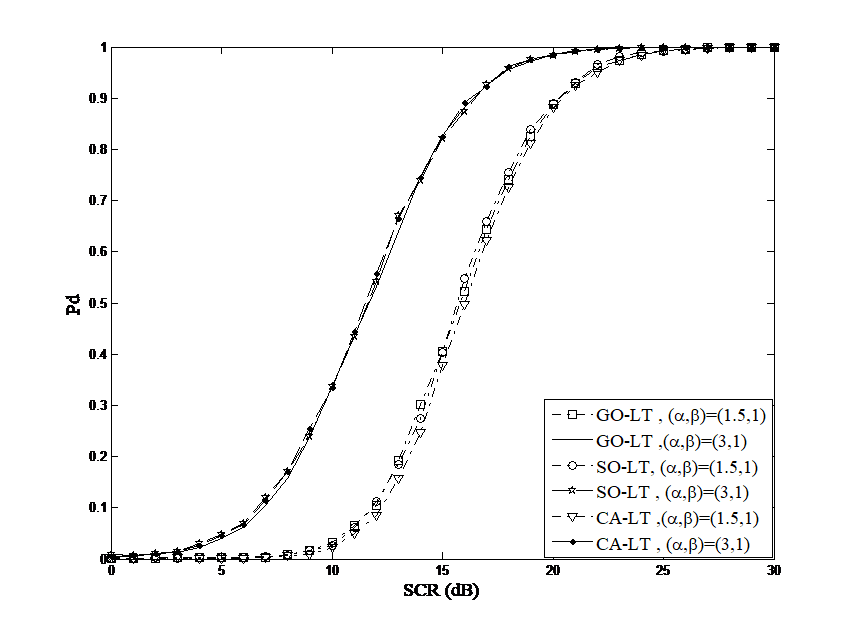 Figure 3: Pd of GO-LT, SO-LT and CA-LT for different clutter parameters (α, β) for Np=3 , MDS-1 ,Pfa=10-3
Moreover, it is important to analyze the effect of the target energy profile, i,e, the MDS model on the detection performances of the proposed detectors. Hence, the Pds of GO-LT, SO-LT and CA-LT against SCR are illustrated in Figure 4, Figure 5 and Figure 6 respectively. We consider that the target is spread over four primary cells (Np=4) according to three different MDS models (MDS-1, MDS-2 and MDS(3). It is shown that all detectors present the best performance with MDS-1 model, and it is degraded with MDS-2 and MDS-3. This result can be interpreted by the fact that all detectors perform best when the target energy is uniformly distributed on the primary cells , and it is degraded as the energy becomes more concentrated in a specific cell as it is the case of MDS-2, and MDS-3 models. Therefore, the MDS-1 model is adopted for the next simulations.
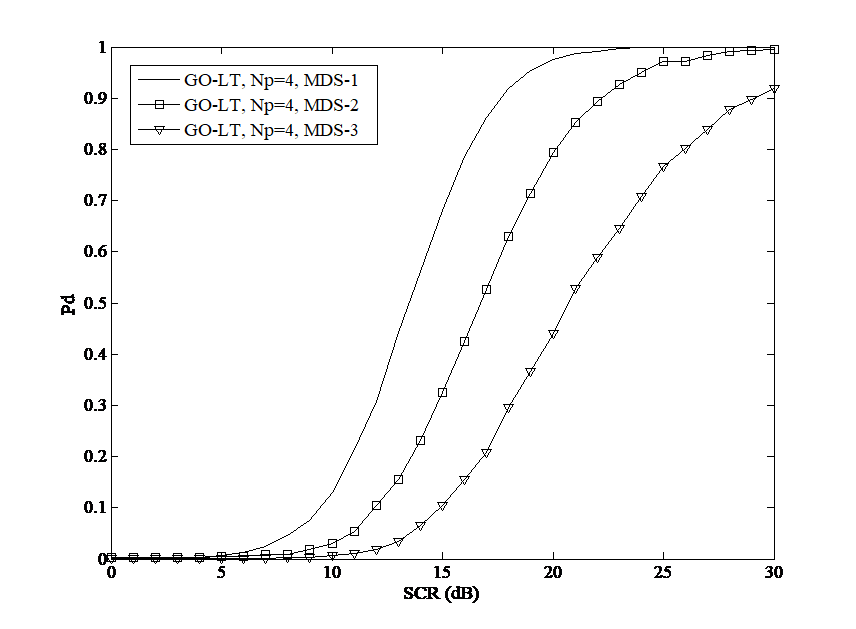 Figure 4: Pd of GO-LT for different MDS models for Np=4
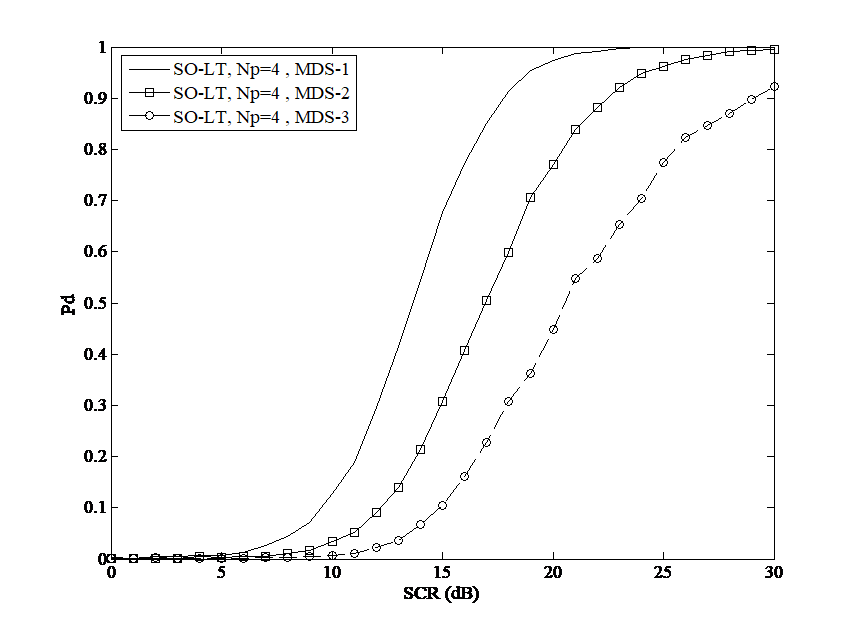 Figure 5: Pd of SO-LT for different MDS models for Np=4
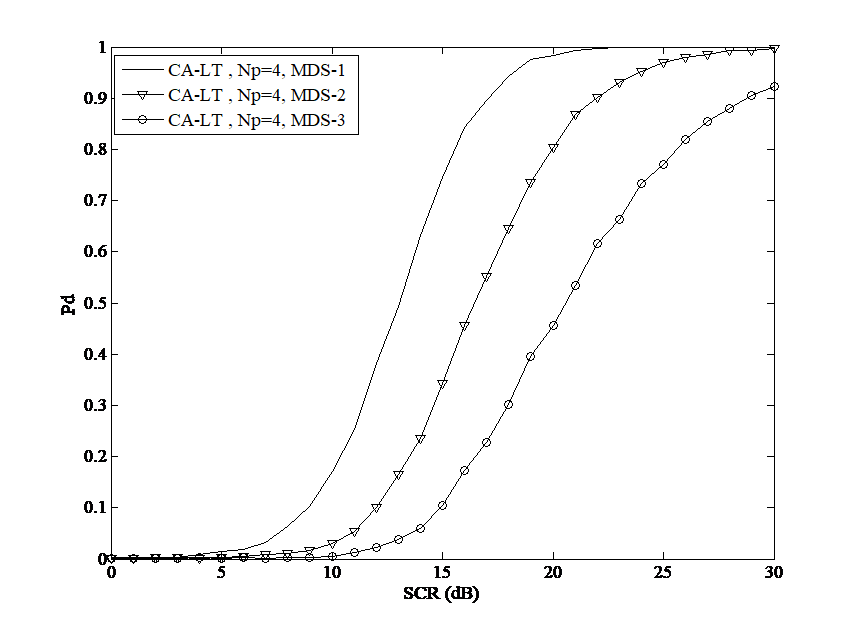 Figure 6: ,Pfa= Pd of C-LT for different MDS models for Np=4
On the other hand, it is important to compare the performances of the proposed detectors considering different numbers of primary cells Np. In Figure 7, we analyze the performances of the GO-LT, SO-LT and CA-LT detectors considering spatially distributed targets with Np=4 and Np=3 , and compare them to the case of point-like targets (Np=1). The plots indicate that the best detection performance is achieved with Np=4 , and it is degraded as the number of primary cells Np decreases (Np=3). We also observe that the proposed detectors exhibit the worst performance with point like targets (Np=1), which is expected since the detection performance is enhanced by increasing the radar resolution, i,e, the number of primary cells.
Another interesting aspect of the proposed detection approach is the online clutter parameters estimation. Therefore, it is important to check the dependency of the Pfa of the proposed detectors on the clutter parameters. In fact, we present the Pfa of the GO-LT , SO-LT and CA-LT , considering a nominal Pfa of 10-3 and 10-2 in Figure 8 and Figure 9 respectively. It is clear that the Pfa of the three detectors does not depend on the clutter parameter α, and it is maintained almost constant for all the values of α. As stated above, the Pfa of the proposed detectors does not depend on the values of the scale parameter β, which indicates that the proposed detection approach ensures the CFAR property with respect to both the shape and the scale parameters.
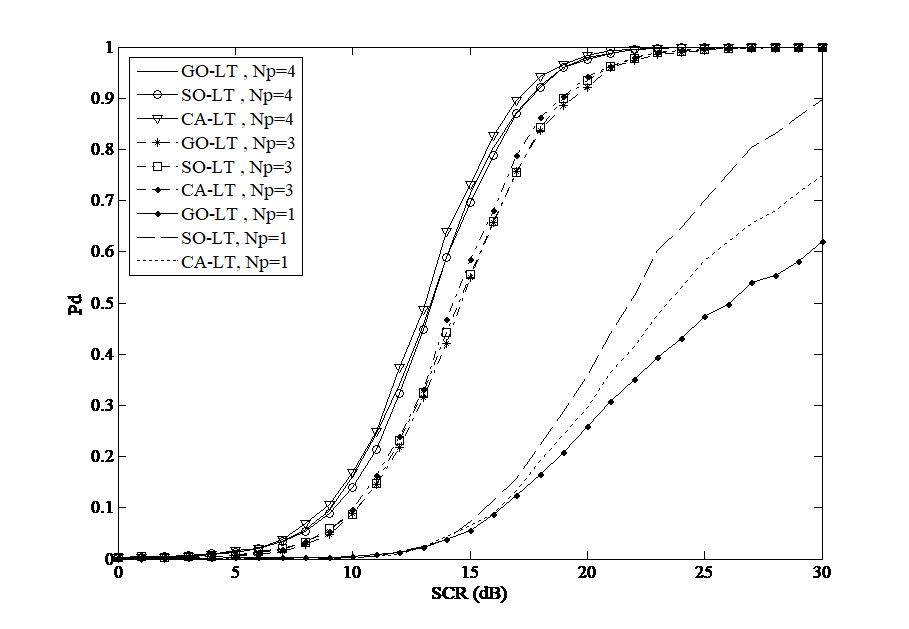 Figure 7: Pd of GO-LT , SO-LT and CA-LT for distributed targets (Np=4) and point-like targets (Np=1)
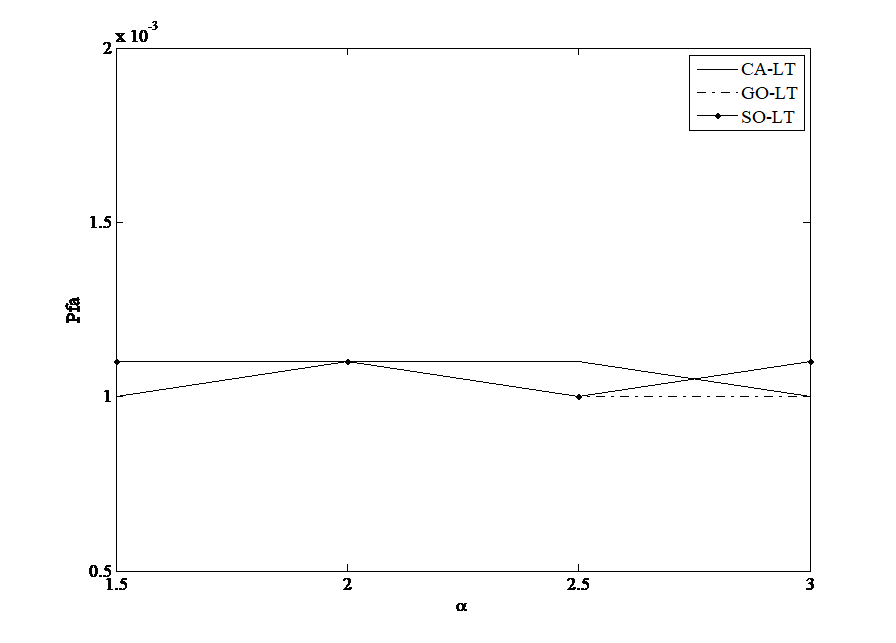 Figure 8: Pfa of CA-LT, GO-LT and SO-LT as a function of the shape parameter α for a nominal Pfa=10-3
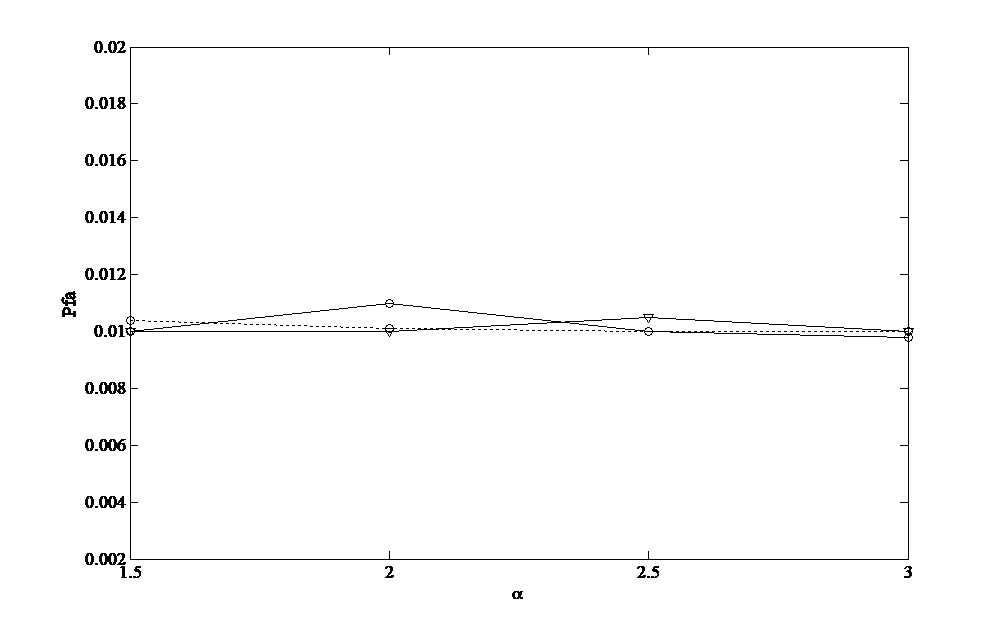 Figure 9: Pfa of CA-LT, GO-LT and SO-LT as a function of the shape parameter α for a nominal Pfa=10-2
Finally, the effect of the scale parameter β on the performances of the CA-LT detector is presented in Figure 10. We observe that the same performance is achieved for different values of β.
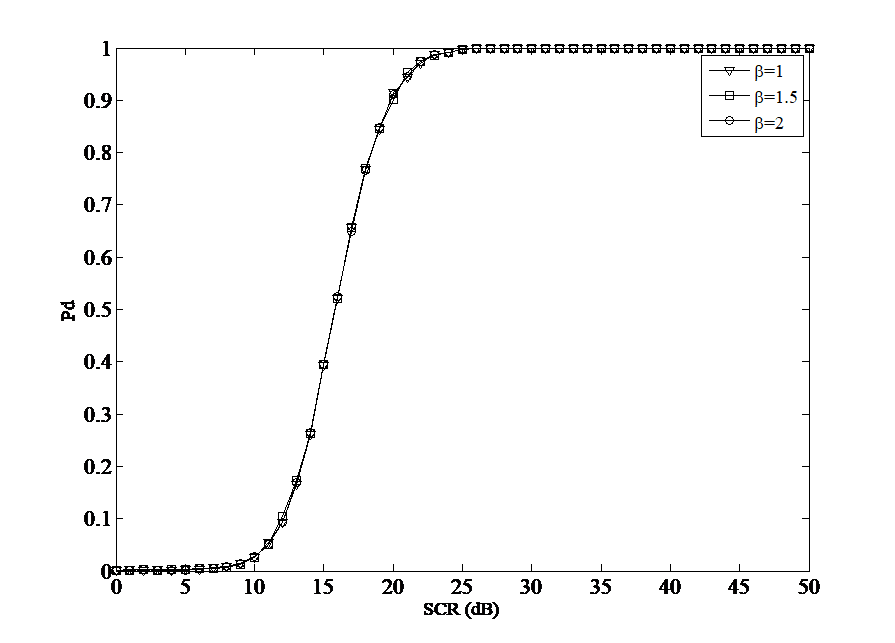 Figure 10: Effect of the scale parameter β on the detection performances of the CA-LT
5. Conclusion
In this paper, the detection of distributed targets in compound Gaussian clutter, with Inverse Gamma texture have been examined by designing a new Look-up Tables based detection approach . In fact, the proposed detectors are based on Lookup Tables that contain threshold factors, maintaining a constant Pfa, for different clutter parameters. Then, the ML technique is associated to the detectors structure in order to automatically switch to the most suitable threshold factor. To decide the presence of the target among the group of cells under test, the selected threshold factor is multiplied by the clutter level estimate and is compared to the total target energy. The performances of the proposed detectors have been investigated assuming three MDS models and compared to the point like targets. Simulation results indicated that all detectors present the best performance, when the target energy is uniformly distributed over the primary cells. However, they still present similar performance when the same MDS model is considered.
Another interesting result with regards to the proposed target energy profile is that all detectors perform better when the number of primary cells increases. Indeed, increasing the number of primary cells in the proposed detection scheme is equivalent to increasing the radar resolution, which can enhance the detection performances.
Finally, we conclude that the proposed detectors are applicable in practical situations since they can operate in more realistic situations such as: target energy profile when HRR systems are considered, and non-availability of priori information about the clutter parameters.
- N.Nouar, A.caFarrouki, “Detection of distributed targets embedded in homogeneous compound Gaussian clutter with Inverse Gamma texture”. In 2017 Seminar on Detection systems Architectures and Technologies (DAT), Alger, Algeria, 2017
- N.Nouar, A.Farrouki, “CFAR detection of spatially distributed targets in K-distributed clutter with unknown parameters”. In Proc.22nd European Signal Processing conference (EUSIPCO ’14), Lisbon, Portugal, 2014.
- N.Nouar, A.Farrouki “Lookup tables-based detection of range spread targets in compound Gaussian environment with multiple-pulse non-coherent integration”. Signal, Image Video Process. 11(61), 1–8 (2017).
- E. Conte, A.De. Maio, “Distributed target detection in compound- Gaussian noise with Rao and Wald tests,” IEEE Transactions on Aerospace and Electronic Systems., 39(2), 568-582, . 2003.
- E. Conte, A.De. Maio, “GLRT-based adaptive detection algorithms for range-spread targets,” IEEE Transactions on Signal Processing.,49(7), 1336-1348,2001.
- H.V. Trees, Detection, Estimation, and Modulation Theory, Part III Wiley, New York, 2001.
- G. Alfano, A.De. Maio, A. Farina, “Model-based adaptive detection of range-spread targets,” IEE Proceeding of Radar, Sonar and Navigation., 151(1), 2-10, 2004.
- E. Conte, A.De. Maio, G.Ricci, “CFAR detection of distributed targets in non-Gaussian disturbance,” IEEE Transactions on Aerospace and Electronic Systems., 38(2), 612-621, 2002.
- F. Gini, M. Greco, “Suboptimum approach for adaptive coherent radar detection in compound-Gaussian clutter,” IEEE Transactions on Aerospace and Electronic Systems.,35(3), 1095-1104,1999.
- K. Gerlach, “Suboptimum approach for adaptive coherent radar detection in compound-Gaussian clutter,” IEEE Transactions on Aerospace and Electronic Systems.,35(3), pp. 1095-1104, July. 1999.
- E. Conte, M. Lops, G. Ricci, “Adaptive matched filter detection in spherically invariant noise,” IEEE Signal Processing Letters,3(8), 248-250, 1996.
- T. Bucciarelli, P.Lombardo , and S. Tamburrini, “Optimum CFAR detection against compound Gaussian clutter with partially correlated texture ,” IEE proceedings-Radar, Sonar and Navigation, 148(4), 95-104, 2001.
- Y. He, T. Jian, F. Su, C. Qu, X. Gu, “Novel Range Spread target detectors in Non-Gaussian clutter”. IEEE Transactions on Aerospace and Electronic Systems.,46(3), 1312-1328, 2010.
- A. Dogandzic, A. Nehorai, J. Wang, “Maximum likelihood estimation of compound-Gaussian clutter and target parameters,” in Proc. 12th Annual Int. Workshop Adaptive Sensor Array Processing (ASAP ’04), Lincoln Laboratory, Lexington, March 2004.
- K.L. Lange, R.J.A. Little, and J.M.G. Taylor, “Robust statistical modeling using the t distribution.” Journal of the American Statistical Association, 84, 881-896, 1989.
- A.Balleri, A.Nehorai, and J. Wang, “Maximum Likelihood estimation for compound-Gaussian clutter with inverse Gamma texture,” IEEE Transactions on Aerospace and Electronic Systems, 43 (2), 775-779, 2007.