A comparative study for using the LBC format for compressing static medical images
A comparative study for using the LBC format for compressing static medical images
Volume 2, Issue 3, Page No 1472-1477, 2017
Author’s Name: Ildikó-Angelica Szöke1, a), Vasile Stoicu-Tivadar1, Diana Lungeanu2
View Affiliations
1Automation and Computers, Politehnica Timisoara, 300223, Romania
2Victor Babes University of Medicine and Pharmacy Timisoara, 300041, Romania
a)Author to whom correspondence should be addressed. E-mail: ildiko.szoke@yahoo.com
Adv. Sci. Technol. Eng. Syst. J. 2(3), 1472-1477 (2017); ![]() DOI: 10.25046/aj0203184
DOI: 10.25046/aj0203184
Keywords: Local Binary Compressed, Local Binary Pattern, Static medical images, Image compression

Export Citations
This paper is an extension of work originally presented at conference Applied Machine Intelligence and Informatics (SAMI), 2017 IEEE 13th International Symposium. The article performs a comparative study between the image compression technique Local Binary Compressed format (LBC) proposed by the authors and the standard image compression techniques used today (BMP, JPEG, PNG and GIF). The study is carried out for large medical images that need to be stored for longer periods of time. In the study, the most common types of medical images used are: X-rays and ultrasounds images. This study aimed to determine the distribution laws parameters used to reconstruct the image as well as to determine the influence of the most used medical image formats on the compression process. The effective representation of image format LBC is proven using an image quality index type, the Structural Similarity Index (SSIM).
Received: 30 May 2017, Accepted: 21 July 2017, Published Online: 10 August 2017
1. Introduction
The progresses made in the computer technology field in the last decade, had as result the almost exponential increase of generated data. Thus, the amount of generated data has increased from five Exabyte’s (EB) in 2003 to 2.8 zettabytes (ZB) in 2012. Compared to 2010, the amount of data [1, 2] increased more than 50 times. In 2020, the world will produce an amount of about 40 ZB data. According to the same study, only 1% of the amount of data produced in 2012 was analyzed. It is worth noting that in late 2012 there were 550 billion archived images comprising over 60% of medical type. For an average size of 20MB of images, amount of archived information [3] with an index of 0.15 compression is 550 billion * 20MB / .15 = 73 Exabyte’s. Therefore, compressing images, especially those of medical nature, has become a topical issue, which will require finding new techniques and formats to be represented by reduced size. This article makes a comparative analysis of LBC compression technique proposed by the authors [1, 2] compared to standard techniques of representation images.
2. Related work
The image compression term refers to the process of reducing the amount of data required to represent the image quality subjective acceptable. This can be achieved by removing the redundancy present in an image [4]. The compression advantage is that it reduces the important resources consumption, such as hard disk space. Implementing an image compression involves storing the image in a bit stream as compact as possible and image decoding as accurately as possible. The needed items are an encoder and a decoder. The encoder receives and converts the image into a series of binary data, which then is transmitted to the decoder input. The decoder decodes picture as accurately as possible [5].
The most important properties of a compression algorithm are the compression rate and the reconstruction quality. The compression ratio is the ratio between the number of bits necessary for representing the data before and after compression.
The following methods are some known image compression techniques [6, 7].The best-known image compression techniques are lossless and lossy compression. The first technique does not cause any loss on image quality and is used in cases where image accuracy is very important, like technical drawings. When using the lossy compression, the original image differs from the reconstructed one but to determine the algorithm’s efficiency an estimation between the two versions is needed.
The Run Length Encoding (RLE) technique relies on image colors repetition. If the image is read from the top left, reading one row of pixels at a time, often rows of pixels of the same color will be obtained. If more than 3 pixels from the row have the same color, then the color and the color number are stored. Using this technique, no information is lost. RLE has been used in PCX format that no longer exists.
Standard Joint Photographic Experts Group (JPEG) specifies the algorithm used for compression and decompression (codec). This format involves loss of visual information. JPG format is good for photos but not equally suited for high-contrast images, such as screenshots or computer art. It is based on the fact that the eye is not sensitive to small color changes. Compression ratio may vary when the image is saved. This format is re-compressed every time a backup is performed; repeated compressions to an image can lead to loss of quality.
Graphics Interchange Format (GIF) is based on limiting the colors depth used in the image. Usually up to 256 colors are used to achieve the color palette – a table that assigns colors to 256 numbers from 0 to 255. The image pixels are then stored using an 8-bit number that represents the color position table. This format is suitable for cartoons and for produced computer art – supports transparency.
Portable Network Graphics (PNG) is using a lossless data compression. PNG is an open-source format, which was created to improve GIF’s algorithm.
Current compression methods are not final. Interesting issues, such as obtaining accurate models of images, optimal representations of these models and rapid processing of those representations are the greatest challenges we face.
3. Proposed Method
The Local Binary Pattern (LBP) method is used to summarize the local structure of images. It labels the image pixels and creates a binary number used for classification in computer vision. This method “looks” at each pixel and tests it with its neighborhood. LBP is tolerant to monotonic illumination changes. The important property is the computational simplicity, which makes it possible to analyze images in challenging real- time settings.
Timo Ojala [5,8] introduced the Local Binary Pattern (LBP) as a fine scale-texture descriptor. LBP is the particular case of the Texture Spectrum model proposed in 1990 [9].
The LPD method divides the image into small 3×3-pixel matrix; each pixel is then compared to its eight neighbors. Then the LBP operator creates label’s forms for the image pixels by looking at the surrounding points (of a central point) and tests whether the surrounding points are greater than the central point resulting in a binary result. It is applied to a 3×3 matrix neighborhood, which means that there are 8 points of comparison thus it produces an 8-bit binary number ( 28 = 256 different labels), which will be converted to decimal and used as a texture descriptor. This operator is effective in the computing plan because it works only with integer arithmetic (allows to reach real-time productivity in some problems), and also invariant to brightness changes on the image, it may be caused by shooting in various conditions of illumination.
As shown in [1, 2], Local Binary Pattern technique (LBP) allows to describe the image texture using a vector with various sizes, depending on the LBP version used. In the classic version, LBP describes a 3×3-texture image area through a single pixel. This pixel defines the border zone relative to the center pixel from the 3×3 area. The values obtained from the entire image texture analysis, lead to a vector with a 256 values size that uniquely defines the original image, which came from. Using this concept, the authors proposed a new image compression technique, which is called Local Binary Compressed format (LBC). The compression technique described in [1, 2] consists in defining the image through two complementary images (by the average and by the dispersion values) of much smaller size obtained by applying the Local Binary Pattern technique method. These two images obtained from analyzing the original image are used for image compression or image decompression [10].
3.1. Image compression
Based on the LBP value constructing mode in the base form [4] previously described, the description for a grayscale image is proposed using two smaller size images [1, 2]:
The first image represents the central values from the 3×3 size areas, which are used in building the LBP value. This image is seen as representing an average pixel defining image texture.
The second image represents the LBP values obtained using the basic version of this technique. This set of values is the ratio (the pixel has a higher or lower value) between the pixels from the 3×3 border area and the central pixel. For this reason, this image is seen as a pixels “dispersion” from the border relative to the center pixel area.
The two images sets represents the compressed image seen in Figure 1.
3.2. Image decompression
Based on the two images – the average and “dispersion” values – the original image can be reconstructed by generating pixels around the average value. The generation process uses existing information in the “dispersion” image. The reconstruction around the average pixels value can use two techniques. Both techniques assume that the distribution pixel values law around the mean value can be a uniform distribution law or a Gaussian distribution law. In both cases, it is necessary to define a dispersion factor [11].
The dispersion factor is used for building the time interval that pixels can take values. Dispersion factor is a numerical percentage applied to the average value type used for constructing the range of pixel dispersion around the mean value. After defining this range, based on the distribution law, pixels values can be generated, then can be added or removed from the central pixel value, depending on the operation direction specified by the attached “dispersion” image (Figure 1).
The factor’s dispersion size and the distribution law are experimentally determined. The criterion in scope is to obtain a similarity index as big as possible between the original image and the resulted image after the compression / decompression. The study was conducted using the ultrasound medical image database containing 6264 JPEG images [12, 13]. All the images from this database were compressed and reconstructed using the [0.1 – 2] % interval dispersion around the LBP range, which was followed by a step of 0.1 in the Gaussian and uniform distribution case. In figures 2a and 2b, the similarity index variation can be seen when using Gaussian or uniform distribution that is used for calculating the dispersion interval of LBP values. It can be noted, for a value of one, for the dispersion range – percentage constant – around the LBP value was obtained a maximum value for the similarity index.
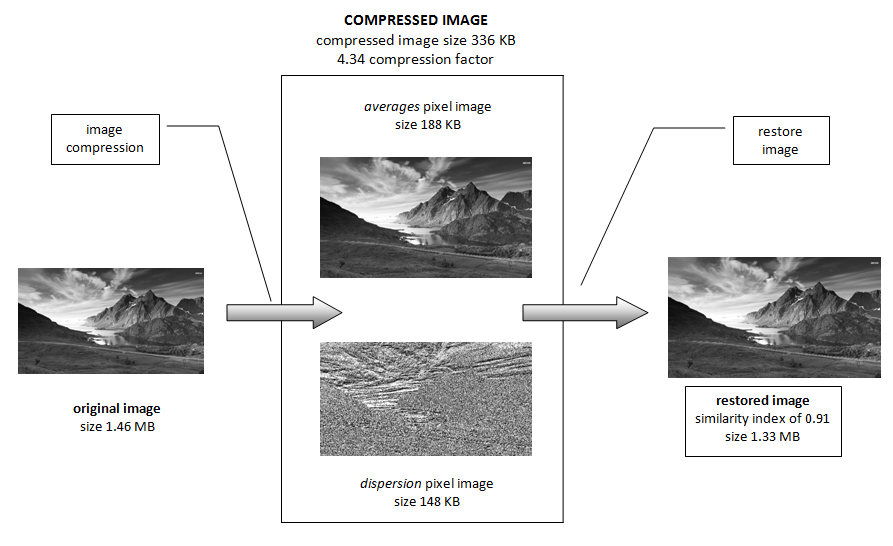 Figure 1. The principle of representing the LBC image format
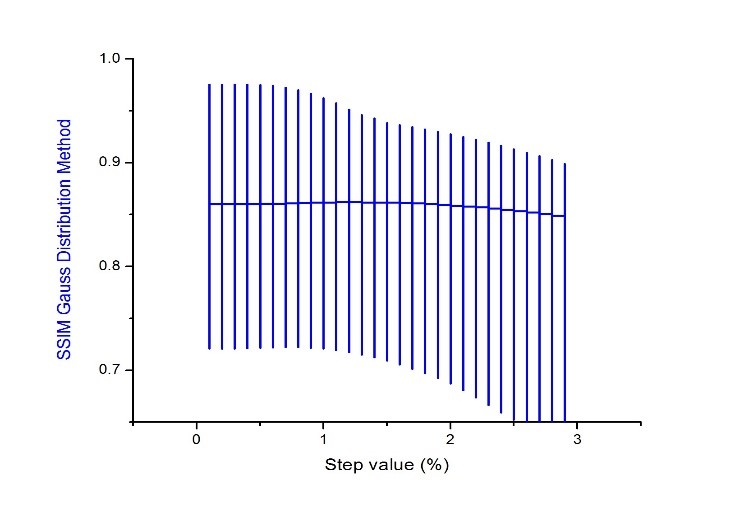
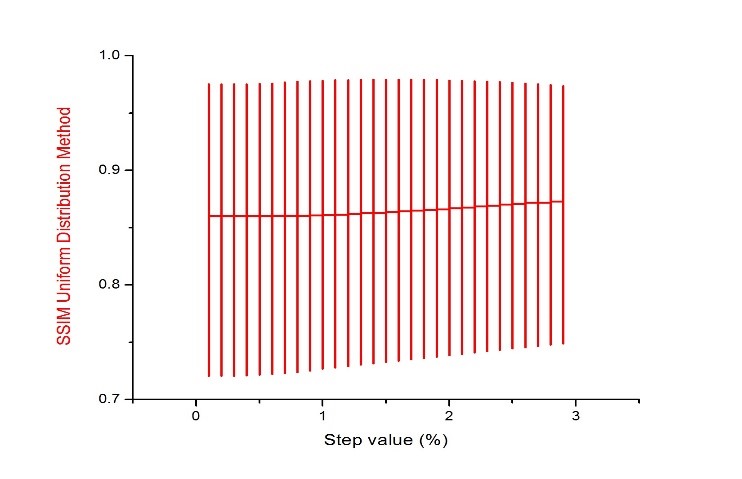 Figure 2a, 2b Similarity index variation for Gaussian or uniform distribution, which is used for calculating the dispersion range of LBP values.Figure 2bFigure 2a
It has been shown that compression index value and the distribution law depend on the image nature and their formats (JPEG, PNG, BMP, JPEG.).
4. Experimental results
Medical images, regardless their source (radiographs, ultrasound, various types of CT scans) have a characteristics set which distinguish them from the photographic images taken with a modern photo equipment. The main feature refers to the fact that they are large images and for the same medical condition, there is a relatively large number of images taken from different angles, trying to capture that medical condition. In general, these are greyscale images. Color images origin from special histological analysis cases or from special ultrasound cases.
The study was carried out on two types of medical images, radiography and ultrasound images. The Structural Similarity Index Metric (SSIM) is used for measuring the similarity between two images and was used [12 – 17] to assess the similarity between the original image and the reconstructed one. For each image types like BMP, JPEG, GIF and PNG formats were considered. The analysis was carried with a dispersion factor of one for the uniform distribution as well as for the Gaussian distribution; a tool developed by the authors was used. A number of six medical images were taken to be analyzed – ultrasound and radiography images.
4.1. X-rays medical image compression
For the experiments, two types of images were taken into consideration: X-ray medical image in JPEG format, for the lossy image compression technique and X-ray medical image in BMP format, for the lossless image compression technique. The obtained results are shown in the following tables: 1a and b. The images taken into account for this study are presented in Figure 3.
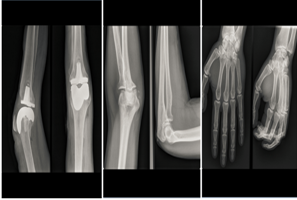
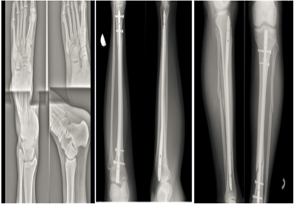 Figure 3 X-ray medical image
Table 1a. X-ray image compression on BMP format
| Image | OrigSize (KB) |
Compression index (LBP method) |
SSIM index Uniform distribution |
SSIM index Gaussian distribution |
| a | 550.223 | 4.038 | 0.902 | 0.862 |
| b | 357.528 | 4.091 | 0.958 | 0.911 |
| c | 414.877 | 4.167 | 0.950 | 0.909 |
| d | 603.895 | 4.318 | 0.868 | 0.828 |
| e | 536.009 | 4.020 | 0.873 | 0.832 |
| f | 365.305 | 3.678 | 0.948 | 0.913 |
Table 1b. X-ray image compression on JPEG format
| Imagine | OrigSize (KB) |
Compression index (LBP method) |
SSIM index Uniform distribution |
SSIM index Gaussian distribution |
| a | 514.960 | 3.895 | 0.896 | 0.858 |
| b | 380.746 | 3.966 | 0.953 | 0.913 |
| c | 387.021 | 3.578 | 0.951 | 0.914 |
| d | 720.333 | 4.310 | 0.856 | 0.813 |
| e | 642.341 | 3.970 | 0.865 | 0.823 |
| f | 383.333 | 3.838 | 0.884 | 0.849 |
Table 1c. X-ray image compression on GIF format
| Imagine | OrigSize (KB) |
Compression index (LBP method) |
SSIM index Uniform distribution |
SSIM index Gaussian distribution |
| a | 482.378 | 2.085 | 0.883 | 0.835 |
| b | 417.590 | 2.174 | 0.918 | 0.872 |
| c | 434.548 | 2.176 | 0.845 | 0.806 |
| d | 544.431 | 2.185 | 0.862 | 0.831 |
| e | 672.021 | 2.209 | 0.892 | 0.864 |
| f | 548.002 | 2.137 | 0.855 | 0.844 |
Table 1d. X-ray image compression on PNG format
| Imagine | OrigSize (KB) |
Compression index (LBP method) |
SSIM index Uniform distribution |
SSIM index Gaussian distribution |
| a | 550.223 | 4.038 | 0.902 | 0.862 |
| b | 357.528 | 4.091 | 0.958 | 0.911 |
| c | 414.877 | 4.167 | 0.950 | 0.910 |
| d | 544.431 | 2.185 | 0.862 | 0.831 |
| e | 536.009 | 4.020 | 0.873 | 0.832 |
| f | 420.034 | 3.986 | 0.884 | 0.855 |
For the experiments were also used GIF and PNG images format.
Analyzing the results, the compression ratio is in the range [2.1, 4.3] for the radiography images types; the similarity index context for uniform distribution is in the range [0.8, 0.96] and the Gaussian distribution it belongs to the range [0.8, 0.92].
4.2. Ultrasound medical image compression
Images, taken into account in this study, are those from Figure 4. Analyzing the results, only JPEG images format were used.
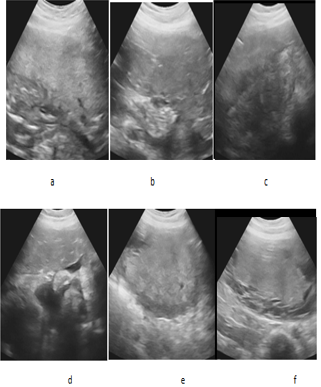 Figure 4. Ultrasound medical images
The results are shown in table 2:
Table 2. JPEG ultrasound medical images
| Image | OrigSize (KB) |
Compression index (LBP method) |
SSIM index Uniform distribution |
SSIM index Gaussian distribuion |
| a | 642.341 | 3.970 | 0.865 | 0.823 |
| b | 720.333 | 4.310 | 0.856 | 0.813 |
| c | 471.541 | 3.885 | 0.948 | 0.907 |
| d | 387.021 | 3.578 | 0.951 | 0.914 |
| e | 514.960 | 3.895 | 0.896 | 0.858 |
| f | 320.896 | 3.851 | 0.960 | 0.913 |
The calculations made to determine the static medical image format influence on the compression process led to the results presented in Table 3. It can be observed that the index compression has the lowest value for the JPG image format (around 3.6), a little higher for BMP image format (around 3.99) and for PNG image format (around 4.01). Behavior is the opposite when we talk about the similarity index, so JPG images show the highest similarity index, and BMP, PNG images have a slightly lower similarity. We can assume that the image format slightly influences the compression index and related similarity regardless of the distribution law type used to reconstruct the compressed image (uniform or normal) [18].
|
Image format |
Compression index |
SSIM Uniform Distribution Method |
SSIM Gauss Distribution Method |
| BMP | 4.013 | 0.899 | 0.914 |
| JPG | 3.593 | 0.912 | 0.933 |
| PNG | 3.999 | 0.899 | 0.915 |
Table 3 Relationship between image format, compression factor and similarity index.
5. Conclusions and future work
Images have become necessary and useful nowadays. The image quality and clarity was developed and improved over time. The image formats performance has increasingly improved over time because our society has become digital. The most used image formats are still widely used because of Microsoft Company – JPEG, BMP, GIF and PNG.
Digital data almost exponential growth is due to the computer technology progress from the last decade and because of the continuous improvement or creation of new algorithms for processing digital data, particularly digital images.
Local Binary Pattern operator is one of the tools that led to improvement in the quality and performance o image compression / decompression, and it is a statistical method and structural analysis for improving the image texture.
One of the many LBP operator benefits is that the topologies can be changed and was changed, according to our app, to get the best results. The method presented so far, use the LBP operator to analysis the static images; there is a controller for dynamic images analysis named space-time. It is used to analyze moving textures, patterns along the proposed method (volume) on the three orthogonal planes.
Compression with the LBC image technique, which is defined by two components (an average value and a dispersion value calculated with the LBP technique type), had better result when for restoring the original image a dispersion factor of 1 was used, in the uniform distribution context used for generating the pixel values.
- The proposed method allows obtain a compression factor in the range [2, 4.5] for medical images. The compression index depends on the image format (PNG, JPEG and BMP). The similarity index obtained belongs to an interval [0.81, 0.94]. From this point of view, the method is part of the lossy compression methods [18]. The study led to the following conclusions:
- The maximum indices performance (compression factor, SSIM similarity index) was obtained when the value 1 is used as the constant that determines the LBP dispersion range size.
- It was determined that the best law that can be used to reconstruct the pixel values is the uniform one. Between the use of the uniform distribution law and the Gaussian distribution law for the reconstruction of pixels, studies have shown that there are small differences between the two laws with a higher quality (compression factor, SSIM similarity index) for the uniform distribution law cases.
- Studies have shown that the original image type that is compressed (the most commonly used medical image formats – BMP, JPG and PNG) do not significantly affect the compression process. However, a conclusion is that BMP and PNG images lead to a higher compression factor with a decrease on the similarity index insignificant.
- The LBC compression method lends itself to further developments; the similarity index can be increased by using new versions of the existing extraction technique – Local Binary Pattern feature
Conflict of Interest
The authors declare no conflict of interest.
Acknowledgment
Politehnica University Timisoara, Romania.
- Ildikó-Angelica Szöke, Vasile Stoicu-Tivadar, Diana Lungeanu, “A comparative study of using the LBC format for compression medical images”, Applied Machine Intelligence and Informatics (SAMI), 2017 IEEE 13th International Symposium; 10.1109/SAMI.2017.7880285.
- Ildikó-Angelica Szöke, Diana Lungeanu, Stefan Holban, “Image Compression Techniques Using Local Binary Pattern”, Applied Machine Intelligence and Informatics (SAMI), 2015 IEEE 13th International Symposium; 10.1109/SAMI.2015.7061863; pag. 139-143, 2015.
- R.Devakuncha, Analysis on big data over the years, International Journal of Scientific and Research Publications, Volume 4, Issue 1, January 2014.
- Sonal, Dinesh Kumar ,” A study of various image compression techniques”, Guru Jhambheswar University of Science and Technology, Hisar , 2005.
- T. Ojala, M. Pietikäinen, and D. Harwood, “A Comparative Study of Texture Measures with Classification Based on Feature Distributions”, Pattern Recognition, vol. 29, pp. 51-59, 1996.
- Matti Peitkinen, Abdenour Hadid, Guoying Zhao, Timo Ahonen- Computer Vision Using Local Binary Patterns, Computational Imaging and Vision, Volume 40 Springer-Verlag London Limited 2011.
- Loris Nannia, Alessandra Lumini, Sheryl Brahnam, Local binary patterns variants as texture descriptors for medical image analysis, Artificial Intelligence in Medicine, 49(2), pp. 117-125, 2010.
- T.Ojala, Multiresolution gray-scale and rotation invariant texture classification with local binary patterns, IEEE Transactions On Pattern Analysis And Machine Intelligence, Vol. 24, Issue. 7, July 2002.
- Wei – Yi Wei ,”An Introduction to Image Compression” National Taiwan University, Taipei, Taiwan, ROC, 2008.
- G.M.Padmaja, P.Nirupama, Analysis of Various Image Compression Techniques, ARPN Journal of Science and Technology, vol. 2, no. 4, pp. 371-376, may 2012.
- Zhang, Hong., Zhang, Xiaofei & Cao, Shun,“ Analysis & Evaluation of Some Image Compression Techniques”, High Performance Computing in Asia Pacific Region, 2000 Proceedings, 4th Int. Conference, Vol. 2, pp 799-803, may 2000.
- Z. Wang, A. C. Bovik, H. R. Sheikh and E. P. Simoncelli, Image quality assessment: From error visibility to structural similarity, IEEE Transactions on Image Processing, vol. 13, no. 4, pp. 600-612, 2004.
- Wang, Zhou; Bovik, A.C.; Sheikh, H.R.; Simoncelli, E.P.,Image quality assessment: from error visibility to structural similarity, IEEE Transactions on Image Processing, 13 (4), 2004, pp. 600–612.
- Dosselmann, Richard; Yang, Xue Dong , A comprehensive assessment of the structural similarity index. Signal, Image and Video Processing 5 (1), 2009, pp. 81–91
- Fuxiang Lu, Jun Huang, An improved local binary pattern operator for texture classification, Acoustics, Speech and Signal Processing (ICASSP), 2016 IEEE International Conference on, 20-25 March 2016.
- L Liu, P Fieguth, Y Guo, X Wang, M Pietikäinen, Local binary features for texture classification: Taxonomy and experimental study, Pattern Recognition Volume 62, February 2017, Pages 135–160.
- D Liu, S Wang, D Huang, G Deng, F Zeng, Medical image classification using spatial adjacent histogram based on adaptive local binary patterns, Computers in Biology and Medicine Volume 72, 1 May 2016, Pages 185–200.
- Ildikó-Angelica Szöke, “Contributions to the digital medical images compressions,” Ph.D. Thesis, University Politehnica Timisoara, 2017.