A Way for Measuring the Temperature Transients of Capacitors
A Way for Measuring the Temperature Transients of Capacitors
Volume 2, Issue 3, Page No 1381-1389, 2017
Author’s Name: Zoltan Sarkany1, a), Marta Rencz1, 2
View Affiliations
1Mentor Graphics, MAD, Budapest, Hungary
2Budapest University of Technology and Economics, Department of Electron Devices, Budapest, Hungary
a)Author to whom correspondence should be addressed. E-mail: sarkanyz@gmail.com
Adv. Sci. Technol. Eng. Syst. J. 2(3), 1381-1389 (2017); ![]() DOI: 10.25046/aj0203174
DOI: 10.25046/aj0203174
Keywords: Thermal transient measurement, Switched capacitor, Simulation model calibration

Export Citations
With the increasing integration level of electronic circuits management of the generated heat became one of the most important design aspects. Beside the semiconductor components capacitors are also affected by the elevated temperature. In this paper a new thermal characterization method is proposed adopting the thermal transient measurement technique for capacitors utilizing the capacitance itself as temperature dependent parameter. The proposed switched capacitor based circuit generates a signal proportional to the capacitance of the component and hence the temperature. The measurement method is demonstrated on self and transfer resistance measurement setups and also verified using CFD simulations. It is shown that the captured thermal transient curve can even be used to fine tune the inaccurate simulation model parameters achieving a more accurate calibrated 3D simulation model.
Received: 30 May 2017, Accepted: 16 July 2017, Published Online: 05 August 2017
1. Introduction
The thermal design of electronic systems received high focus in the last decades as the increasing level of integration increases also the power densities that the designers need to face with. The primary sources of heat are often the semiconductor components, and hence there is extensive research and development on how to construct new components with lower thermal resistance, how to arrange the components appropriately in the system and how to find new cooling solutions in order to avoid overheating.
However, not only the semiconductor components suffer from the increased power densities but also the discrete components like capacitors. The elevated temperature can have an immediate effect on their electric parameters. Changing capacitance and dissipation factor values and increased leakage current usually affect negatively the performance of the overall system. In addition there are also long term consequences of the elevated operation temperature, namely the reliability of the component usually decreases as a consequence.
The operating temperature of the capacitors, just like that of other components depends on the environment, i.e. on one hand on the heating of the surrounding components, on the other hand on the internal heat generation of the device itself. If there is a significant power loss on the capacitor then its internal core temperature can even be significantly higher than the circuit board that is hosting it. For this reason there is an increasingly growing demand towards developing a methodology to measure the thermal behavior and the thermal properties of capacitors.
In order to be able to take these effects into account the thermal resistance between the surrounding components and the capacitor (the transfer resistances) and the thermal resistance between the region of the capacitor where the heat is generated and the environment (the self-resistance) should all be characterized
For thermal engineering of discrete capacitors simulation is the primary method of investigation and characterization [1] although analytical calculations based on simplified models are sometimes also provided in application notes [2-4]. Experimental results are only rarely mentioned in relevant papers or datasheets, although the numerical results should always be verified using experiments.
Key problem is that the core temperature of the capacitors is hard to accurately measure in-situ. Most of the published measurement solutions utilize embedded thermocouples [5] or use infrared temperature sensors focused on a hole drilled in the casing of the component. But all these methods do modifications in the device structure. The published nondestructive methods simply measure the surface temperature only and use approximate calculations to guess the internal temperature of the capacitor. The common issue of all these measurement solutions is the high uncertainty and low reproducibility because of the badly defined sensor placement.
2. Electrical test method
This paper is an extension of the work originally presented in EPTC 2016 [6].
In case of semiconductor components the characterization of the thermal impedance may occur either by using some steady state solutions or more commonly by using the thermal transient measurement [7] method. Although in some cases the junction temperature can be measured using infrared imaging as well, the most commonly used solution is the electrical test method for its simplicity and accuracy.
In case of the electrical test method the inner temperature of the component is measured by utilizing a temperature dependent electrical parameter of the chip itself, like the forward voltage of a constant current biased p-n junction or the threshold voltage of a MOSFET device. This makes the thermal characterization of these components quick and nondestructive and also enables the measurement of the transient response in order to characterize the time domain behavior of the device besides the thermal resistance.
A thermal transient measurement gives information not only about the thermal resistance of the components, but as the time constants of the cooling depends on the building materials and the geometry of the device, it can also reveal structural information.
The output of the thermal transient measurement is usually a cooling curve, showing the inside temperature of the device, continuously from a hot steady state temperature to a cool steady state temperature. Some basic thermal parameters can be calculated from this curve directly. As the heating power is known (P) the junction to ambient thermal resistance can easily be calculated from the peak temperature read at the beginning of the cooling curve (TJ) and the environment temperature that is practically equal to the junction temperature after it has cooled down (TEnv):
Utilizing the whole captured thermal transient data more sophisticated measurements can be implemented using the transient dual interface method as it is described by the JEDEC JESD51-14 measurement standard.
Finally with appropriate mathematical transformations [8] the time constants of the cooling curve can be identified and a one dimensional equivalent RC network can be constructed, where the thermal resistances and thermal capacitances can be associated to the different physical features in the structure.
In order to do thermal transient measurement three mandatory criteria has to be fulfilled:
- An appropriate temperature sensitive electric parameter (TSP) must be found.
- A known heating power must be applied on the component to elevate its temperature.
- The heating power must be switched off abruptly and the transient response of the TSP has to be captured.
If a measurement setup can be constructed that fulfills the above three criteria, the same methodology could be applied for the thermal characterization of discrete capacitor components. In the following sections a possible implementation of the thermal transient measurement for capacitor components will be discussed.
2.1. Temperature measurement
The capacitor temperature can also be measured with an electrical measurement but it needs to be considered that selecting the appropriate temperature dependent electric parameter is a key for the good measurement results. Most of the electric parameters of the capacitors are typically temperature dependent e.g. capacitance, dissipation factor (tanδ) and leakage current.
Any of the electric parameters of a capacitor could be selected for temperature sensing, but it always needs to be considered that unlike in the case of semiconductor chips, where both the dissipation and the temperature dependent electric parameter are well localized, in case of capacitors some parameters might depend on the temperature of several different sections of the structure that not necessarily have the same temperature. In such cases a weighted average temperature is perceived that may or may not be representative to the real device temperature.
The construction of the various capacitor types (electrolytic, tantalum, ceramic and foil capacitors) are different and accordingly not only the electrical, but their thermal behavior is also different.
Due to the significant temperature dependence of the electrochemical properties of the electrolytes, the electrolytic capacitors are the most affected by the temperature [9]. The increasing component temperature decreases the viscosity of the fluid leading to higher charge transfer capability. As a result the equivalent serial resistance (ESR) the impedance and the dissipation factor all decrease. The leakage current however shows significant increase with the temperature. Manufacturer datasheets reported even an order of magnitude change in the leakage current for 100°C temperature change. The capacitance also shows high temperature dependence, but the breakdown voltage and the serial inductance are not significantly affected by the temperature.
The tantalum electrolytic capacitors show similar thermal behavior, but the temperature dependence of the capacitance is lower. The ESR also decreases with the temperature; this dependence is reverse proportional to the ion concentration in the electrolyte. As a result tantalum capacitors with higher ESR show also higher temperature dependence. The leakage current is significantly dependent on the temperature.
The temperature dependence of ceramic and foil capacitors are both primarily defined by the type of dielectric material, i. e. the polymer and ceramics type. The higher permittivity materials show higher temperature dependence. The Calss-1 (ε<200), capacitors show limited or no temperature dependence, while Class-2 (ε ≈ 200 to 10000) devices show high temperature dependence, often not linear or not even monotonous.
Finally the capacitance of the foil capacitors show either positive (Polyester) or negative (Polystyrene and Polypropylene) temperature dependence.
2.2. Capacitance as a temperature dependent parameter
It is visible that there are numerous options for the selection of the temperature dependent parameter, but we wanted to select one that can be used for various capacitor types. We selected the most obvious parameter that almost always shows significant temperature dependence, this is the capacitance.
The temperature dependence of the capacitance is mainly based on the temperature dependence of the dielectric material used in the structure, hence its location is well defined in the component. It has to be noted however that due to the relatively low thermal conductivity of the materials in the capacitor relatively high temperature gradients can arise inside the device, thus the measured temperature is an average value.
As a demonstration of the concept a couple of different capacitors have been selected with different capacitance values and voltage ratings and were calibrated. For the calibration the capacitors were put in a climate chamber, the temperature was increased from 10 to 90°C in 10°C steps. At each temperature level the capacitance value was measured with a simple multimeter repeatedly until we did not see further change in its value. When the capacitance value stabilized we could assume that the component stabilized at the environmental temperature and the capacitance value was registered. This low accuracy measurement method was already sufficient to give a rough picture on the temperature dependence of the selected components. In Figure 1 and Figure 2 the relative change of the capacitance is plotted as the function of temperature.
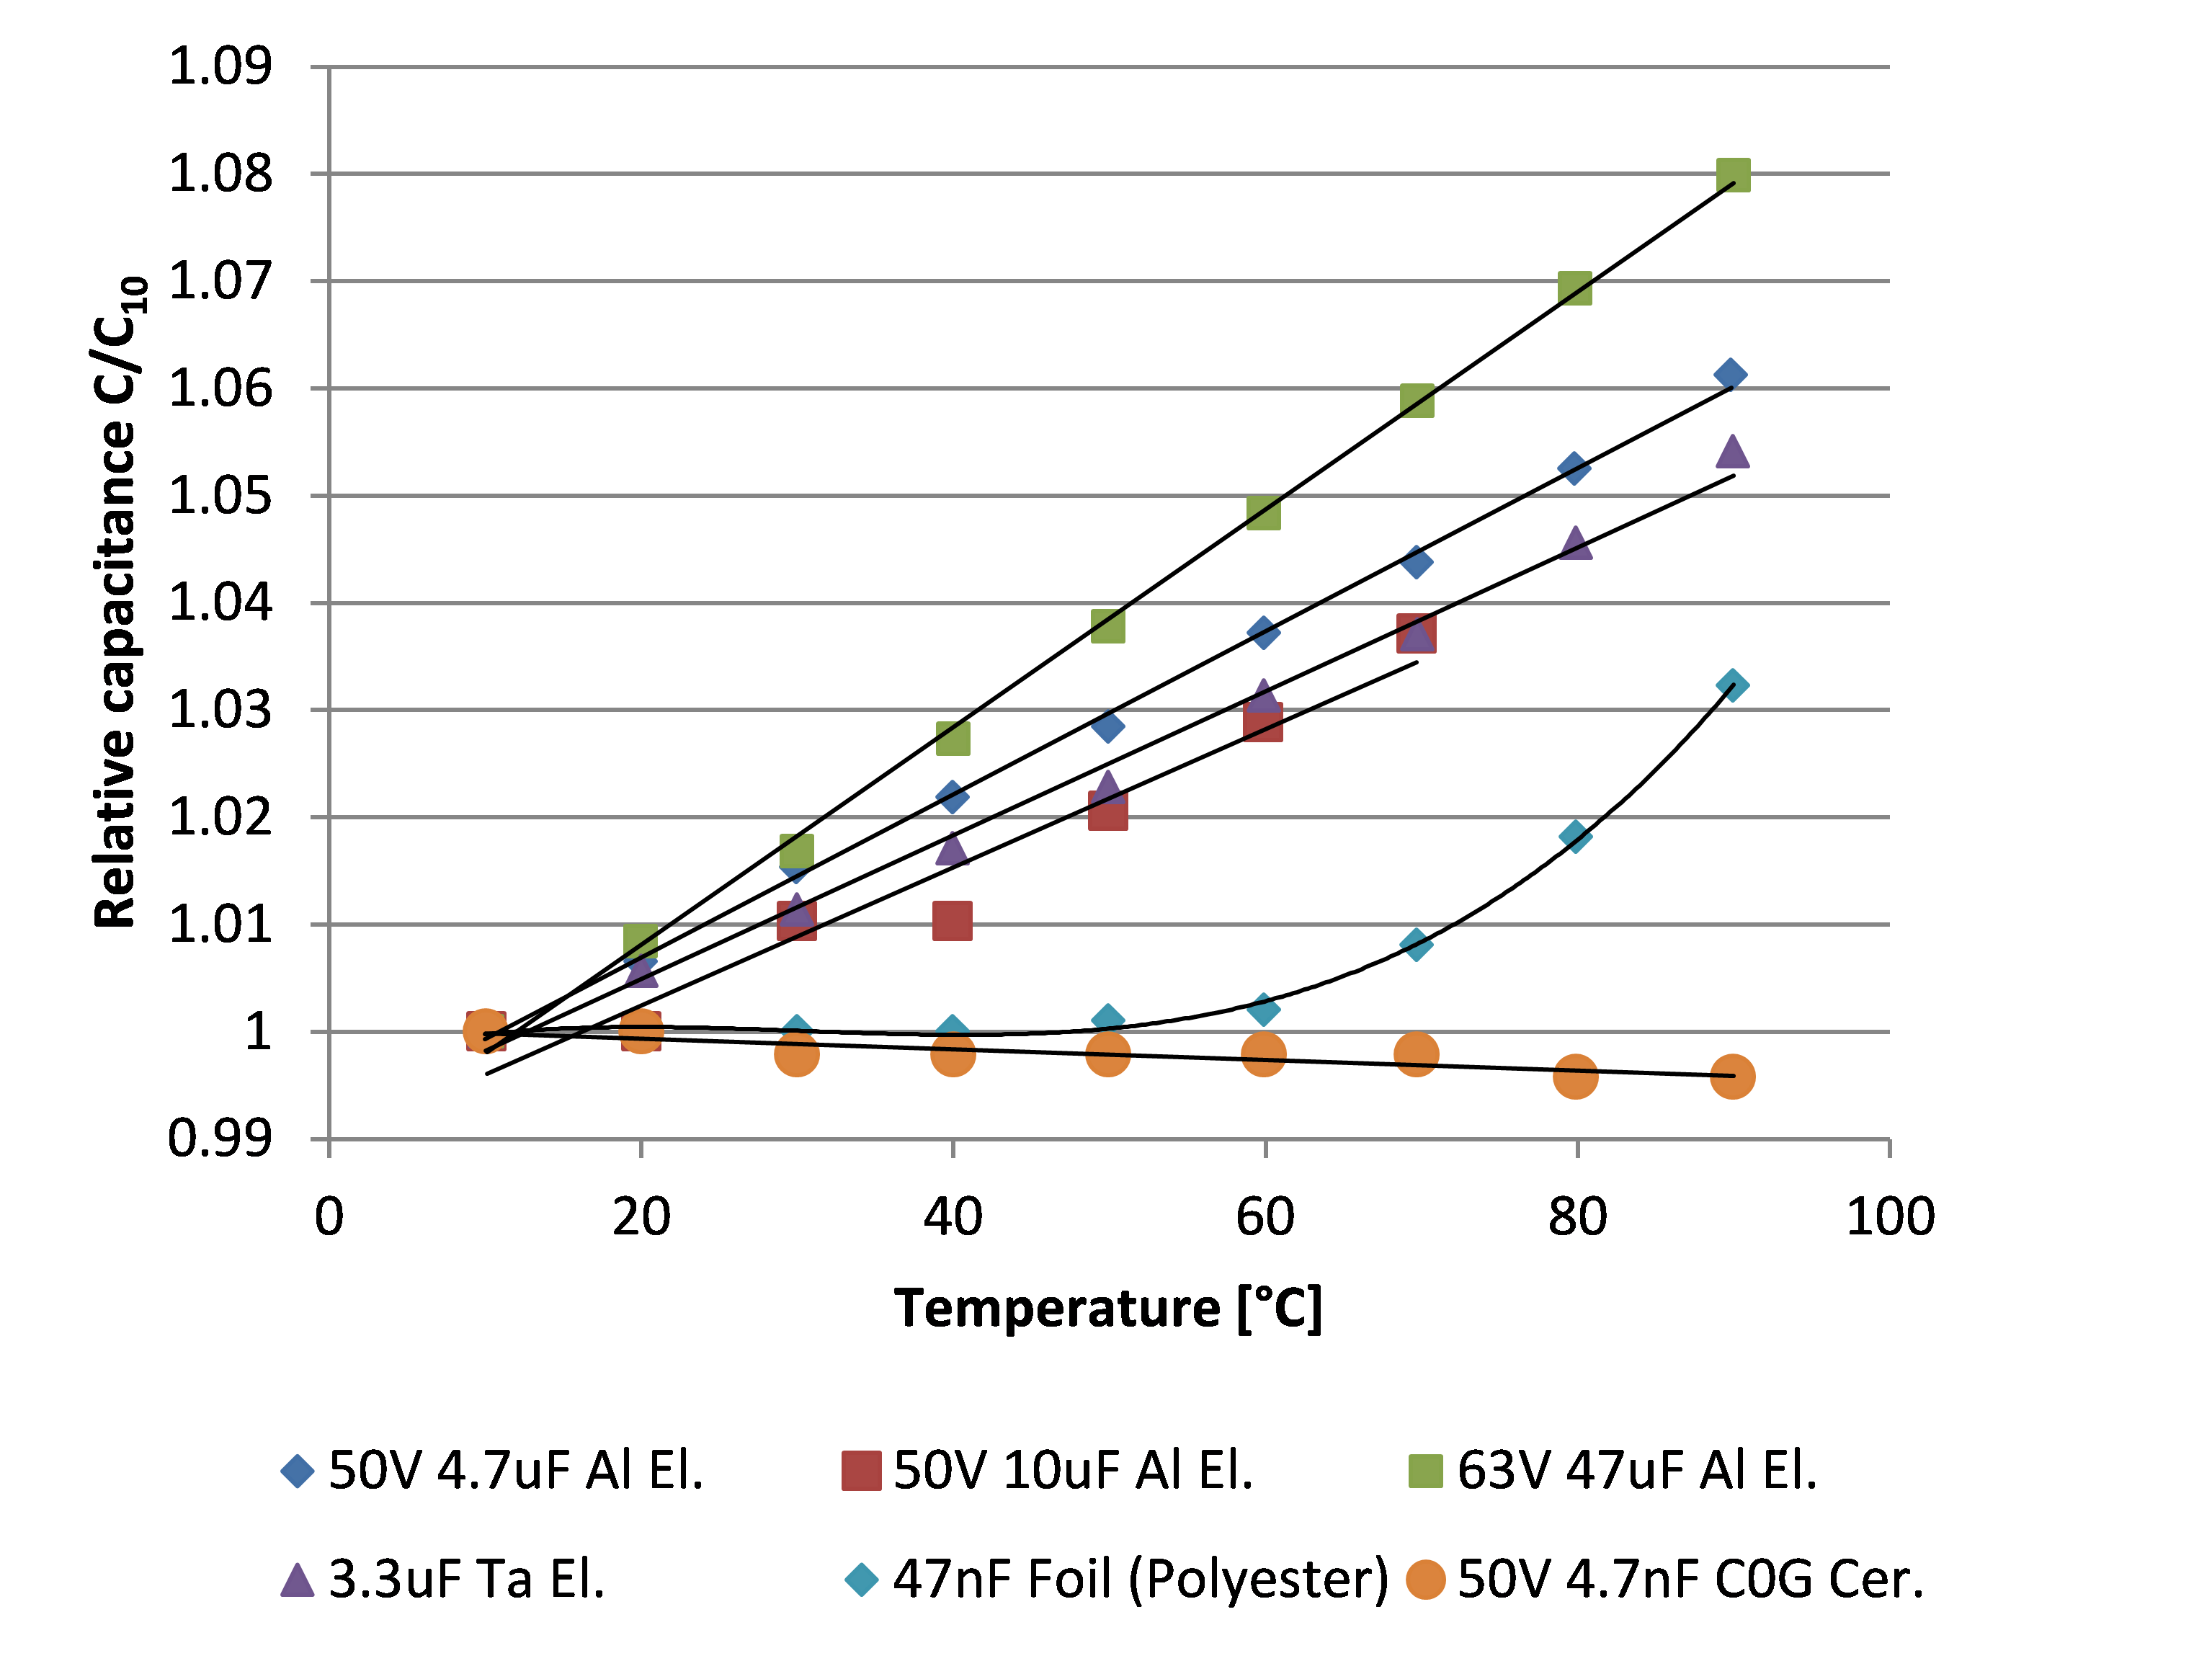 Figure 1 Temperature dependence of various capacitors measured with a simple multimeter, low dependence
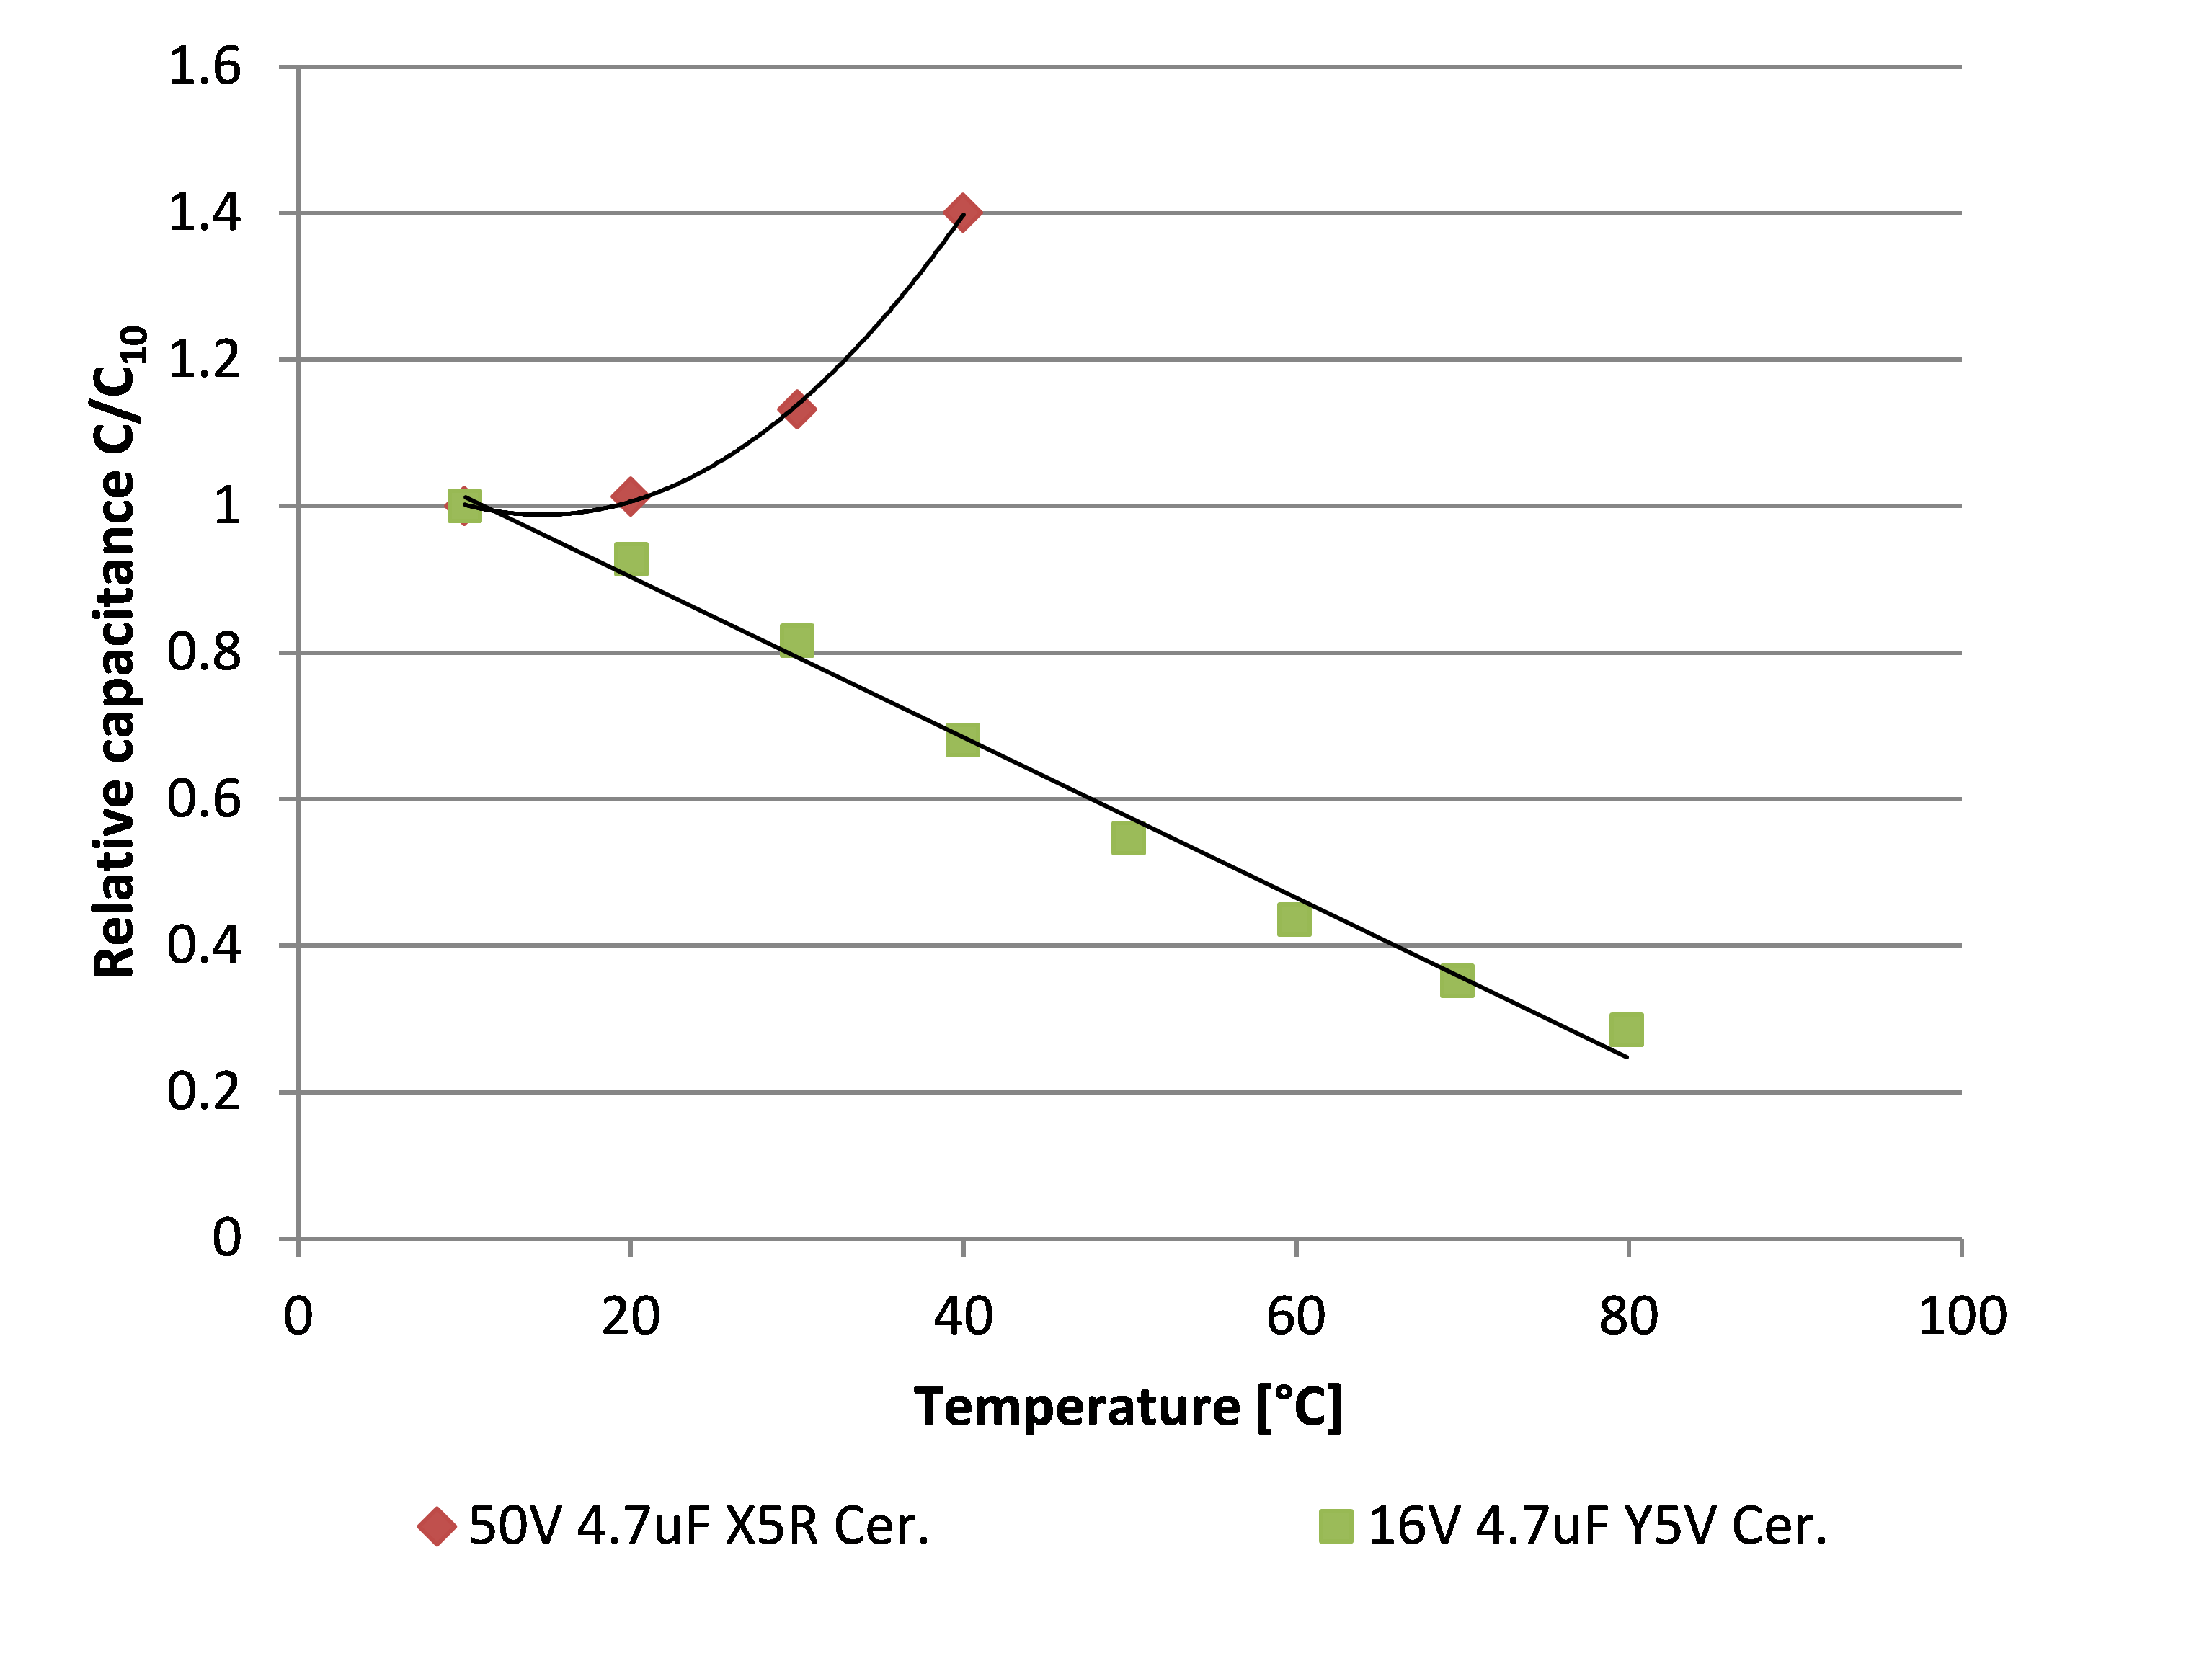 Figure 2 Temperature dependence of various capacitors measured with a simple multimeter, high dependence
The different electrolytic capacitors, both the Aluminum and the Tantalum types had similar magnitude of temperature dependence, the capacitance increased linearly by 5-8% in the 10-90°C range.
The ceramic capacitors showed very different temperature dependence depending on their classification, while the polyester film capacitor showed strong nonlinearity.
2.3. Applying heating power
After the temperature dependent electrical parameter has been selected one must find a way to heat up the component. The heating power is either generated in the component itself (self-heating) by the ripple current, or by an external component (cross-heating). Both cases can be examined with appropriately selected electrical and mechanical setups.
3. Experimental setup
Although the accuracy of a simple multimeter was sufficient for the demonstration of the temperature dependence; in precise measurements a more sophisticated instrumentation is needed. Moreover, in order to be able to measure the thermal transient of the component, the temperature needs to be measured with a relatively high frequency.
On the other hand measuring the absolute value of the capacitance is not required. For our application it is enough to produce a voltage signal that is proportional to the change of the capacitance, hence the change of the device temperature. It has to be noted however that for accurate self-resistance measurement the heating and sensing points must be at the same geometrical location otherwise the results will be distorted. For optimal interfacing to our existing thermal transient measurement system the optimal transient signal has to be in the 0…5 V voltage range.
After considering the available options we found that a switched capacitor system can be used to generate the required signal with high flexibility to adjust to various capacitance values.
The high level block diagram of the measurement circuit is shown in Figure 3.
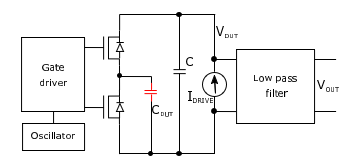 Figure 3 Block diagram of the experimental measurement setup
By driving the MOSFETs with non-overlapping clock signals the tested capacitor (CDUT) is being periodically charged and discharged. The average current transferred towards the measurement ground is proportional to the DUT (Device Under Test) capacitance (CDUT), the switching frequency (f) and the applied voltage drop (VDUT). The switched capacitor can be represented by an equivalent resistance:
In the arrangement presented in Figure 3the capacitor C is charged with a constant current Idrive, and discharged by the switched capacitor circuit. In equilibrium state the average charging current is equal to the discharging current:
Hence the voltage drop is inverse proportional to CDUT capacitance:
It has to be noted that the pulsating discharge current causes periodic voltage variation on capacitance C. For optimal operation capacitance C must be significantly higher than CDUT, in order to minimize the voltage drop when the charge sharing happens between the two capacitors. Nevertheless it also limits the settling speed of the circuit, so it’s appropriate sizing is critical. In the current experiments the value of capacitor C was selected to be 10x CDUT, and an appropriately sized filter has been utilized to provide an acceptable noise level at the output. Finally the output signal Vout is proportional to the CDUT capacitance and to measure its temperature dependent value it is connected to one of the measurement channels of a thermal transient tester (T3Ster) equipment.
The circuit parameters can be adjusted to be used with various capacitor values. The actual measurement setup was optimized for capacitances in the 0.1 nF… 1 µF range. The oscillator frequency is freely adjustable in the 10 kHz..1 MHz range and the cut off frequency of the filter was selected to be 5 kHz hence the useful thermal transient should start after 1 ms.
The measurement circuit can be easily adjusted to smaller capacitances, but for higher capacitance values the switching frequency would be too low and the useful bandwidth of the transient signal would be insufficient. For higher capacitances a different measurement approach should be selected.
In this paper the measurement method is presented with three slightly different measurement arrangements, providing examples for transfer and self-resistance measurements, and demonstrating that the measurement of both the heating or cooling transient is possible.
The first measurement setup demonstrates the transfer Rth measurement. A 33 nF foil capacitor was selected as DUT that was fixed to a 5 W ceramic power resistor as a heat source. The measurement arrangement is shown in Figure 4. In this setup the transfer effect is expected to last long. In order to cancel the effect of the air movement the test structure was put in a still air chamber (a one square feet size standard measurement environment). 10mA current was applied on the capacitor and the switching frequency was adjusted to achieve about 1 V voltage drop at room temperature. At t=0 s 1.5 A heating current was applied on the resistor generating approximately 3 W of heat. In order to be able to calculate the thermal resistance of the structure the thermal transient curve needs to be captured from one steady state to another. In the current measurement setup 1800 seconds were required to achieve complete steady state after the heating switched on.
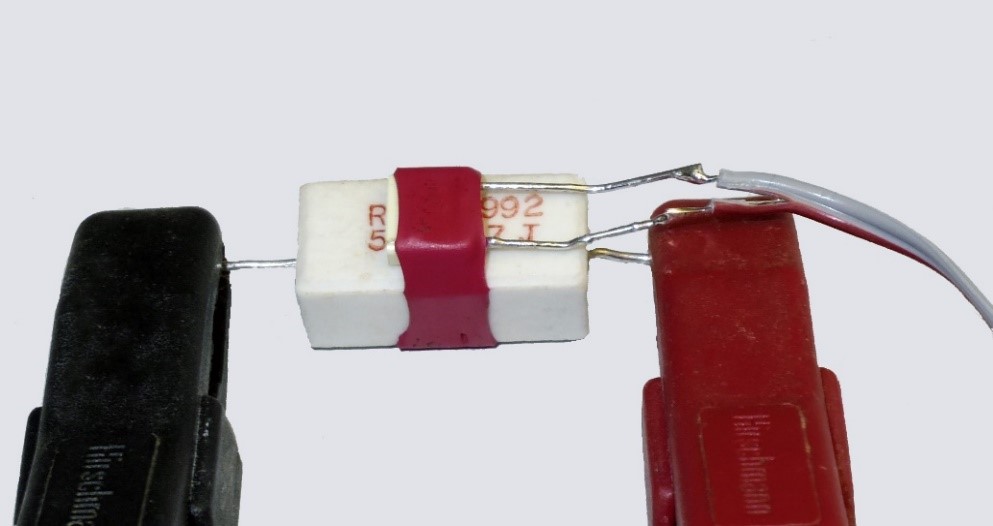 Figure 4 Transfer resistance measurement setup
For the second experiment a 100 nF ceramic capacitor was selected with X7R dielectric material. The leaded capacitor was soldered to a test PCB panel with different pin lengths and the effect of the pin length on the cooling transient was investigated. A photo of the measurement setups is shown in Figure 5. For the measurement similar sensing parameters were selected as for the foil capacitor: 10 mA sensing current was applied and the switching frequency was adjusted to obtain a voltage drop of about 1 V. In this case the device was heated up by applying a higher current across the switched capacitor. The higher average current caused a power loss on the ESR of the capacitor and hence heated it up. By applying 60 mA heating current the voltage increased significantly and the dissipation on the capacitor was about 0.5 W. The heating current was applied on the component for 100 seconds, then the heating was switched off and the transient measurement was immediately started and a 120 s cooling transient captured.
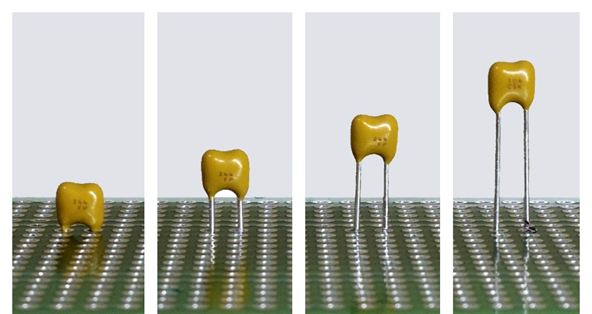 Figure 5 Thermal impedance measurement setups with different pin lengths
In the final experiment the same mechanical arrangement was used as shown in Figure 5, but only with the shortest and longest pin configuration. In this case the heating transient was captured instead of the cooling one. 70 mA heating current was selected and the switching frequency was adjusted to set the voltage drop to about 4 V. After switching on the heating a 200 s heating transient was captured. This time was sufficient for the structure to achieve steady state.
Before presenting the results of the experiments we show how the measured voltage values will be converted into temperature values.
3.1. Temperature sensitivity calibration
In order to transform the captured voltage transient into temperature transient the temperature sensitivity of the measured signal needs to be calibrated. The temperature sensitivity calibration was straightforward in case of the first two experimental setups. The transient change of the capacitances were captured in a low power state, when the applied dissipation was practically negligible; only about 10 mW. In this state the temperature difference between the core of the capacitor and its environment is negligible, hence in steady state we can assume that the core temperature equals to the environment temperature.
For the calibration the capacitors were placed in a climate chamber and the electrical parameters of the driving circuit were set exactly the same as during the measurement. The chamber temperature was adjusted between 15°C and 85°C in 10°C (5°C for the ceramic capacitor) steps, and the output signal was registered at each steps after both the temperature and the output signal have stabilized.
The resulting calibration curves are shown in Figure 6. The data points corresponding to the foil capacitor (red dots) fit well on a linear curve (red dashed line) with a slope of 2.16 mV/°C. The temperature dependence of the ceramic capacitor however shows significant nonlinearity. In the measured temperature range this temperature dependence could be fairly approximated with a fourth order polynomial, but this does not guarantee that outside of the characterized range it is still a valid approximation. It also has to be noted that the temperature dependence is monotonous in the measured range in both of the cases. The monotony of the calibration curve is a primary requirement to be able to use the curve for voltage-temperature transformation.
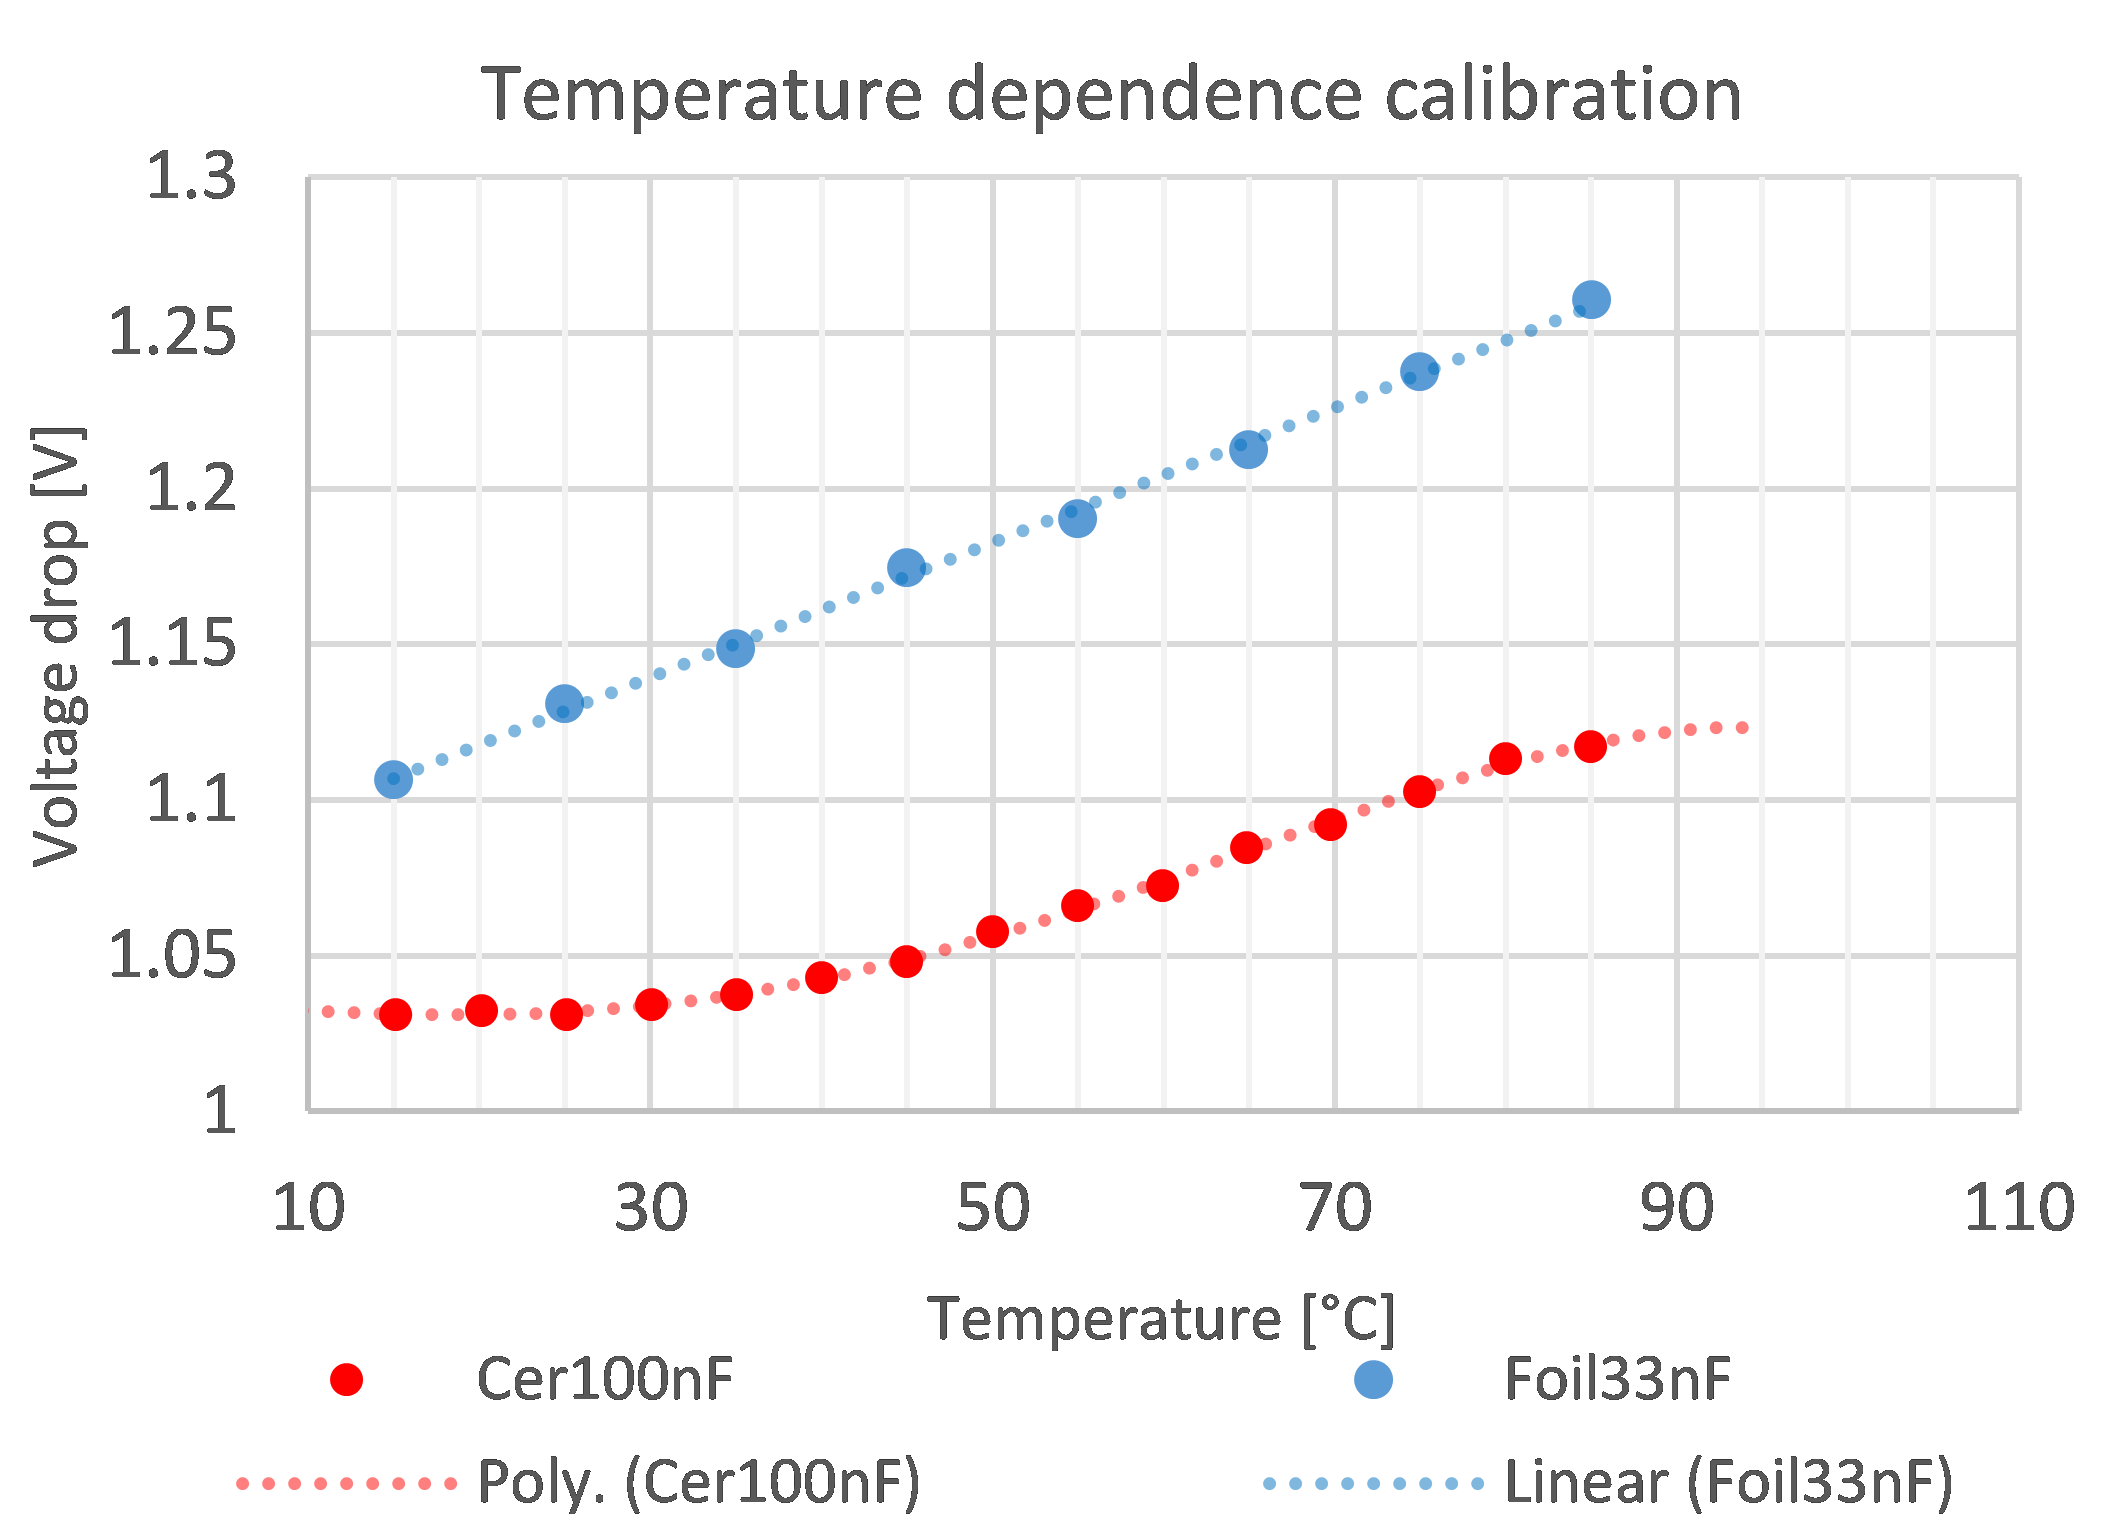 Figure 6 Temperature sensitivity calibration curves of the two capacitors at low power level
The TSP calibration for the third experiment is more challenging. In this case the heating transient of the component was captured, when the applied dissipation was high (0.28 W). Due to the significant junction to environment thermal resistance of the component there is a considerable temperature difference between the core temperature of the component and the regulated environmental temperature. In order to overcome this issue the device was also put in the environmental chamber, but now in unpowered state.
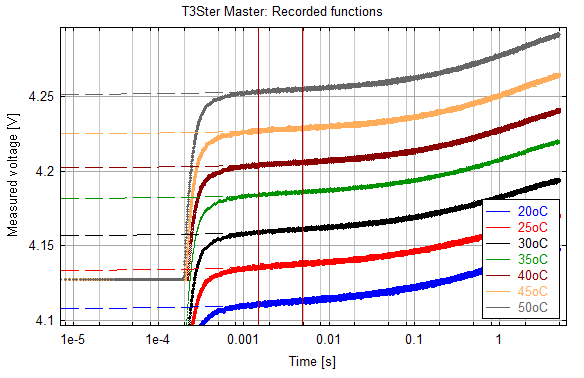 Figure 7 Measured short switch on transients of the ceramic capacitor at several environment temperatures
At each temperature level after the temperature has stabilized the powering of the capacitor was switched on and a short heating transient was captured. Just after switching on, the capacitor temperature is still equal to the chamber temperature, but immediately starts to increase. The captured transient responses are shown in Figure 7 at a few environment temperature levels. In the initial section an electric transient can be observed, which is not related to the component temperature, only caused by the change of the electrical operating conditions. After about 1 ms the signal value is proportional to the temperature. In order to approximate the voltage drop just after turning on the heating, a square root function was fitted on each transient responses between 1.5 ms and 5 ms. and the voltage extrapolated to t=0 s time. The square root fitting is a widely used initial electric transient compensation method in case of semiconductor devices, where the heat generation is localized to the surface of the semiconductor chip. In case of the capacitor component where the heat is mostly generated in the core volume the validity of this approximation is questionable, but it has only a minor effect on the final results.
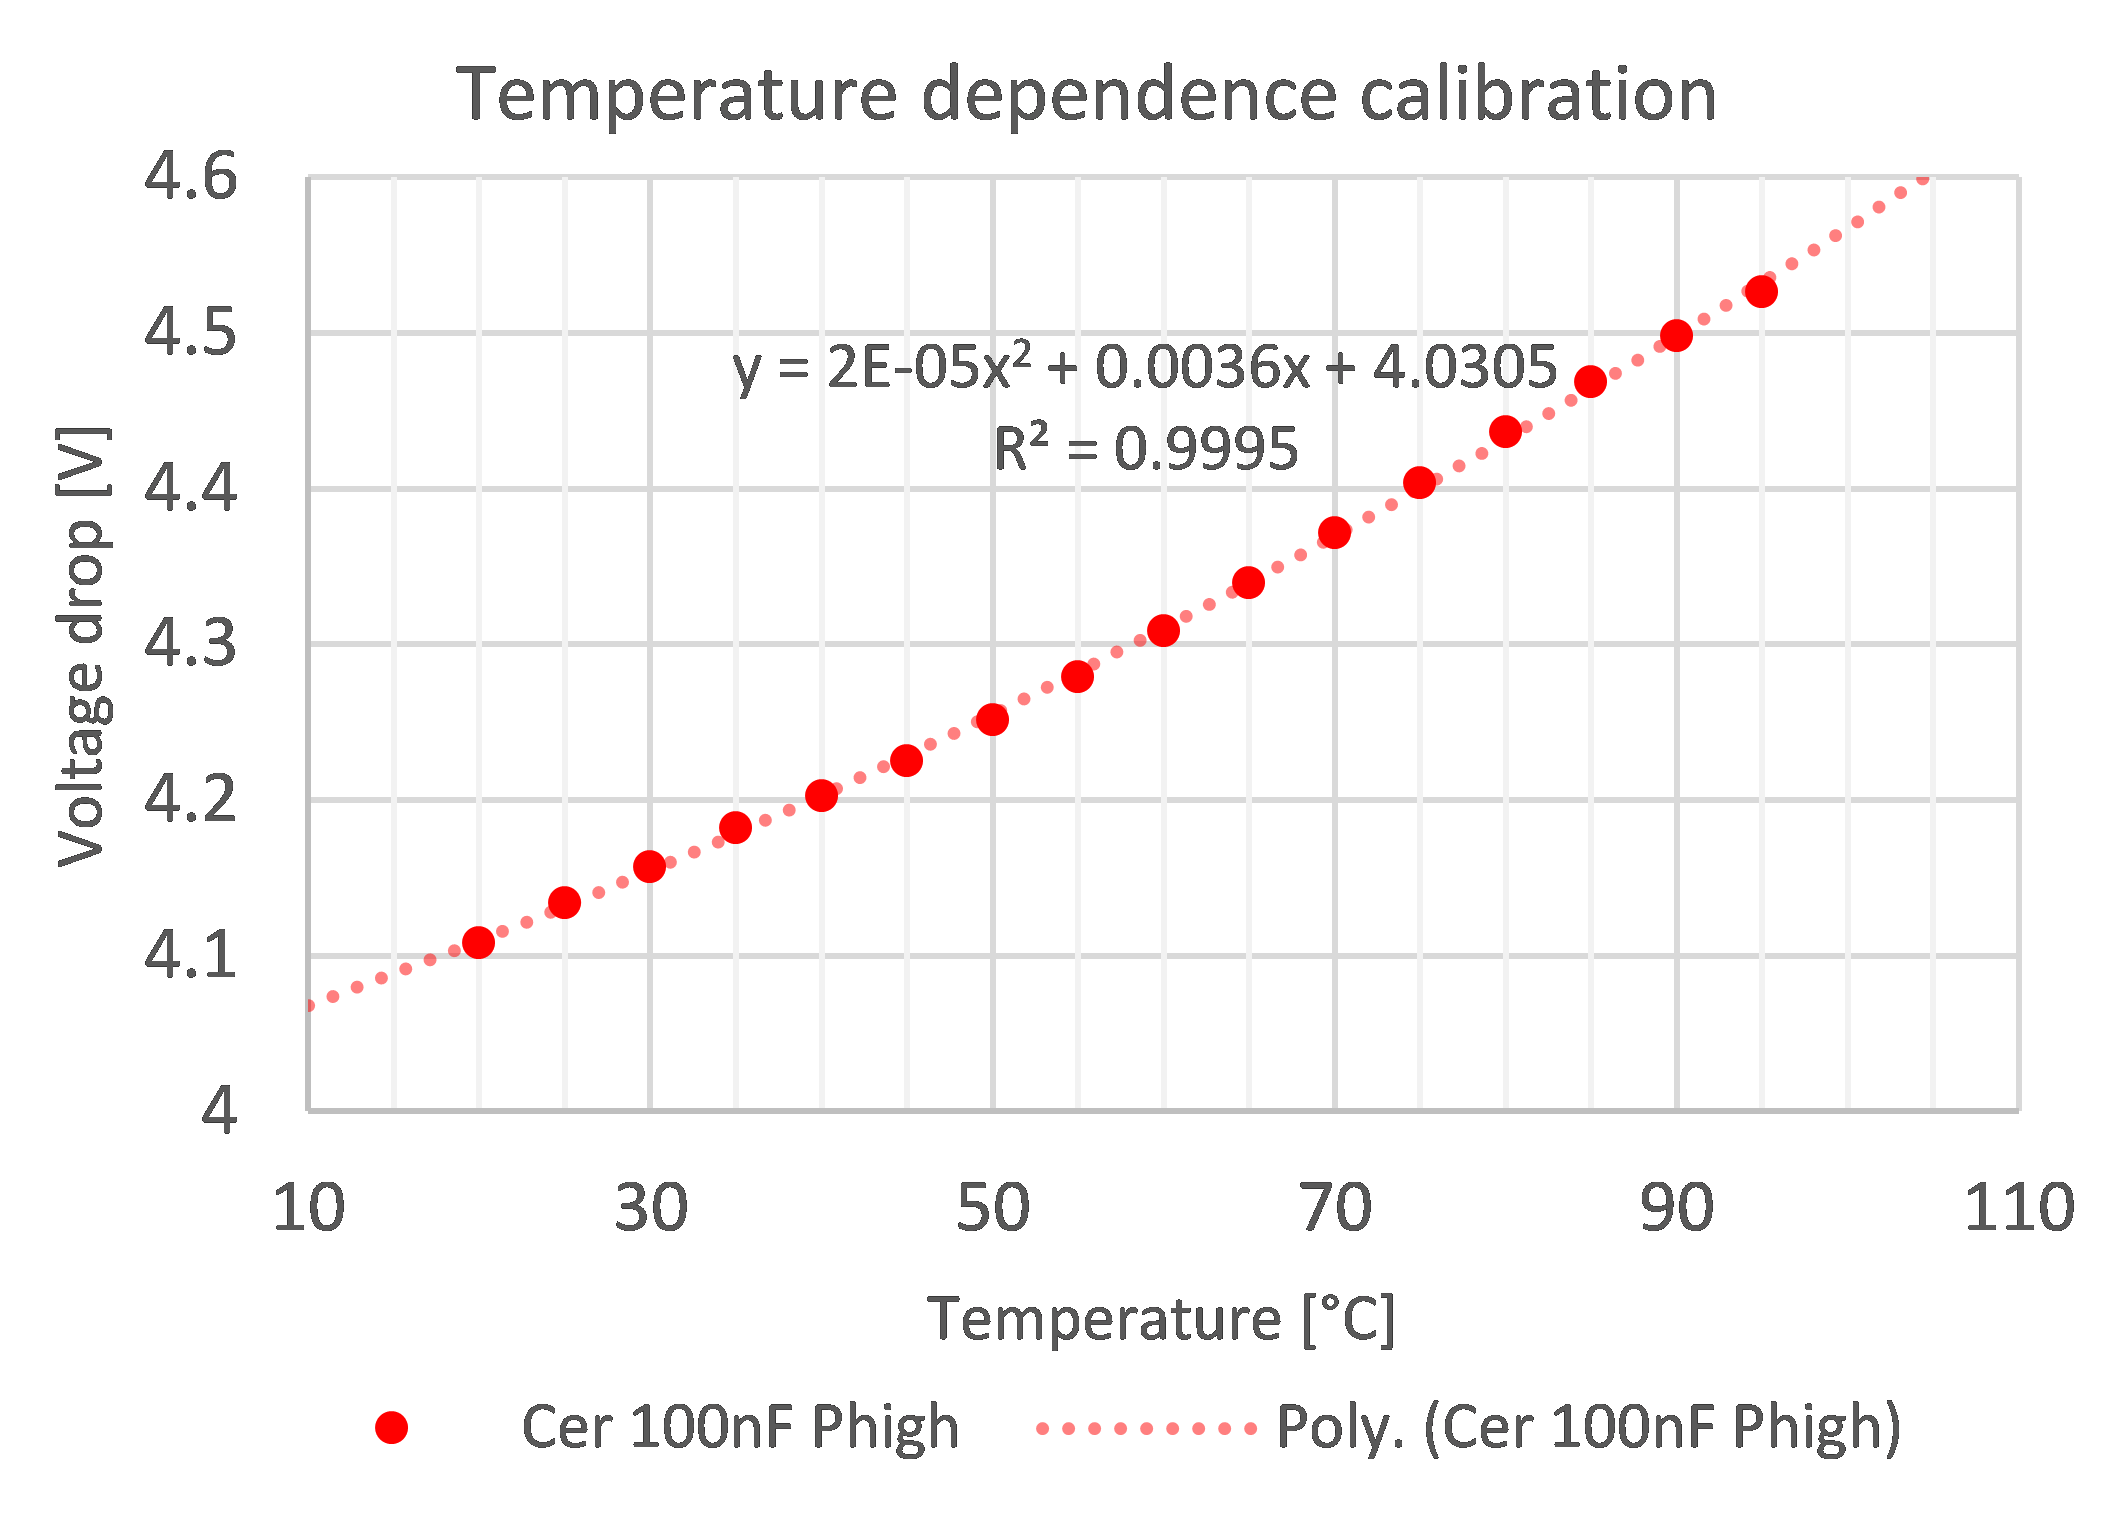 Figure 8 Temperature sensitivity calibration curve of the ceramic capacitor at high dissipation
The calibration was done between 20°C and 95°C in 5°C steps. The resulting calibration points are shown in Figure 8. The experienced nonlinearity was small, a second order curve fit well on the measured data points.
The overall time required for the thermal transient measurement of a single capacitor is mainly defined by the calibration time. The measurement time depends on the time constants of the test structure, but in case of good cooling it can be as low as a few tens of seconds. Meanwhile the calibration is a rather time consuming task as the environment temperature needs to be changed, waiting until the device temperature also stabilizes and then the corresponding voltage registered. This process often takes more than an hour for a single calibration. However, the calibration task can be done in parallel on high number of devices achieving a good overall throughput.
4. Measurement results
Another experiment is also presented in this paper in order to demonstrate the transfer resistance measurement, where the heating is coming from external heat source, and the capacitor core temperature is captured using the switched capacitor circuit. After the temperature sensitivity calibration the captured raw data could be transformed into temperature response as it is shown in Figure 9. Despite the switching mode operation of the circuit the noise level of the measured signal is reasonably good. The noise RMS (Root Mean Square) was about 0.2°C in all measurements.
As it is expected the initial section of the curve is completely flat, there is no temperature change measurable until 3 seconds. The heat generated by the resistor needs this time to propagate to the capacitor. As the thermal coupling in the experimental setup was much stronger than in normal applications, normally an even longer propagation time can be expected. Consequently if the goal is to measure only the transfer resistances the switching frequency can be significantly reduced to allow the measurement of much larger capacitance values, or the filter frequency can be reduced to achieve lower noise and more accurate temperature reading.
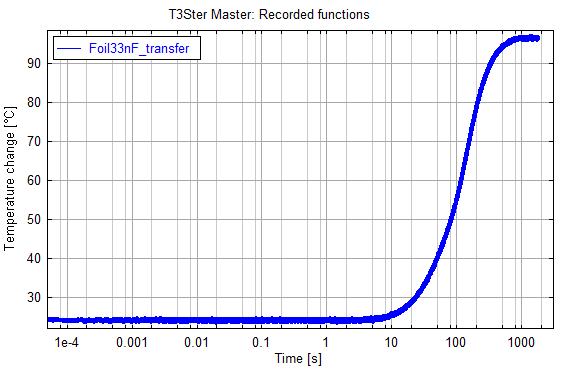 Figure 9 Temperature transient curve for transfer heating of the foil capacitor sample
The goal of the second experiment was to prove that the measured signal is in fact temperature transient and hence it is dependent on the thermal resistance of the structure. The different pin lengths were representing different thermal resistances between the capacitor and the hosting PCB. Figure 10 shows the measured temperature transient responses. It is clearly visible that the longer the pin was the higher temperature change was measured. This also proves that one of the main heat flow paths in such arrangements is the conduction through the pins to the PCB. It has to be noted that in case of the red curve the calculated temperature was above 90°C, which is beyond the calibration range. As a consequence the calculated temperature in this range is expected to be inaccurate.
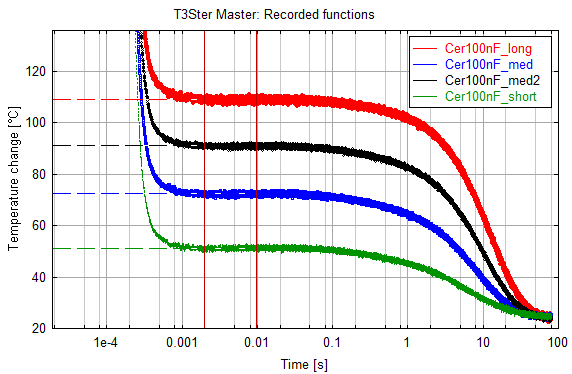 Figure 10 Cooling transient curves measured on the ceramic capacitor with different pin lengths
As opposed to the transfer heating measurement the temperature change starts much earlier in case of self-heating. The end of the electric transient is about 1 ms, and the valuable thermal signal starts soon after it. This shows that if the heated and measured points overlap, then the response speed of the measurement circuit becomes more important. How much information we lose that depends only on the internal thermal resistance and capacitance of the capacitor structure.
In order to obtain a more accurate thermal transient curve, good enough for further post-processing the parameters of the measurement setup were further optimized in the third experiment. We found that instead of the cooling curve that is most commonly used in case of testing semiconductor components, the heating curve provides a better signal. The temperature sensitivity is higher with lower nonlinearities, ensuring better signal to noise ratio.
The captured heating curves for the short and long pin scenarios are shown in Figure 11. It can be observed that the initial section of the two curves overlap perfectly, and split up only after about 2 seconds. In the initial section the heat experiences the same physical structure. The difference appears when the heat arrives to the PCB in case of the short pin arrangement but it needs to pass through longer pins representing higher thermal resistance when the pin is long.
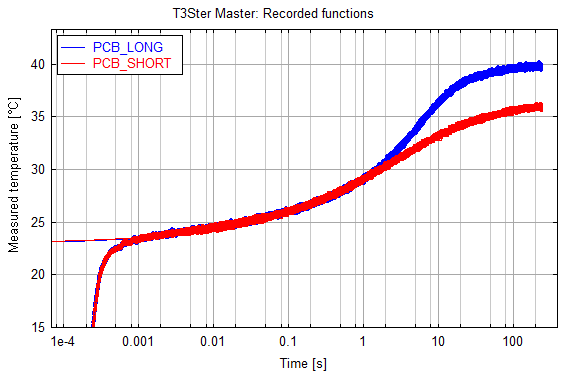 Figure 11 Measured heating transient curves of the ceramic capacitor with long and short legs
With the evaluation of the thermal transient measurements a one dimensional Cauer RC model can be constructed that in case of semiconductor components not only provide a good behavioral model, but structural information can also be extracted from it [8]. The structure function [10] is a graphical representation of the identified equivalent Cauer RC network. It plots the sum of the thermal capacitances in the function of the sum of the thermal resistances from the source of the heat towards the ambient, in cases of one dimensional heat flow that is a very good approximation in most of the practical cases. The resulting curve helps in interpreting the larger data sets. The steep sections in the structure function represent a physical layer with high added thermal capacitance but low thermal resistance that corresponds to a good thermal conductor material. On the other hand the flat sections of the curve represent high resistance with low added capacitance, hence a thermal insulator. In case of real one dimensional heat flow path the subsequent layers can be identified based on the corresponding slope on the curve and hence the structure can be analyzed.
4.1. Verification with simulation
The thermal transient measurement of the capacitor provided realistic transient curves, and the effect of the change of pin length could also be clearly identified. However the validity of the curve still needs to be proven. We decided to build up the detailed 3D model of the capacitor and compare the simulated and the measured thermal transient responses.
As we did not have detailed structural information from the manufacturer we cross sectioned the capacitor to identify the important features and measure their sizes. A cross section picture of the capacitor and the built simulation model can be seen in Figure 12.
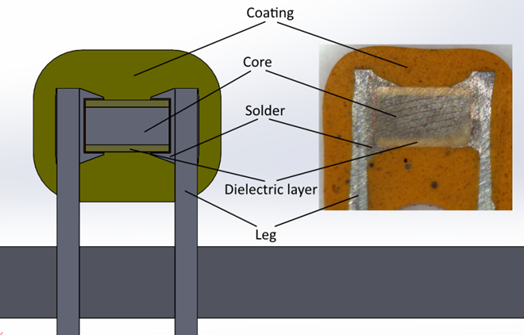 Figure 12 Simulation model of the measured ceramic capacitor
The most important structural elements are the capacitor core, where the electrodes and the X7R dielectric material are providing the layered structure, a dielectric cover layer, where no electrodes are visible, the solder, the copper legs and the coating ceramics.
According to the information found in the literature [4] the BaTiO3 is a commonly used ceramics to create X7R grade ceramic capacitors. As a base approximation we supposed that this material was used as dielectric layer and used the material properties suggested by the referenced paper. In order to simplify the simulation model the layered core has not been modeled in detail, but the weighted average thermal parameters of the BaTiO3 and the chromium electrodes have been used. As the layer thicknesses were unknown we used an arbitrary 8:2 volume ratio as the first approximation. The coating material was also unknown; hence as a first approximation we used the same thermal parameters as for the dielectric material. The solder was assumed to be SAC (Tin-silver-copper) solder. The initial guess material parameters can be read in Table 1.
Table 1. Material parameters, initial guess
| Component | Material | λ [W/mK] |
Cp [J/kg K] |
ρ [g/cm3] |
| core | custom | 20.5 | 412 | 6.16 |
| Dielectric | BaTiO3 | 2.7 | 400 | 5.9 |
| Coating | custom | 2.7 | 400 | 5.9 |
| Solder | SAC | 78.4 | 306 | 7.4 |
| Leg | Al | 230 | 1037 | 2.69 |
| PCB | FR4 | 0.3 | 880 | 1.2 |
The transient response of the structure was simulated with time steps identical to the sampling rate of the measurement. The time domain curve of the transient response provides much less information than its transformed version the structure function. The simulated and measured curves can be better compared using the structure function as it is shown in Figure 13.
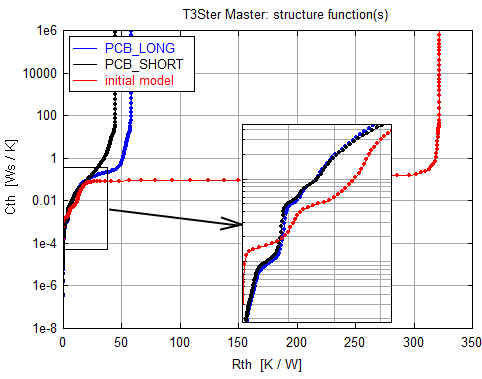 Figure 13 Structure function generated from the simulated transient of the initial “best guess” model compared with the measured curves
The black and blue color curves were generated from the measured transients with short and long pin lengths and the red curve was generated from the simulated transient. At the large scale plot the initial section of all the curves seem very similar, but after the initial section a large excess resistance can be observed in the simulation model. If we take a closer look at the initial part of the curves it becomes apparent that while the two measured curves are identical despite the differences in the pin length the simulated structure functions already show slight differences. In order to understand the differences between the simulation model and the modeled component the structure function has to be analyzed.
4.2. Using the structure function to fine-tune the simulation model
For semiconductor packages a detailed thermal model can be step by step calibrated based on the measured transient curve starting from the chip and moving towards the more remote features [11]. This can be done because there is typically a dominant heat flow path that can be well described with the one dimensional spreading model and the time constants corresponding to the different elements of the heat flow path are increasing gradually as we are receding from the junction. However in case of the capacitor component the one dimensional spreading from the core is not a good assumption. As an example from the core of the capacitor the heat also spreads towards the pins through the solder contact, and the coating. In such situations what we see in the structure function is the parallel sum of the two thermal resistances (and capacitances).
As a result the same section of the structure function can be affected by more than one model parameters. As it is shown in Figure 14 the conductivity of the core material (green and blue curve) and the surrounding dielectric layer (red and orange) are also affecting the length of the first flat section of the curve. Other sections are more dependent on one single material parameter and can be more clearly identified on the structure function.
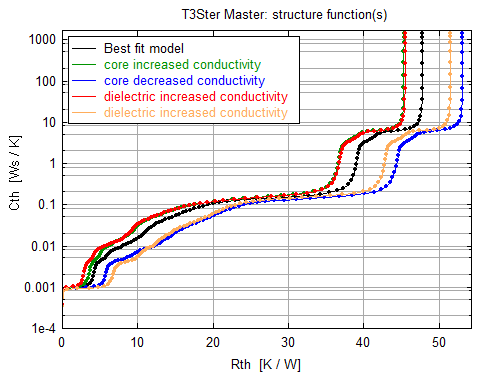 Figure 14 Effect on the structure function of the increased and decreased conductivity of the core (green and blue) and the dielectric layer (red and orange)
The large resistance at the end of the structure function corresponding to the initial model (Figure 13) was caused by the low conductivity of the PCB by neglecting the effect of the copper traces. Figure 15 shows a simplified summary about which sections of the structure function are affected by the various model parameters.
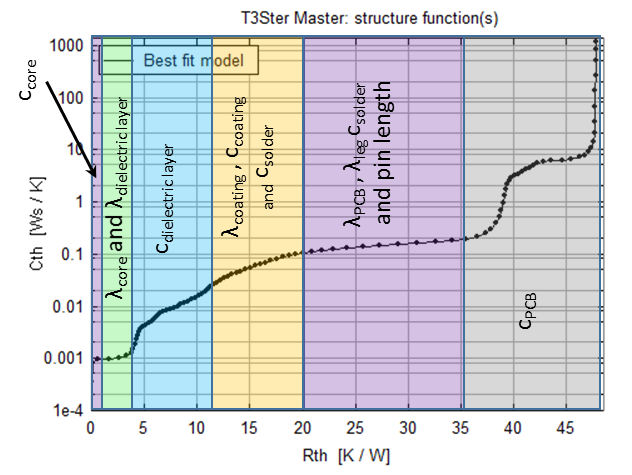 Figure 15 Different areas of the structure function and the various simulation model parameters affecting their shape
Having this information we know which parameters to adjust in order to have the simulated transient fit the measured one. After iterative adjustment of the appropriate thermal parameters of the PCB, capacitor core material, dielectric material, and coating material a very good match between the simulated and the measured transients could be achieved in the important domain up to about 35 K/W. Above this thermal resistance the thermal response is no more dependent of the thermal parameters of the capacitor model, hence it was out of our scope. With further work the whole simulation model could be matched to the experimental results.
Figure 16 shows the structure function of the measured transients and the one simulated after the model calibration, demonstrating very good agreement. The final model parameters are listed in Table 2. Almost perfect match can be achieved until 35 K/W.
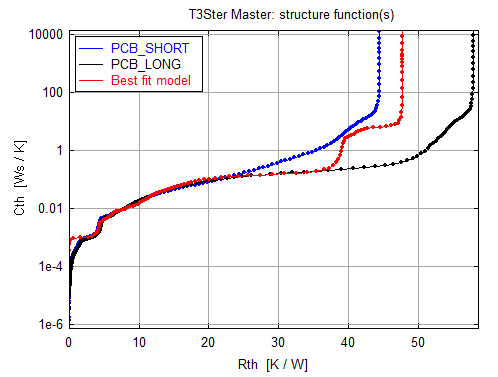 Figure 16 Structure function corresponding to the simulated (red) and measured structure (blue and black) after the calibration
Table 2. Material parameters after calibration
| Component | Material | λ [W/mK] |
Cp [J/kg K] |
ρ [g/cm3] |
| core | custom | 25 | 300 | 5 |
| Dielectric | BaTiO3 | 2.6 | 1000 | 5.9 |
| Coating | custom | 3 | 500 | 6 |
| Solder | Custom | 78 | 2500* | 7.4 |
| Leg | Cu | 380 | 416 | 8.96 |
| PCB | Custom | 30 | 880 | 4 |
*The specific heat of the solder was increased to unrealistic levels to avoid geometrical changes (the volume in the model was lower than in the actual capacitor)
Nevertheless a small difference still remains after the calibration in the very early section of the structure function, below 2.5 K/W, where the simulation result and the measured transient do not match. In this section the structure function could not be affected by the adjustment of the model parameters. The simulated structure function shows stepwise capacitance change at practically 0 K/W, as the heat generation was assumed to be evenly distributed in the core of the capacitor. But the lower slope section of the structure function corresponding to the measured transient denotes that the heat generation is more localized to a smaller volume and the heat has to spread in the core to fill its volume.
5. Conclusions
In this paper a new measurement setup for the thermal characterization of capacitors was proposed. This method adopts the thermal transient measurement technology that is widely used for the characterization of semiconductor packages and structures.
The measurement method uses no external temperature sensors, but utilizes a temperature dependent electric parameter of the measured component itself to measure its temperature. The various temperature dependent parameters were reviewed and the capacitance was selected as it shows significant temperature dependence in case of most capacitor constructions.
In order to measure the change of the capacitance with sufficiently high temporal resolution a switched capacitor based measurement solution is proposed. The presented measurement circuit can be adjusted to measure capacitances in a wide range with approximately 1 kHz bandwidth.
The measurement method was demonstrated with three measurement setups. The first setup demonstrated the transfer Rth measurement, capturing the heating curve of the capacitor after a closely attached heat source turned on. It is shown that due to the long time required for the heat to reach the capacitor even a strong thermal coupling enables us to significantly reduce the switching speed of the switched capacitor and hence measure significantly higher capacitances.
The second setup demonstrated the self-resistance measurement, heating up the capacitor by its own losses at high ripple current and then measuring the cooling transient. The measurement was repeated with different pin lengths and the effect of the pin length on the thermal resistance of the component could be identified.
In this third setup also the self-resistance was measured, but capturing the heating curve of the capacitor. This setup provided better signal to noise ratio than the cooling measurement.
The detailed 3D simulation model of the capacitor and the PCB to which it was soldered to were built and the heating transient was measured and simulated. The first simulation and measurement results showed acceptable match in the initial section of the transient and the generated structure functions, but further from the heat source the difference was large.
By comparing the structure functions generated from the measured transient and the simulated one, the inaccurate model parameters could be iteratively fine-tuned to achieve an almost perfect match between the measured and simulated structure functions. This demonstrates that the thermal transient measurement can not only be used to measure the thermal resistance of the component, but also helps in calibrating the simulation model.
Conflict of Interest
The authors declare no conflict of interest.
- Sam G. Parler Jr, “Thermal modeling of aluminum electrolytic capacitor”, IAS Annual Meeting (IEEE Industry Applications Society) 4:2418 – 2429 vol.4 · February 1999 DOI: 10.1109/IAS.1999.799180
- Schaubauer, F. M.; Blumkin R.; “Thermal Resistance, Power Dissipation and Current Rating for Ceramic and Porcelain Multilayer Capacitors”; Reprinted from RF Design Magazine, 1981
- Parler, S. G. Jr.; Macomber, L. L.; “Predicting Operating Temperature and Expected Lifetime of Aluminum-Electrolytic BusCapacitors with Thermal Modeling”, PCIM November, 1999
- P. Guillemet, C. Pascot and Y. Scudeller, “Electro-thermal analysis of Electric Double-Layer-Capacitors,” 2008 14th International Workshop on Thermal Inveatigation of ICs and Systems, Rome, 2008, pp. 224-228.doi: 10.1109/THERMINIC.2008.4669913
- Huesgen, T., “Thermal resistance of snap-in type aluminum electrolytic capacitor attached to heat sink,” Energy Conversion Congress and Exposition (ECCE), 2012 IEEE, vol., no., pp.1338,1345, 15-20 Sept. 2012, doi: 10.1109/ECCE.2012.6342661
- Z. Sarkany and M. Rencz, “A way for measuring the temperature transients of capacitors,” 2016 IEEE 18th Electronics Packaging Technology Conference (EPTC), Singapore, 2016, pp. 818-822.doi: 10.1109/EPTC.2016.7861594
- Szekely, V.; Torok, S.; Nikodemusz, E.; Farkas, G.; Rencz, M., “Measurement and evaluation of thermal transients,” Instrumentation and Measurement Technology Conference, 2001. IMTC 2001. Proceedings of the 18th IEEE , vol.1, no., pp.210,215 vol.1, 21-23 May 2001
- V.Székely: “A new evaluation method of thermal transient measurement results”, Microelectronics Journal, V.28, No.3, pp.277-292 (1997)
- Zongli Dou; Rong Xu; Alfonso Berduque; “The Development of Electrolytes in Aluminum Electrolytic Capacitors for Automotive and High Temperature Applications” ;CARTS Europe 2008 Conference Proceedings; Helsinki, Finland, 20-23 Oct. 2008
- M. Rencz, V. Szekely, A. Morelli and C. Villa, “Determining partial thermal resistances with transient measurements, and using the method to detect die attach discontinuities,” Eighteenth Annual IEEE Semiconductor Thermal Measurement and Management Symposium. Proceedings 2002 (Cat.No.02CH37311), San Jose, CA, USA, 2002, pp. 15-20. doi: 10.1109/STHERM.2002.991340
- A. Vass-Varnai, R. Bornoff, Z. Sarkany, S. Ress and M. Rencz, “Measurement based compact thermal model creation – accurate approach to neglect inaccurate TIM conductivity data,” Electronics Packaging Technology Conference (EPTC), 2011 IEEE 13th, Singapore, 2011, pp. 67-72. doi: 10.1109/EPTC.2011.6184388