A Category Based Threat Evaluation Model Using Platform Kinematics Data
A Category Based Threat Evaluation Model Using Platform Kinematics Data
Volume 2, Issue 3, Page No 1330-1341, 2017
Author’s Name: Mustafa Çöçellia), Ethem Arkın
View Affiliations
Aselsan A., Defense Systems Technologies, 06172, TURKEY
a)Author to whom correspondence should be addressed. E-mail: mcocel@aselsan.com.tr
Adv. Sci. Technol. Eng. Syst. J. 2(3), 1330-1341 (2017); ![]() DOI: 10.25046/aj0203168
DOI: 10.25046/aj0203168
Keywords: Threat Evaluation, Decision-Making, Situational Awareness, Information Fusion, Command and Control (C2)

Export Citations
Command and control (C2) systems direct operators to make accurate decisions in the stressful atmosphere of the battlefield at the earliest. There are powerful tools that fuse various instant piece of information and brings summary of those in front of operators. Threat evaluation is one of the important fusion method that provides these assistance to military people. However, C2 systems could be deprived of valuable data source due to the absence of capable equipment. This situation has a bad unfavorable influence on the quality of tactical picture in front of C2 operators. In this paper, we study on the threat evaluation model that take into account these deficiencies. Our method extracts threat level of various targets mostly from their kinematics in two dimensional space. In the meantime, classification of entities around battlefield is unavailable. Only, category of targets are determined as a result of sensors process, which is the information of whether entities belong to air or surface environment. Hereby, threat evaluation model is consist of three fundamental steps that runs on entities belongs to different environment separately: the extraction of threat assessment cues, threat selection based on Bayesian Inference and the calculation of threat assessment rating. We have evaluated performance of proposed model by simulating a set of synthetic scenarios.
Received: 01 May 2017, Accepted: 24 June 2017, Published Online: 01 August 2017
1. Introduction
This paper is an extension of the study that originally presented in 2016 IEEE Symposium Series on Computational Intelligence (SSCI) [1]. The original work focuses on a threat evaluation model that prioritizes entities without any characteristics at all in tactical picture. It accepts all targets without any differentiation and applies same threat evaluation model even if they have great difference because their dynamics. In this work, we separate targets from each other according to their category and apply appropriate methods to each categories independently.
Military operations take place in a stressful environment with a large amount of changing data. This atmosphere could drag C2 operators to erroneous decisions easily and leave them with their biases alone. Therefore, the aid of computer power is indispensable along OODA (Observe-Orient-Decide-Act) in battlefield [2]. The level of assistance changes according to capabilities of equipment deployed on the naval platform. Decision support systems serve operators the compiled tactical picture the combat field by processing raw sensor detections. Operators try to make their best while evaluating identity and kinematics of entities together before reaching final decisions. However, it is very difficult to establish relation between various data and extract value from instant data at a limited time without any automatic assistance tool [3]. Due to uncertain risks of battlefield, operators need to recognize, identify and prioritize surrounding objects continuously without any interruption [4]. The decision cycle of C2 operators are modeled and simulated in lots of studies in order to build up decision support systems [5, 6]. It shows that these systems are one of the core elements in C2 operations.
Situational awareness phase completes the observation step of the C2 processes by working on sensor data. This phase generates necessary tactical information used by orientation step of the C2 processes [7]. At this point, threat evaluation is defined as the analysis of surrounding objects continuously in order to detect their intents against defended assets and rank these objects according to their threat level. After the reveal of intents of these suspected objects, action sequence is determined to neutralize danger on friendly forces [8]. In the meanwhile, threat evaluation methods gain importance to accelerate decision cycle of C2 operators by decreasing time needed between operator perception and reaction time in the tactical area.
Various methods, such as, rule based techniques, fuzzy logic based techniques, neural networks and graphical models, are used in the threat evaluation algorithms to measure the threat level of assets surrounding defended forces [9]. Threat assessment cues are fundamental input data of these threat evaluation methods. As a result of various long-term studies that benefiting from experiences of qualified military personal, the most effective threat assessment cues are determined. Hereby, the environment of the target has a major influence on threat assessment cues. Kinematics of entities changes depending on where they operates. While air objects are able to make fast and sharp moves, surface objects on sea does not have the rapidity belonging to air objects. Similarly, different characteristics of target arising from environment lead to different threat assessment cues. Therefore, the list of threat assessment cues differs according to target’s environmental category. The complete list of cues used for air forces is airlane, altitude, coordinated activity, course heading, closest point of approach (CPA), ESM/Radar Electronic Support, feet wet/dry, IFF mode, maneuvers, origin/location, own support, range/distance, speed, visibility, weapon envelope, wings clean/dirty in the study of Liebhaber and Feher [10]. Same researchers defines the list of threat assessment cues for surface forces as follows: cargo, coordinated activity, destination, ESM, heading, number of vessels, own support, range/distance, recent history, regional intelligence, sea lane, speed, voice communication with track and weapon envelope [11]. While important portion of lists are common, there are some significant difference between lists.
Johansson’s study approaches threat assessment cues with a different perspective and categorize them as capability, proximity and intent parameters [9]. Mostly, classification of entities forms the list of capability parameters. Those parameters measures the possible deadliness of suspected object against friendly object. Meanwhile, the concern of proximity parameters is the closeness of objects in regards of position and orientation with respect to each other. Finally, intent parameters are interested with the actual aim of the suspected object on friendly asset [9].
Threat evaluation cues are originated from the characteristic of the target, the kinematic data of the target itself and the kinematic relationship of the target and the defended asset. These cues are classified in this regard. The kinematic relationship of objects find place in proximity and intent parameters itself. Classifying and identifying suspected object feeds capability parameters among cues. Small-scale naval platform has a limited foresight about the classification of target due to the lack of technologies, such as IFF and ESM, providing more modal information about the suspected target. In this paper, we examine the naval system that supply whether the target is an air track or a surface track. Moreover, the system provides kinematics of surrounding objects in two dimensional space. We present a threat evaluation model that initially generating scores for each threat assessment cues from kinematics of objects, then performing threat selection by using scores generated from initial phase and finally calculating threat assessment rating by using again cue scores. Data fusion is progressed at different paths for each environmental category. While air objects are evaluated in air container, surface objects are interpreted in surface container. Each category follows same threat evaluation model with different threat assessment parameters that convenient to use in that category.
The remaining part of this paper is organized as follows: Firstly, section II gives information about challenges while designing such a fusion based system. After that, section III presents the reason of why this threat evaluation model needed and the definition of the threat evaluation problem in literature. Then, section IV introduces whole steps of the threat evaluation model in detail. Section V presents the measurement of the performance of the mentioned model by evaluating couple of synthetic scenarios. Section VI gives the brief information about other researches for the threat evaluation problem. Lastly, section VII states the summary of this paper. Significant comparison is performed with this work and original work in discussions at the section VII. Further potential work after this study to complete research will be discussed in the end.
2. Challenges
Fusion problem is a challenging issue in itself apart from threat evaluation problem. Real world is measured by sensors and turns into signals. Then, these information is translated to discrete values to make mathematical calculations possible. There are many questions rising about the registration of data before beginning of the fusion process. In low-level information fusion processing, sensor’s detections are associated and concluded as estimated tracks and target identities. After this step, high-level information fusion processing is initiated in order to detect repetitive behaviors, association of entities, prediction of future behavior and classification of situation [12].
Threat evaluation problem is generally related with high-level fusion processing since the problems tries to define tactical situation more clearly. Therefore, challenges for HLIF processing is addressed difficulties for threat evaluation problem, also. From the Fusion08 Panel discussion, these challenges are listed as proper fusion process models, estimation-based capabilities for HLIF relations, formal models for HLIF and use of other domains to contribute fusion solutions [13].
Threat evaluation problem can be assessed within situation assessment process widely discussed by fusion community. Explanation of the process, graphical displays to reveal internal process and interactive control to correct resulting situation are listed as common challenges in situation assessment [13]. C2 operator could be aware of the internal process and interact with system by the aid of graphical interfaces. However, the information displayed and the way of interaction is not fully described and resolved in the threat evaluation problem. There is a guide and studies for the design of graphical interfaces [3, 10]. However, it would be assertive to evaluate this design as a remedy to all needs.
There are various challenges that the community faced with while studying on situation and threat assessment. In general, following challenges are highlighted as a result of heavy discussions performed in the fusion community: situation and environment modeling, representation of knowledge, system design approaches, decision support process and performance and effectiveness evaluation methods for implemented systems. These challenges describes the problems while designing systems that needs fusion study in it.
3. Motivation
There is no complete definition and solution for threat evaluation problem since C2 operator behaviors and evaluations could not be guessed easily during ongoing military operation [14]. Since the fusion of large amount of instant information on combat field is still needed excessively, the problem is still debatable topic and new approaches are introduced to handle situation continuously [15]. The problem is getting more compulsive in the situation of naval platforms deprived of obtaining adequate information to process. The lack of important detection systems, such as 3D radar, ESM, IFF, lead to less reliable estimation results in threat evaluation problem. In this study, we study on similar case and propose an approach to meet the need of C2 systems that have limited capability.
Any content word related with threat evaluation process is named parameter, factor, characteristic or specifically cue [14, 16]. Fundamental input of threat evaluation process is threat assessment cues. These parameters are determined in different researches. US Navy uses Origin, IFF Mode, Intelligence Report, Altitude, Proximity to an Airlane and ESM parameters as most effective threat assessment cues in their air defense system. Moreover, U.S Navy officers within a Combat Information Center rank the importance threat assessment cues for the surface warfare in another Liebhaber’s study. While platform, weapon envelope, ESM, origin-flag parameters dominates the top of the list, range, heading, CPA/Speed cues follows these capability parameters [11]. As a result, the identity and the classification of the platform has a major influence on determining threat level of surrounding objects according to experienced users. Unfortunately, naval vessels with limited detection systems has no chance to use those parameters directly in their defense systems if there will be no operator intervention to the system. Therefore, these platforms need effective threat evaluation process that benefits from kinematics of objects. In this study, we focus on the use of parameters related with kinematics. Only available information in our case is whether the entity is an air object or surface object. Since dynamics of air and surface entities are different from each other, they are evaluated separately. Method section presents how this evaluation differentiate two distinct environment from each other.
The formal definition of the threat evaluation problem is described as follows: While represents targets and is the symbolic definition of friendly assets that need protection. Vij is the relation function between target and defended asset. Moreover, Vij represents the threat assessment rating of target-defended asset pair (Ti, Aj), where Ti ∈ T, Aj ∈ A. The normalization is applied to Vij and it takes values between 0 and 1 in the end. Predictably, while 0 stands for safe force, 1 defines dangerous one. The functions describing the relation between these assets is defined as follows [17]:
f : T x A à [0,1] (1)
In threat evaluation function, each friendly assets establish relationship with each suspected assets separately. When the identification of surrounding object is not possible, own platform is left as only friendly asset. If the function take into account only the platform itself and ignore all other friendly asset, then (1) changes as follows:
f : T x A1 = V à [0,1] (2)
In (2), symbolizes threat assessment rating of each target with respect to A1 which stands for our own platform. Similarly, the main purpose of this paper is to evaluate threat level of targets as function does. Our method will be introduces in following section of this paper in detail.
4. Method
It is compelling duty to separate friendly assets from hazardous ones when there is no identification information about surrounding asset. Kinematics of objects indicates limited foresight about the intent of objects. By fusing information extracted from objects’ movement and orientation, it is possible to strength this foresight. Data fusion operation need attention while evaluating kinematics objects, because entities belongs to different environment has dissimilar features and it is impossible to evaluate air and surface objects with same perspective.
- Threat Evaluation Model
The flow of each categories for threat evaluation process differentiate from the beginning of the model. The information about the environment of track is available. If track is a surface, then it is directed to flow handling surface tracks. Similarly air tracks are taken care of by air flow. Inside of each flow, steps are very similar to each other. Mainly, there is a three phase method inside each flow. Firstly, threat assessment cues phase generates various scores by benefiting from kinematics of objects. Then, these scores are transferred to threat selection phase that determined whether the entity show friendly or unfriendly attitude. This step marks the unfriendly objects as threat. Then, scores generated from first phase also transferred to final phase that calculates threat assessment rating of each object. This final phase provides to ranking of surrounding object depending on their threat level.
The Mentality of flows for each category is very similar as mentioned. Difference between each flow is to use convenient threat assessment cue in the right category.
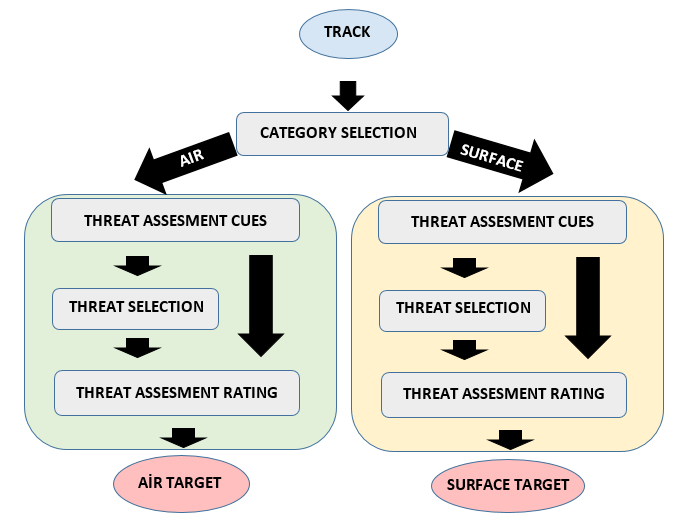 Figure1 summarizes the general situation of threat evaluation model in this paper.
Potential objects move to the related container depending on their environmental information. In each container, firstly, flow related threat assessment cues scores are generated from kinematics of objects. Then, threat selection phase determines dangerous objects by benefiting from these scores according to Bayesian Inference based algorithm. Dangerous objects are marked as threat at this phase for the use of the operator. Finally, threat assessment rating phase calculates the threat rating of each track by using category related cue scores.
In brief, the model accepts potential objects as input and produces two different target list for each category. Surface objects are ranked among themselves. Similarly, air objects are listed on their own list. Objects carries threat rating and target mark with themselves.
4.1. Category Selection
At the beginning of the model, tracks are directed to different models according to their categories. If track is air track, then the remaining model specializes to air object; otherwise, surface dynamics are taking into account in the remaining model. Steps performed after this selection is differentiated from each other. This step is source of main difference with original work. Category selection could be seemed a very simple step. In fact, its effect spread out the remaining model in deep.
4.2. Threat Assessment Cues
It is important to use accurate threat assessment cues that generate convenient relationship between friendly assets and dangerous ones in right place while estimating threat level of an object [18]. In lots of studies, many threat assessment cues have been suggested for the use of threat evaluation models. However, it is impossible to benefit from all parameters since sensors of the naval platform could not provide all necessary information. Therefore, threat evaluation model is restricted to present parameters. Kinematic of objects serves position, speed and course values as input to the model in order to generate threat assessment scores.
Table I: Threat assessment cues with respect to environment
| Air Tracks | Surface Tracks |
|
· Speed · Distance · Heading · Maneuver · Closest Point of Approach (CPA) · Time Before Hit (TBH) |
· Speed · Deceleration · Distance · Heading · Closest Point of Approach (CPA) · Time Before Hit (TBH) |
Table 1 gives the full list of threat assessment cues that is generated from only kinematics objects which is basically position, speed and course of objects. Parameter lists are very similar to each other with a few difference. The way of generating scores does not change in each environment flow. However, weights of these parameters in algorithm changes according to category of asset. While determining parameters itself and weights of them, we benefit from mostly air warfare and surface warfare studies separately [9-11]. After the performance evaluation of the algorithms, weights of the parameters adjusted according to observation made during trials. Details of each parameters, namely speed, deceleration, distance, heading, maneuver, CPA and TBH are given as follows:
1) Speed: Speed parameter has a potential to be used to reveal classification of targets. An ordinary single engine aircraft could not reach the speed of fighter which is much more dangerous. However, a fighter could travel at lower speed. Similarly, for a surface track, fish boat can reach limited speed while boats are able to travel at higher speed. However, assault boat can stop in the middle of ocean and hide its characteristics easily in manner of speed. Therefore, there is no certain judge that classification could be made by only using speed parameter. Moreover, it is not close to the top of threat assessment cues with respect to importance. Still, speed is a good indication of target capability when it exists [10, 11, 14, 16].. Threat evaluation model uses this parameter considering seriously weight of it to final result. Speed parameter contributes the model as follows:
The score generated by speed parameter is found by dividing current speed value of target to maximum value of platforms. Here, maximum value of platforms differentiate according to category of target given in the beginning of model.
2) Deceleration: Change of speed does not imply important indication for air tracks. There is no pattern in speed parameter that indicates danger when observing air platforms. Therefore, the deceleration parameter does not used in air flow part of the threat evaluation model. When it comes to surface platforms, deceleration of naval platforms indicates abnormal intent for friendly assets [11]. If a naval vessel follows its route with steady speed, this vessel is supposed to be safe object for our own ship. Moreover, acceleration at speed of target indicated a danger for our own ship, but it is not much as deceleration case. The formal definition of the deceleration/acceleration score is indicated as follows:
As (4) shows, deceleration of objects has more influence on the score than acceleration does. This influence is adjusted with weight coefficient that decrease the score of acceleration with a specific ratio.
3) Distance: Location information of both own ship and target on earth sphere is available. Therefore, the haversine formula is able to compute the distance from our platform to target object [19]. The calculated distance is found in two dimensional space since there is no altitude data of surrounding air objects. Since the third axis in space is missing on calculation for air objects, the distance does not reflect the real situation for tactical picture of air entities. However, the amount of distance in two dimensional space is still serve valuable opinion about the intent of objects. At least, the objects are not closer than the amount calculated in two dimensional space. As expected, farther target is thought as safer than closer one. Therefore, it has lower score than closer one [10, 11, 14, 16].
The score of this cue is calculated in similar way for both air and surface objects. However, the contribution of this cue to total score is different with respect to importance level. While range is the most important kinematic cue for surface objects[11], some of other cues pass the importance level of this cue in air threat assessment studies [16]. Therefore, the contribution of the threat assessment cues is not same in air and surface tactical picture. It is adjusted with weight parameters according to their importance in algorithms while calculating total score.
4) Heading: The direction of target’s heading is another important cue to understand target intent against defended asset [10, 14, 16]. As expected, if the target’s heading is pointed out to defended asset, then it is a signature of danger for the defended one. If target’s heading is not related with the positon of defended asset, then it means that target does not show any interest to defended object in manner of heading cue.
- Heading Angle
The measurement of the danger level in this cue is computed by determining the orientation of target with respect to own ship position. In Figure 2, the red object is target and its heading is pointed out to blue object which is the defended entity with a degree of α angle. If α angle is getting bigger, then it means that target is not interested with the position of defended asset. Therefore, this situation decrease the danger on blue object. When α angle is getting smaller, then it means that red object point out its heading to blue object and it will come closer in time to defended asset. As a result, this positioning cause danger for the defended asset in manner of heading cue. As a result, the score generated by heading cue is calculated as follows:
Since air objects has a hidden altitude value in two dimensional space, they would fly over defended asset even if their heading directly point out the defended asset. However, in surface tactical picture, this behavior is the danger of impact in the end. Therefore, the heading of target reveal more danger in surface tactical picture when compared to air tactical picture.
5) Maneuver: Maneuvers around the defended target is another unusual behavior that implies unfriendly act for it. Therefore, it is useful to take into account this kinematic data to threat evaluation process [10, 14, 16]. There are various options to measure the value of maneuver cue. The method could count maneuvers made at a specified time interval. However, this approach needs more frequent in order to determine the specific number of maneuvers. What behavior is thought as a maneuver is another discussion that needs to be solved. Instead of this complexity, a simple method come forward to handle situation. Firstly, the difference between consecutive course values is calculated and this value is divided to angle of maximum maneuver.
Air objects are capable of making sharp maneuvers. However, a plane that follows steady path does not requires to make this move frequently. Therefore, if a maneuver is observed from kinematics of air objects, then it make contribution to threat level of them. However, maneuver is not considered as a serious indication of danger for surface objects. Therefore, it is not used in the calculation of threat level for surface objects indeed.
6) Closest Point of Approach (CPA): Another key parameter in threat evaluation models is CPA of the target according to defended asset [20]. In many threat evaluation techniques, threatening tracks are prioritized by measuring the distance of threatening track to its CPA by own platform.
The score is generated in same manner of other cues. There is an acceptable maximum value for CPA distance, and the method divide the current value to maximum value.
CPA cue is beneficial to understand behaviors of air tracks and surface tracks. Air tracks are able to change their heading rapidly. This affects the CPA of target asset very quickly, also. According to air warfare studies, it has respectable impact on CPA. Actually, it is the one the most effective cue that measuring threat level of surrounding asset [11]. However, CPA for surface tracks does not produce same effect as air track does. Still, it is not an ignorable parameter and has specific effect on threat level of assets.
7) Time Before Hit: CPA is very useful indication to estimate behavior of threating asset. It is possible to strengthen this cue by taking account other kinematic information. In the study of Johnson and Falkman, TBH term is proposed in that manner. At that case, the speed of target and both CPAs are decisive factors. The time that suspected object follow the route to reach defended asset by passing through CPAs is measured. While calculating this time, defended asset is presumed to be stationary. If this time is smaller, then it means that there is undeniable threat against defended asset. Otherwise, defended asset is in safe territory...
- The Route Passing Through CPAs
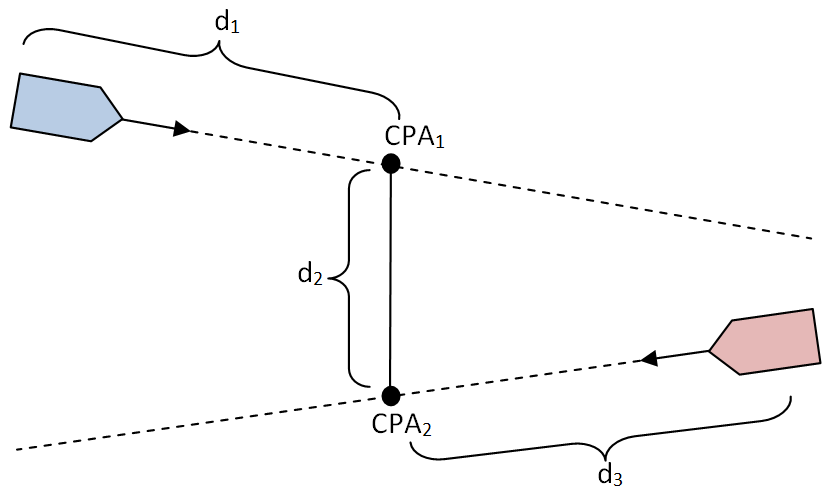 Figure 3 shows the route of the suspected object needs to follow to get defended asset by passing through CPA points.
Explanation of each leg of the route is described as follows:
- d1: The distance between friendly asset and its CPA to the threating object.
- d2: The distance between two CPA points.
- d3: The distance between threating object and its CPA to friendly asset.
The time that takes the catch friendly asset in its current position by passing CPA points determines TBH: The score of this is generated by dividing TBH to a reasonable maximum value expected from TBH.
TBH is taken into account for both air and surface tracks with a specific weight. This weight is adjusted by running scenarios consecutively and interpreting output of them.
4.3. Threat Selection Process Based on Bayesian Inference
It is difficult to observer dozens of surrounding objects even if a threat assessment rating is assigned to each of them by a threat evaluation algorithm. Classically, operator begin to examine targets from top of the list. After enough observation and investigation, C2 operator classify unknown target as friend and go on examining next target in the list; or C2 operator classify unknown target as hostile and take the necessary action needed. There is no border in the middle of list, which shows remaining part of the list is not worth to further investigation.
It is very critical to save time for C2 operator while making these observation and spend valuable time on real suspected object. We brings a mechanism based on Bayesian Inference that highlight the targets that need more attention than others. Formally, the method draws the border line on ranked list, which separates targets needs to be seriously assessed.
In Bayesian Inference, a hypothesis is put forward and the reality of this hypothesis is tried to be proved by evaluating evidences related with hypothesis [21]. After the evaluation, the hypothesis is interpreted as true or false. In our case, the hypothesis is whether a track is a target or not with a given scores of threat assessment cues. Here, threat parameters take the role of evidences in Bayesian Inference. The answer of the hypothesis gives the information whether track is target. If the result is positive, then related track is marked in the list. Therefore, C2 operator can concentrate on more these tracks that interpreted as target.
Bayesian Inference is an useful method showing the formula learning unknown status of the situation from available data [21]. Simply, Bayes’ rule let us reach the posterior probability (the posterior) of a hypothesis with given prior probability (the prior) and compatibility of the observed evidence with the hypothesis (the likelihood) [22]. Bayes’ formula points out the method to change probability statements by the use of evidences [15]. Formally, Bayes’ theorem is formulized as follows [21]:
Definition of each term in Bayes’ theorem and the corresponding instances of these expressions inside the threat selection problem can be described as follows:
- H stands for the hypothesis that is tested according to Bayes’ rule. The tested hypothesis in this paper is whether track is a target or not.
- E stands for the evidence that is available information to calculate posterior probability from prior probability in Bayes’ formula. Threat assessment cues take role of evidences in this paper.
- P(H) stands for the prior probability of the hypothesis before the evidence is observed. In this paper, previous result of threat selection algorithm hold the place of the prior probability.
- stands for the posterior probability of a hypothesis (H) after observing the evidence (E). In this paper, initial situation is the previous result of the threat selection algorithm, which is formally P(H). The fusion of the threat assessment cues bring to pass the observation of evidences. Then, posterior probability is obtained after application of this observation on prior probability.
- The remaining term in the formula, , is the impact of evidence on the prior probability. Similarly, the data fusion of threat assessment cues’ scores is determinant factor for the threat selection process.
Bayes’ formula takes the following form after reinterpretation of terms according to threat selection process:
Similarly, explanation of each term in (11) as follows:
- T symbolizes the threat selection hypothesis that if a track is target.
- C denotes threat assessment cues which are evidences of hypothesis T.
- is the prior probability of the hypothesis before evidences are observed, namely, the probability found at the previous iteration of threat selection method.
- stands for the posterior probability of the threat selection hypothesis (T) after observing threat assessment cues (C).
- The remaining term in (11) is and it is the impact of the fusion of threat assessment cues on previous result of the threat selection method.
Threat selection method uses threat assessment cues according to their rank of importance is listed in Table 2 below. The importance ranking of the threat assessment cues mostly determined by taking reference of air warfare studies and surface warfare studies [11, 16].
Table II: Threat assessment cues according to the importance in threat selection
| Air Tracks | Surface Tracks |
|
· Closest Point of Approach (CPA) · Speed · Maneuver · Heading · Distance |
· Distance · Heading · Deceleration · Speed · Closest Point of Approach (CPA) |
TBH cue is removed from the list because of the assumption of conditional independence. This assumption does not allow to fuse evidences that are dependent to each other [22, 23]. Since TBH is dependent to speed cue, there is a need to remove one of them from the list. CPA holds the part of the information that TBH has. However, there is no way to reach speed effect in TBH. Therefore, threat selection algorithm does not accept TBH as evidence.
Scores of threat assessment cues reference multiple evidences in Bayes’ rule. These evidences are fused to locate in Bayes’ formula together. Therefore, there is a need to redefine (11) according to combination of these evidences. Equation (11) is turned to following form after processing multiple evidences rule:
In (12), denotes the probability of track to be a target Moreover, stands for the probability of a track to not being a target. After the computation of probability of T hypothesis, decision making process of this process is simply performed as follows:
Threshold value is chosen somewhere middle of the scale. Because, Bayesian Inference results tends to get maximum or minimum value when it becomes stable after couple of iteration. This result could be observed in the evaluation section of this paper.
4.4. The Calculation of Threat Assessment Rating
Threat selection algorithm separates the list of suspected objects as target that needs more attention and other tracks that does not have priority to be observed. There is still need of ranking on this list if a scenario includes dozens of objects.
Threat assessment rating of each object is calculated by taking account into scores generated from threat assessment cues. Each threat assessment cue does not affect the final result equally. They influence the result with respect to the importance on threat level against defended asset. While their weight on threat assessment rating is determined, studies done for air and surface warfare are considered as reference. The list of threat assessment cues and weight of them changes depending on category of surrounding objects. Table 3 gives this lists and importance order of cues as follows:
Table III: Threat assessment cues according to the importance in threat assessment
| Air Tracks | Surface Tracks |
|
· Time Before Hit (TBH) · Speed · Maneuver · Heading · Distance |
· Distance · Heading · Deceleration · Speed · Time Before Hit (TBH) |
As explained in section 4.2, each threat assessment cue does not carry same weight in calculations. Therefore, formal definition of the calculation of threat assessment rating can be described as follows:
First phase of the threat evaluation model generates the score for each threat assessment cue after the selection of the category. These scores are generated by following methods introduces in section 4.2. In (16), denotes scores generated in that phase. Then, threat assessment rating is calculated by adding up these scores with a specified weight. (14) defines weights of air tracks and (15) shows the relation of weights for surface tracks.
Equation (16) defines the calculation of threat assessment rating formally. (17) is more clear version of (16), which gives details of formulas for each category. Threat assessment rating is calculated at each iteration. Whenever kinematics of track or own ship is changed, then threat assessment rating of each track is updated.
5. Evaluation
Threat evaluation model is evaluated with synthetic scenarios. Similar scenarios are formed for both air and surface objects. While playing these scenarios, scores of threat assessment cues and resulting threat selection value and threat assessment rating are recorded in combat management system. These records are visualized by using ordinary charts that show probability of threat assessment cue as y-axis and iteration of each calculations as x-axis.
Synthetic scenarios are generated with the tool that capable of produce track data and own ship data. Objects in simulation tool are able to follow route defined by the user. Moreover, category and speed of objects can be entered to system by the user. While playing scenario, simulation tool directs related data to combat management system.
- Syntetic Scenario 1
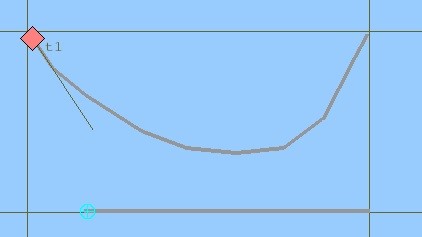 Figure 4 shows the first scenario generated in simulation tool.
This scenario is played for both an air object and a surface object. The mentality behind this type of strategy is to see whether category affect algorithms results or not. We expects the difference results since threat assessment cues and their weight are different in categories.
According to first scenario, red object closes to the route of own ship that symbolized with blue mark, then point out its heading away and become distant to own ship as shown in Figure 4. In surface scenario, speed of the red object is convenient to a naval vessel platform.
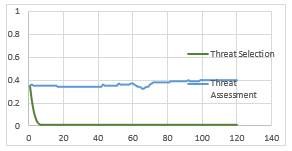
- Results of Previous Study for Synthetic Scenario 1 Used for Surface Object
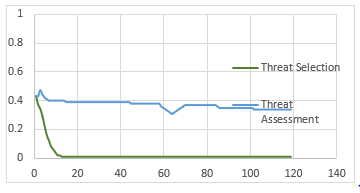 Figure 5 indicates that previous implementation [1] results seems to be very steady.
There is no critical change on the threat level even if surface object changes its route significantly. Since common parameters and weights used for both categories in this implementation, kinematics of surface object could not exceed barriers of those parameters. Therefore, result is not a good indication for operator.
- Threat Assessment Parameters Scores and Resulting Threat Selection Probability and Threat Assesment Rating for Synthetic Scenario 1 Used for Surface Object
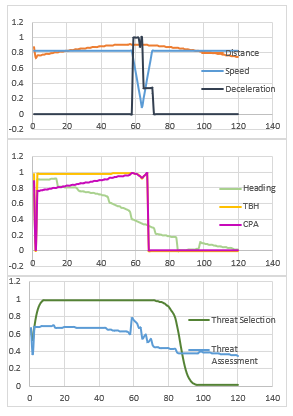 Figure 6 indicates scores of threat assessment cues and results of algorithms.
At the beginning of the scenario, TBH and CPA are very dominant over results. Since orientation of red object is very threatening for own ship, it classified as target by threat selection algorithm and takes around 0.7 threat assessment rating. In the middle of scenario, red object slower down its speed. This behavior causes an increase at deceleration score. Then, threat assessment rating increase as expected. I nth second part of the scenario, red object changes its orientation and give up being threat for own ship. Its threat assessment rating drops with this movement. However, threat selection algorithm does not classify the res object as friendly despite of last movement. This is a reasonable results since there is no guarantee that danger has passed away. Algorithm warns the operator for a while to follow actions of red object. After an enough number of iterations, red object seem to be not dangerous. Threat selection algorithm decrease its total score while it goes away.
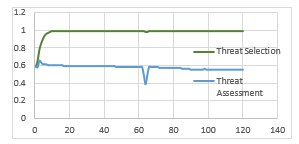 Fig.7: Results of Previous Study for Synthetic Scenario 1 Used for Air Object
Similar to the surface scenario, previous implementation [1] results seems to be very steady again in Figure 7. Air object is selected as a threat all the time and threat assessment rating does not change sharply.
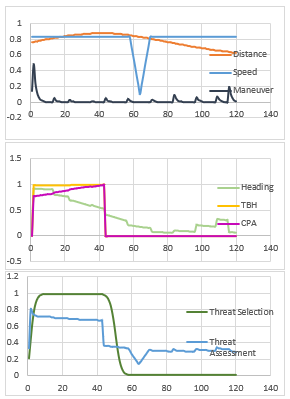 Figure 8 reveals results of similar scenario with an air object.
Red object follows again typical scenario shown in Figure 4 with the speed making sense for an air object.
In the beginning of the scenario, red object is categorized as target again by the threat selection algorithm. It takes around 0.8 threat assessment rating. When it turns out its heading way from defended asset, its threat assessment rating begins to drop down. After a while, TBH and CPA becomes low and it drop down the threat assessment rating sharply. Then, threat selection algorithm begin to decrease its threat level. In the middle of the scenario, speed of red object is slower for a while. This situation lead to decrease in threat assessment rating. Since deceleration does not mean anything for an air object, results of algorithm behaves different then what they do in surface scenario.
Through the end of the scenario, red object move away and become distant to friendly asset. As a result, threat assessment rating becomes close to 0.
- Threat Assessment Parameters Scores and Resulting Threat Selection Probability and Threat Assesment Rating for Synthetic Scenario 1 Used for Air Object
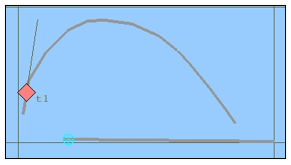 Figure 9 indicates second general scenario by the user in simulation tool.
According to scenario, red object moves around defended asset by not changing its distance too much.
- Syntetic Scenario 2
 In Figure 10, it is not difficult to observe that previous implementation [1] could not give a valuable feedback about the foreigner entity as shown in figure.
The object is classified as safe through the scenario.
- Results of Previous Study for Synthetic Scenario 2 Used for Surface Object
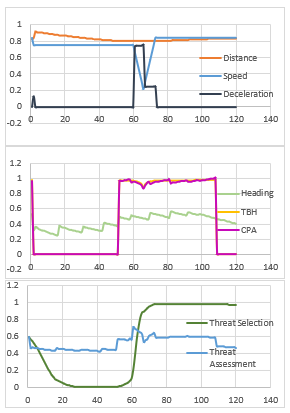 Figure 11 indicated results of second scenario for surface object.
Since there is a peek for CPA and TBH in the beginning of the scenario, red object is sensed as threat. When red object sits on its road, threat selection algorithm give up threat classification for red object. In the middle of scenario, CPA and TBH becomes higher again. Threat selection algorithm notice the danger and classifies red object again as threat. However, threat assessment rating of red object does not affected from this change too much.
- Threat Assessment Parameters Scores and Resulting Threat Selection Probability and Threat Assesment Rating for Synthetic Scenario 2 Used for Surface Object
Because, TBH is bottom of the list according to importance level of threat assessment cue. Threat assessment rating gets its highest value when surface object slows down. This behavior activates deceleration cue and increase threat assessment rating to highest value.
Similarly, previous implementation [1] does not provide beneficial picture to the operator as shown in Figure 12. Results does not affected from kinematics of object very much.
- Results of Previous Study for Synthetic Scenario 2 Used for Surface Object
- Threat Assessment Parameters Scores and Resulting Threat Selection Probability and Threat Assesment Rating for Synthetic Scenario 2 Used for Air Object
The route in Figure 9 is repeated for air object that has higher speed than surface object normally. As can be seen in Figure 13, red object is classified as threat at the beginning of the scenario. Because, TBH and CPA is effective at that time. Then, threat assessment rating begin to decrease. CPA and TBH shows themselves time to time. While the response of the threat assessment rating is a sharp increase, threat selection algorithm does no affected from this short period movement. Red object end scenario as safe object.
6. Related Work
There are many researches from different perspectives for threat evaluation problem. Mainly, rule based approaches, fuzzy logic methods and Bayes network studies are popular ones in this field as follows.
U.S navy officers have made serious contributions to a rule based study by answering question of survey related with threat evaluation in air defense domain [16]. Moreover, a different survey is conducted with U.S navy officers to contribute study done for threat evaluation in surface warfare [11]. These studies reveals most important threat assessment cues in both air and surface domain. After the extraction of these cues, rule based techniques applied on them to find out threat assessment rating of surrounding entities.
Fuzzy sets theory is used in another study for air threat evaluation process [15]. Range, altitude, CPA, speed, maneuver, weapon envelope, visibility, own support, fire, target support and IFF are used as threat assessment cues in proposed fuzzy inference system. It is claimed that simulation results indicate that proposed method is correct, accurate and reliable and it has minimum error in evaluating threats. By using fuzzy logic, they handle with imperfect situations, also.
Another study use altitude, speed, CPA and range as parameters to compute threat assessment rating of entities in tactical picture. This method is a fuzzy knowledge based reasoning model [24].
Bayesian belief networks takes important place in many threat assessment systems while performing fusion operations. Since Bayesian networks provides flexibility in terms of taxonomy of threats, it is chosen as a fusion method in Beaver’s study [25]. Moreover, a security threat assessment model based on Bayesian Network is proposed in order to prevent subjective judgement of the information and bring objective perspective to OWA operators [26].
Another study uses Bayesian network to measure the overall probability of a threat that shows five anomalous ship behaviors. These behaviors are listed as deviation from ordinary routes, abnormal AIS activity, unexpected port arrival, abnormal close approach and zone entry [27]. For each behavior, the method shows whether the specific behavior occurs with a probability value.
In study based on Bayesian Network, target type, weapon range, speed, TBH and distance are taken into account while calculating threat basement rating [9]. Nodes of Bayesian Network is formed from these cues. There is hierarchical relationship between them, which could be examined more in detail at mentioned article.
A Bayesian Network based method is introduced by claiming advantages over other methods such as logical and fuzzy [18]. This study works for air defense scenarios. Moreover, linear Gaussian approximation seems to be necessary for their implementation.
Another threat evaluation system based on Bayesian Network is developed in Johansson’s study [9]. Mainly, target type, weapon range, speed, TBH and distance are used as threat assessment cues. These parameters become the nodes of Bayesian Network while constructing the relationship among them.
Dynamics of threat evaluation problem changes depending on capabilities of platform and target’s category. Systems that deployed on platforms has effective influence the problem. This situation is main reason behind the selection of threat assessment cues in the combat management system of the platform.
7. Conclusion
In this paper, we extent the work that originally presented in 2016 IEEE Symposium Series on Computational Intelligence (SSCI) [1]. Original paper presents threat evaluation model depending on kinematics of target without any indication about target’s classification. Proposed model accepts all targets and produces results for them without checking any capabilities of objects. This paper updates threat evaluation model by adding category information to the model. In this time, model has category information about surrounding objects and there is a chance to benefit from this critical information.
Updated threat evaluation model begins with the category selection step. If an object is an air force, then the model apply air procedure on it; otherwise, surface parameters are taken into account to evaluate the threat level of the object. Basically, threat evaluation model for air and surface objects follows same path within themselves. Firstly, threat assessment cues are extracted from target’s kinematics. Then, threat selection algorithm are applied on target by benefiting from scores generated at first phase in both air and surface flow. Finally, threat assessment rating are calculated by fusing threat assessment cues in both flows. However, there are significant differences that affect the resulting values between air and surface flow of the model. Firstly, air objects and surface objects are separated from each other by indication of danger. While maneuver cue is a indication of dangerous target for air objects, it does not have this kind of effect on surface object. Moreover, the deceleration cue has an impact on threat level of surface object, there is no influence of deceleration cue on air objects. Therefore, set of threat assessment cues change according to the category information of the target. Other threat assessment cues are common for both categories. However, their importance ranking are very different. While TBH is very important for air objects, distance dominates cores of surface object. This situation generates critical difference between flows of the model and it could be observed from results of synthetic scenarios. As a result, this study brings more confident results since it takes into account of accurate dynamics of related category while evaluating threat level of objects.
Original work apply same model to all targets without considering target’s nature and capabilities. Current model eliminate these deficiencies at certain level. Similar synthetic scenarios are played for different categories. It is observed that behavior of models changes accordingly.
Evaluation section reveals that original work does not make an impact as current one while running on defined synthetic scenarios in this paper. Mostly, results of previous work seems to be steady. Once, a target is classified as threat, it remains at the same classification through the rest of the scenario. However, target moves and changes its direction in all scenarios. It seems to be Common parameters and cues for both air and surface objects does not perform well for these scenario.
Original work results with one common list that includes air and surface objects together by applying same methods on them. In this study, air and surface objects follows different flows with parameters special for them. In the end, threat evaluation model generated two list, one for air objects and one for surface objects. There is no fusion of these two lists. As a future work, threat evaluation model could be updated to produce one common list by combining results coming from different flows. Ranking surface and air objects will require serious investigation to reach confident results.
Conflict of Interest
The authors declare no conflict of interest.
Acknowledgment
We wish to thank our company, ASELSAN A.Ş, and in particular our division, Defense Systems Technologies, for their encouragement and vision that allow us to prepare this work.
- Çöçelli, M. and E. Arkın. “A threat evaluation model for small-scale naval platforms with limited capability”. in Computational Intelligence (SSCI), 2016 IEEE Symposium Series on. 2016. IEEE.
- Boyd, J.R., “The essence of winning and losing”. Unpublished lecture notes, 1996.
- Irandoust, H., A. Benaskeur, F. Kabanza, and P. Bellefeuille. “A mixed-initiative advisory system for threat evaluation”. in Proceedings of the 15th International Command and Control Research and Technology Symposium: The Evolution of C. 2010.
- Riveiro, M., T. Helldin, M. Lebram, and G. Falkman. “Towards future threat evaluation systems: user study, proposal and precepts for design”. in Information Fusion (FUSION), 2013 16th International Conference on. 2013. IEEE.
- Park, S.C., Y. Kwon, K. Seong, and J. Pyun, “Simulation framework for small scale engagement”. Computers & Industrial Engineering, 2010. 59(3): p. 463-472.
- Mury, B.N., Bao, “A Recursive Engagement Simulation Tree (REST) For Use in Maritime Defence”. 2007, Defence R&D Canada – Atlantic.
- Bolderheij, F. and P. Van Genderen. “Mission driven sensor management”. in Proceedings of the 7th International Conference on Information Fusion. 2004.
- Paradis, S., A. Benaskeur, M. Oxenham, and P. Cutler. “Threat evaluation and weapons allocation in network-centric warfare”. in Information Fusion, 2005 8th International Conference on. 2005. IEEE.
- Johansson, F. and G. Falkman. “A Bayesian network approach to threat evaluation with application to an air defense scenario”. in Information Fusion, 2008 11th International Conference on. 2008. IEEE.
- Liebhaber, M.J. and B. Feher, “Air threat assessment: Research, model, and display guidelines”. 2002, DTIC Document.
- Liebhaber, M.J. and B. Feher, “Surface warfare threat assessment: Requirements definition”. 2002, DTIC Document.
- Waltz, E. and J. Llinas, “Multisensor data fusion”. Vol. 685. 1990: Artech house Boston.
- Blasch, E., et al. “High level information fusion developments, issues, and grand challenges: Fusion 2010 panel discussion”. in Information Fusion (FUSION), 2010 13th Conference on. 2010. IEEE.
- Liebhaber, M.J. and C. Smith, “Naval air defense threat assessment: Cognitive factors and model”. 2000, DTIC Document.
- Azimirad, E. and J. Haddadnia, “A New Data Fusion Instrument for Threat Evaluation Using of Fuzzy Sets Theory”. International Journal of Computer Science and Information Security, 2015. 13(4): p. 19.
- Liebhaber, M.J., D. Kobus, and B. Feher, “Studies of US Navy air defense threat assessment: Cues, information order, and impact of conflicting data”. Studies, 2002.
- Johansson, F., “Evaluating the performance of TEWA systems”. 2010.
- Okello, N. and G. Thorns, “Threat assessment using Bayesian networks”. Information Fusion, 2003: p. 1102-1109.
- Robusto, C., “The cosine-haversine formula”. The American Mathematical Monthly, 1957. 64(1): p. 38-40.
- Roy, J., S. Paradis, and M. Allouche. “Threat evaluation for impact assessment in situation analysis systems”. in AeroSense 2002. 2002. International Society for Optics and Photonics.
- Box, G.E. and G.C. Tiao, “Bayesian inference in statistical analysis”. Vol. 40. 2011: John Wiley & Sons.
- de Vos, A.F., “A primer in Bayesian Inference”. preprint, 2004.
- Russell, S. and P. Norvig, “AI a modern approach”. Learning, 2005. 2(3): p. 4.
- Liang, Y. “An approximate reasoning model for situation and threat assessment”. in Fuzzy Systems and Knowledge Discovery, 2007. FSKD 2007. Fourth International Conference on. 2007. IEEE.
- Beaver, J.M., R.A. Kerekes, and J.N. Treadwell. “An information fusion framework for threat assessment”. in Information Fusion, 2009. FUSION’09. 12th International Conference on. 2009. IEEE.
- Wu, K. and S. Ye, “An information security threat assessment model based on Bayesian network and OWA operator”. Applied Mathematics & Information Sciences, 2014. 8(2): p. 833.
- Lane, R.O., D.A. Nevell, S.D. Hayward, and T.W. Beaney. “Maritime anomaly detection and threat assessment”. in Information Fusion (FUSION), 2010 13th Conference on. 2010. IEEE.