Public transportation network design: a geospatial data-driven method
Public transportation network design: a geospatial data-driven method
Volume 2, Issue 3, Page No 1298-1306, 2017
Author’s Name: Alexey Golubeva), Maxim Shcherbakov
View Affiliations
Volgograd State Technical University, CAD, Lenin av., 28, 400131, Volgograd, Russia
a)Author to whom correspondence should be addressed. E-mail: ax.golubev@gmail.com
Adv. Sci. Technol. Eng. Syst. J. 2(3), 1298-1306 (2017); ![]() DOI: 10.25046/aj0203164
DOI: 10.25046/aj0203164
Keywords: urban development, geospatial data analysis, PTN design, route planning, decision support, GIS

Export Citations
The paper explores an issue of efficient public transportation network design as a part of the urban developing process. Having data about everyday residents travelling inside of an urban area, we can consider this data as people’s requirements for the public transport system. We propose a novel method for initial public transportation network design based on clustered geospatial data containing origin/destination point of travel patterns of residents. The core of a method is a set of four algorithms for selecting terminal clusters based on a number of centres (or focuses). The appropriate quality criteria are proposed: degree of transport demand satisfaction, the coefficient of non-straightness, and transport network density. Use cases allow evaluating a performance of proposed method and give sufficient conclusions about its application.
Received: 10 June 2017, Accepted: 17 July 2017, Published Online: 01 August 2017
1 Introduction
Urban Computing is a scientific area which provides models and methods for designing convenient urban environments. Also, the set of models allows predicting how the urban area changes and supporting decision making for urban planning and reconstructing [1]. For instance, urban planning includes operations for transportation, communication and distribution networks design toward to improving residents quality of life [2].
The public transportation network (PTN) in general meaning (including buses, underground, taxi, etc) is sufficient part of the city. From the one side, the city is growing around transport infrastructure, from another side, the expansion of city leads to the implementation of infrastructure projects. Residents select their location for living based on many criteria, but the transport is the essential one. Generally, the ideal public transport networks provide a service with minimal travel time, also including time for waiting and changes. As PTN contains the different service provider, the concurrency leads to increasing quality of service. In real life, PTN is not so efficient, moreover for new developing areas. Commonly used methodologies for transport system design and development evaluates technical features, but they do not take into consideration the residents opinions and preferences into consideration. It leads to a fundamental contradiction: if people do not use public transportation network due to its inefficiency, they prefer personal carriers, but increasing the number of cars in a city leads to negative ecological and economical effect, like traffics. Developing new datadriven tools which consider residents’ preferences of travel paths is challenging tasks for Urban Computing domain.
Actually, new data collecting technologies allow gathering data about different aspects of people’s life. Cell operators can detect the position of a subscriber with acceptable quality level. A post in Twitter contains data about location rectangle event, where a post was made. Geospatial data is are a common part of most information gathered by software applications. In this case, if a person has his/her own common travel paths (the most used origin-destination points) they can be considered as personal requirements for transportation systems. Having this data, we are able to (i) evaluate the efficiency of the current transportation network and (ii) to suggest modifications based on citizen’s preferences.
So, in the research, we consider the following question. Given anonymised travel data in the framework of an urban area, what the data-driven technologies which allow designing the optimal public transportation network? To find the answer this question, the following high-level steps need to be performed: (i) collecting geospatial travel data, (ii) reasonable
data reduction for generalisation of key points in routes in a PTN, (iii) designing a set of (sub)optimal routes and (iv) picking up the appropriate PTN according to multicriteria decision analysis based on quality criteria [3]. If we have travel data of every single person in an urban area, we can evaluate the most optimal stops as nodes in public transportation routes. Suppose we get information about 5% of residents of a city with 1 million population. In this case, the correspondence matrix has 500002 elements. Reduction of original nodes count allows to detect the centres of clusters and to understand where stops could be located. Attempts to solving the problem of optimal PTN design lead to many subtopics including data processing algorithms over geospatial data [4]. As an example, a task of finding public transportation network with (sub)optimal routes based on defined clusters. This problem includes the well-known tasks like shortest path search problem as well as specific task need to be explored, e.g. how to create initial public transport network based geospatial data analysis. In contrast with shortest path search problem with its many efficient and fast program solutions e.g. OpenStreetMap (OSRM), the initial network design is the unstructured problem containing multi-criteria decision analysis.
The main contribution of the paper is a novel method for initial public transportation network design based on clustered geospatial data containing origin/destination point of residents. The core of a method is a set of four algorithms for selecting terminal clusters based on focuses.
A paper has the following structure. After the introduction, we observe literature referring to a problem of data-driven approaches for transportation network design. Next, we propose a novel method for initial PTN design with various approaches for terminal clusters choice. Use cases section describes how the method was implemented and estimated over data according to performance evaluation criteria. The conclusion contains the main findings and future work ideas.
2 Background
Classical planning and development of the public transport network is a well-studied field of science. Methodologies for planning the transport network of the city according to [5] includes the sequence of actions: (i) public transportation network design; (ii) setting timetables; (iii) scheduling vehicles to trips, (iv) and assignment of drivers and other maintenance work.
You can also observe the emergence of a number of theoretical studies. In work [6] author proposed a hypothesis about the routing of tables with a symmetric shortest trajectory. It describes the symmetric routing of the shortest path table and presented counterexamples for its hypothesis. In their article [7], Daniel Delling et al. investigate the problem of calculating all optimal Pareto travels in a dynamic public transport network and introducing an algorithm for a public transit route (called RAPTOR). Another of their work [8] offers a routing mechanism for calculating traffic directions in large-scale road networks. And in [9], we suggest public transit transportation as the solution of the journey in the future. Turning to other works, one can distinguish [10]. The authors study the problem of finding good alternative routes in road networks. They look for routes that (i) differ significantly from the shortest path, (ii) have a small extension, and (iii) are locally optimal. The authors of the paper [11] proposed the RICK algorithm for constructing popular routes from undetermined trajectories, using information on the sequence of locations and time intervals. In the article [12] Tim Duyer and Lev Nahmanson proposed fast cross-routing for large graphs. They focus on discussing two methods for achieving faster routing using approximate methods of finding shortest paths. In such sources as [1, 13– 15] the issues of theoretical research, planning and optimization of the transport network are given very great attention. Special attention is paid to the best practices in [1, 15].
Also we analysed different well-known algorithm to solve short path problem such as A*, IDA*,Breadth-First-Search, Best-First-Search, Dijkstra’s algorithm, Bi-directional A*, Jump Point Search, Orthogonal Jump Point Search, Two-stage algorithms (ALT, Reach) and genetic algorithms of random search. Such algorithms like A*, IDA*, Best-FirstSearch, ALT (A* labeling and methods are based on the inequality of the triangles used to work without prior preparation data that leads to the intersection large graphs and create significant problems in the time cost. In contrast to these algorithms exist such as HLC [16], HL, T NR [17] and lookup tables, where the costs associated with the pre-processing and data storage, while the speed of the algorithms are very fast.
Besides theoretical results, software implementations for decision support in urban transportation planning have been observed. PTV Visum [18] is software for evaluation existed (defined by a responsible person) public transport network based on transportation matrix. Another software called Emme, proposed by “INRO Software” [19] and SaaS solution by Citilabs is named Cube Cloud [20]. The Transportation Analysis and Simulation System (TRANSIMS) developed by [21] is a set of tools for analysis of regional transportation systems. TRANSIMS is an open source project which is available for public usage under NASA Open Source Agreement Version 1.3. Software like Aimsun is used in urban development traffic modelling that allows to model fusing travel demand and simulate networks of difference complexity [22].
| www.astesj.com 1299 |
The task is closely related to the task of routing from point A to point B, but it has some differences. First, in the typical task of routing, the objective function is the journey time from the beginning to the end of the route, which must be minimized. In the case of the construction of a network of public transport routes, the objective function is an integral function that takes into account the average time of the pedestrian travel to the stop, the length of the path, the number of transplants and other characteristics of [5, 23]. Secondly, in the typical task of routing for the movement, any intermediate points that reduce the route are selected, whereas in the problem under consideration the intermediate points are located in the same place as the cluster centers. All of these variables are averaged over the number of residents. Moreover, an important difference between the two algorithms is that the end point in the route can not be arbitrary since each route must contain nodes (stops) which represent the centers of clusters.
The main conclusion of the review can be drawn: in spite on different approaches for network design, the initial network structure design is not studied well. Especially, if these network obtained for data gathered from residents.
3 Ageospatialdata-drivenmethod
Algorithm 1: The scheme of the method for route network design
Data: nr,Ct,Cnt
Result: RN
- for i = 1…nr do
- Build Ri direct route, containing a pair of opposing points of Ct;
- Add Ri to RN;
- end
- while Cnt is not empty do
- for i = 1…nr do
- Select Ri from the route RN,
- Ri = [n1,n2,…nR];
- Split Ri on a pair of nodes
- P N(Ri) = [[n1,n2],[n2,n3],…,[nR−1,nR]]; 11 Initialize RC list;
- for pairs [nx,ny] in P N(Ri) do
/* Find the node minimally increases the length of the direct route [nx,ny] */
- Find cj node from Cnt with j index, which j =
argmin(|len(nx,ny) − (len(nx,cj,ny))|);
- Add [nx,cj,ny] to RC;
- end
- Compose ||RC|| options for new routes:
one variant of the RC, the rest of the P N(Ri) and compile a list of routes candidates to replace RCC;
- Evaluate the length of routes from the list RCC and choose the route R∗i with minimal length;
∗
- Replace Ri to Ri from RN; ∗
- Remove cj node entered to Ri from Cnt;
- end
- end
3.1 General description
The basic idea of the initial public transport network design is to find the network consistently adding new nodes to existed routes in respect with minimal length increasing of designed network.
Let’s consider the task statement. Given nr number of routes in the designed public transportation network, nc number of nodes (clusters centers) which should be added into network, Ct a set of terminal nodes, Cnt a set of non-terminal nodes, correspondence matrix ||Cnt+Ct||×||Cnt+Ct||. Note, that Ct+Cnt = nc. Output of proposed algorithm is a transportation network RN with routes containing non-overlapping set of nodes,
(i) (i)
ri = [p1 ,…,pk ], where i = 1,…,nr.
We propose the algorithm which contains the following steps represented in the scheme 1.
3.2 Explanation
Consider the operation of the method using a simple example. We choose the number of routes in the network nr = 2 and assume that the algorithm for the choice of terminal clusters has given us A,A0,B,B0 (Ct) and nonterminal clusters C,D,E,F,G,H (Cnt).
In the first step, we combine terminal clusters into pairs and put them in the list Ri = [AA0,BB0]. The image 1a represents this network configuration.
Next, select the first route from the list of Ri and divide it into parts (two clusters each). Because We have two clusters in the route, then we have only one route P N = [AA0].
Next, we compose a new set of routes by adding a new cluster to the middle of the existing routes from P N. In our case, we have ACA0,ADA0,AEA0,AFA0,AGA0,AHA0.
In the next step, we need to calculate the length for each new option and choose the one that has the shortest length – ACA0. Add this route to the list RC.
Next, we compose all variants of routes from the lists RC and P N. In our case, we have only one route ACA0 and we add it to the list of R∗i. The used cluster ACA0 is removed from Cnt. We perform similar operations for BB0 and get a new route BFB0. The image 1b demonstrates this stage of construction.
On the next iteration of the algorithm we have Ri = [ACA0,BFB0]. Using ACA0 we get two pairs P N = [AC,CA0]. By successively adding nonterminal clusters, we get the following set: ADC,AEC,AGC,AHC,CDA0,CEA0,CGA0,CHA0. Suppose that GA0 is the shortest of all.
We make variants from CGA0 and AC,CA0 and get ACGA0. Add the resulting version to R∗i and remove G from Cnt. Similarly, for BFB0 we obtain BFHB0. The image 1c represents this stage of building a route network.
We continue to execute the algorithm while Cnt contains clusters. Finally, we get the network shown in the figure 1d.
(a) First step (b) Second step
(c) Third step (d) Fourth step
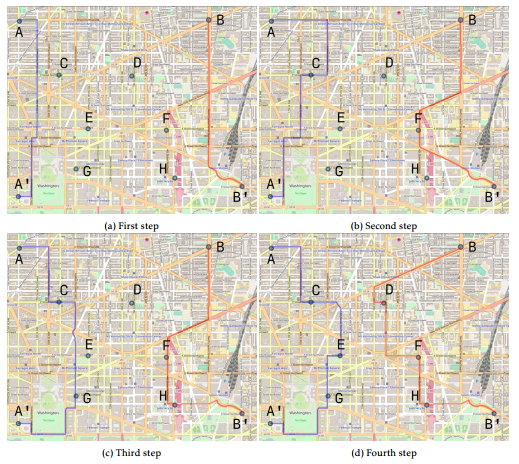 Figure 1: Illustration of the network design process.
3.3 Algorithms for choice of terminal clusters
In the last paragraph we mentioned some algorithm for selecting terminal clusters. We proposed 4 algorithms with which you can select the origindestination clusters. Let us now examine them in more detail.
Algorithm 1: opposite clusters (opposite). The essence of the method is the connection of clusters lying on opposite sides of an imaginary circle.
The main goal of this method is to choose clusters that lie on opposite sides of the city. If the city has sleeping and industrial areas located in different parts of the city, then this method will allow transportation of a large number of people to and from work.
The algorithm contains the following steps.
- Find the geometric center C of the convex hull
- Find the furthest cluster from the center C on the convex hull and consider it to be the radius
R
- On the imaginary circle formed by R, marks uniformly 2 · nr points
- the circle is given by the center of the shellC and the radius R
- nr – number of routes in PTN
- Combine the diametric points into groups oftwo
- for each point, we search for the nearestclusters in the ∆ neighborhood
- choose the points with the largest value ofpeople
Algorithm 2: from the center to the suburbs (c2out). The essence of the method: pulling all the routes to the center of the congestion of people. The main idea of the method is transportation of people from the suburbs to the center. This method is designed for the type of city for which the center is the main place for the work of a large number of people, and the suburbs – sleeping areas. The ideal form of the city for this method is the circle.
The algorithm
- Repeat steps 1-2 from method 1
- On an imaginary circle, points nr of points F are uniformly marked
- Find the center G of the city (and accordingly the nearest cluster with the largest number of people)
- Choose nr clusters near G (it is permissible to repeat clusters)
- Pair pairs of clusters from G and F
Algorithm 3: two focuses (2focus). The essence of the method: is similar to the second method, but with two focuses (cluster centers). This method is a logical continuation of method 2, but with the account that in a city there can be not one center, but two. The centers determined by this method need not be located near the geographical center of the city. Another important observation is that routes are also constructed between the focuses. The ideal shape of a city can be an ellipse or a circle. The algorithm
- Find F1 and F2 for the convex hull of a city
- clusters with the largest concentration ofpeople
- and, accordingly, the closest clusters intheir neighborhood along nr/2 for each focus
- On an imaginary circle, points B (K are uniformly nr −K – the number of routes connecting focal points)
- The first K routes include two clusters (one from F1 and the other from F2)
- Distribute the remaining points between B, F1 and F2 (one point from B, and the other from F1 or F2 (depending from distance))
Algorithms 4: N-focuses. The essence of the method: generalization of methods 2 and 3 for an arbitrary number of focuses (cluster centers).
This method is a generalization of the previous two methods: c2out and 2focus. In this case, you can choose an arbitrary number of ”focuses” for the best provision of passenger traffic between the focuses and the suburbs of the city. The form of the city for this algorithm can be arbitrary.
The methods implements the following steps
- Choose N focuses FN with the largest number of people
- On the convex hull, nr − N KN points B (KN – the number of routes connecting N focal points)
- The first N KN routes between the focal points
- The remaining points are distributed between B and FN (by analogy with method 3)
As an algorithm for searching for a convex hull, the Graham algorithm used in the methods is used.
4 Use cases
4.1 General information
To explain how the proposed methods are applied in urban development task, we showed the example for new public transportation network design for midsize city located near the large regional centre. For the subset of residents in the city, we obtain a pair of origin and destinations expressed as longitude and latitude. Origin might be where the certain resident lives and the destination where the same resident works. It means each pair shows the most popular path of the certain person in the city. This path contains a part when the public transportation is used, and walking zones. An ideal public network meets requirements according to the several criteria. We use such criteria as: the degree of satisfaction of demand for transport, the coefficient of tension and the density of the transport network.
We apply the straightforward procedure containing the following steps: (i) generation of origindestination pairs for residents; (ii) clustering all the points into 82 clusters (the number of clusters has been chosen experimentally); (iii) creating the initial transport network using the methods and algorithms described in the article.
4.2 Data
We generated data about travel citizens preferences inside of mid-sized town with approximately 350,000 residents. We received 6,000 pairs of origindestination points of 12,000 in total. In this case correspondence matrix has a large size 6,000 × 6,000 elements where every element with 0 value means no connection or 1 stands for connection existence.
4.3 Implementation
Proposed algorithms were implemented using Python and Open Source Routing Machine (OSRM) service for urban terrain distance calculation between the nodes. The program code is published online in the Git-like repository. The software used:
- Python v 3.5.2
- numpy 1.12.1
- scipy 0.19.0
- geographiclib 1.48
- polyline 1.3.2 – requests 2.9.1
- json 2.0.9
- OSRM v5.8.0
4.4 Performance evaluation
As an estimation method, an integral formula was used to evaluate the efficiency of the transport network with the following calculation criteria:
- Degree of transport demand satisfaction
N
1 X
U = Fi
T
i=1
where T is the total number of passengers in need of transportation, Fi is the number of passengers carried with i transplants, N is the number of traffic.
- Coefficient of non-straightness
N P Di P = i=1
N P Li i=1
where Di is the direct distance from the initial to the final point of the route for the i route, Li is the length of the i route, N os the umber of routes in the transport network.
- Transport network density
N
1 X
L = 1 − · S Li
4
i=1
where S is the area of the city, Li is the length of the i route, N is the number of routes in the transport network.
Integral formula for assessing the efficiency of the PTN is based on additive convolution function:
n
P Iiwi
O(I,W) = i=1n (1)
P Ii i=1
where O – integral assessment of the transport system; I – values of criteria; w – weights for the criteria that determine their importance; n – number of criteria. The decision maker’s preferences are defined as weights w.
4.5 Experimental design
To evaluate the efficiency of the algorithm and to study its specifics, we carried out experimental design varying the number of nodes and routes. The most interesting case is big geospatial data processing where a lot of nodes we processed.
To reduce the size of correspondence matrix and to understand the most popular locations, we applied clustering algorithms for original/destination geospatial data. In contrast with typical and well-known cluster techniques such as k-means and MeanShift, our algorithms used OSRM for distance calculation according to urban terrain conditions. As centers of clusters are considered as stops in a transportation network with the most populated neighborhoods, we designed different use cases regarding a number of nodes as it is a variative parameter.
As the input data for the program, the data was used after the clustering stage: 82 clusters, as well as the correspondence matrix. The following parameters were chosen as the variable experimental parameters:
- nr – the number of routes in the network (the number of routes varied from 10 to 60 in steps of 2)
- method used
- opposite (method 1)
- c2out (method 2)
- 2focus (method 3)
- ∗focus (method 4, where the focus value varies from 3 to 9)
The experiment was carried out using a computer running the Linux Mint 18.1 Serena operating system (4.4.0-77-generic x86 64 core), Intel (R) Core (TM) i54690 processor.
5 Result and discussion
Based on method implementation, we consider results regarding the following specifics:
- analysis of the efficiency of the designed transport networks with respect to different methods for selecting terminal clusters, based on the proposed criteria;
- analysis the relationship between such quality
criteria and parameters of methods;
- analysis dependencies of performance (in termsof time complexity) and on a predefined number of routes in the network.
The graph of the network quality versus the number of routes is shown in the figure 2a. The trends of the methods are shown in the figure 2b.
The method (∗focus) based on the idea of £allocation of clusters-focuses, where the largest number of people accumulate, proved to be better than all other implementations.
Depending on the number of focuses, the method behaved differently. For example, with 4 focuses, the quality of the network has the highest value in the current data set, for 8 and 9 focuses, with an increase in the number of marches, the quality of the transport network tends to grow, while for 4 and 6 – the periodical character is observed, and at 3 and 5 in general it starts to decrease (see figure 3b).
|
KernelReg from statsmodel 10 30 40 50 60 10 30 40 50 60 nr, Route count nr, Route count (a) Network assessment (b) Results of smoothing of methods rate (e.g. performance) Figure 2: Experimental results
a ± Table 1: Results of calculation time (part of the results in increments of 10) |
From the general trends, the result with 7 focus has a slight decrease in the quality of the network, It can be connected with an unbalanced network configuration when number of routes. For other methods of selecting terminal clusters, things are slightly worse. The methods opposite, c2out and 2focus have the greatest value of network quality for small values of the number of routes, and then they only decrease. If for 2focus the quality of the constructed network can be described by a linear decreasing function, then the opposite and c2out have non-periodic oscillations in their basis.
Turning to the analysis of time necessary for the calculation (Fig. 3a and 3b), we can say that the methods ∗focus and opposite are the fastest, while c2out and 2focus grow with the increase in the number routes. This can be explained by the fact that c2out and 2focus methods use a costly function to search for clusters in a given radius, i.e. With the increase in the number of routes, the number of calls to this function also increases. The calculation time for the ∗focus method for any n basically has the smallest parsing (Fig. 3b). Calculation of the algorithm running time using different methods for nr with step 10 is presented in the table 1.
We can say that the method ∗focus with a different number of foci (from 3 to 9) for the given set of geodata is the most optimal. It combines a good execution speed with the methods c2out and 2focus, and the transport networks obtained with its use have the highest quality value for any nr.
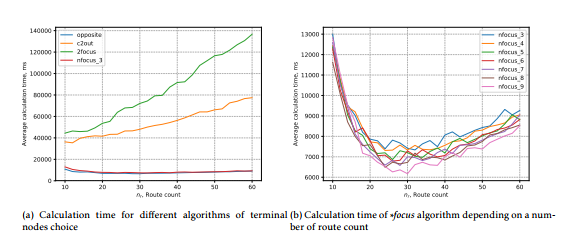 Figure 3: Experimental results Figure 3: Experimental results |
The main algorithm used to build a transport network by empirical evaluation of complexity (in terms of calculation time), the complexity of the algorithm 1 could be estimated as O(n3), where n is a number of nodes.
6 Conclusion
This article presents the method for initial a public transport network design based on the processing of geospatial data. The main idea of the proposed method is the successive addition of clusters in the transport route, taking into account its minimal increase in length. Also performance evaluation criteria is presented.
A method includes four different algorithms for terminal cluster choice: (i) algorithm based on opposite clusters, (ii) algorithm considering travelling experience from the center to the suburbs, (iii) algorithm for cities with two centers or focuses (2focus), and, finally, (iv) algorithm processing n focuses.
In accordance with the results obtained, it can be concluded that this algorithm can be used to construct the preliminary PTN. Based on the heuristic evaluation, it has cubic time complexity and the most choke point is in interaction with external services (e.g. OSRM). The proposed method ∗focus with a different number of focuses (from 3 to 9) for the given set of geospatial data is the most suitable for terminal clusters choice, because of its speed and performance.
The evaluation is based on synthesized data and thus allows only an evaluation of the performance and scalability of the approach, rather than on its effectiveness in supporting planning transport managers decisions. A feedback from mobility expert on a real case study will increase the quality of evaluating the usefulness and effectiveness of the approach. So, these can be considered as future work based on theoretical findings.
7 Acknowledgments
The reported study was partially supported by RFBR, research project No. 16-37-60066 and research project MD-6964.2016.9.
- Gustav Nielsen and Truls Lange. Network design for public transport success–theory and examples. Norwegian Ministry of Transport and Communications, Oslo, 2008.
- Danila Parygin, Natalia Sadovnikova, Alla Kravets, and Elena Gnedkova. Cognitive and ontological modeling for decision support in the tasks of the urban transportation system development management. In 6th International Conference on Information, Intelligence, Systems and Applications, IISA 2015, Corfu, Greece, July 6-8, 2015, pages 1–5, 2015.
- Alexey Golubev, Ilya Chechetkin, Konstantin S. Sol- nushkin, Natalia Sadovnikova, Danila Parygin, and Maxim Shcherbakov. Strategway: Web solutions for building public transportation routes using big geodata analysis. In Proceedings of the 17th International Conference on Information Integration and Web-based Applications & Services, iiWAS ’15, pages 91:1–91:4, New York, NY, USA, 2015. ACM.
- Maxim Shcherbakov and Alexey Golubev. An algorithm for initial public transport network design over geospatial data. In Smart Cities Conference (ISC2), 2016 IEEE International, pages 1–7. IEEE, 2016.
- Avishai Ceder. Public Transit Planning And Operation: Theory, Modelling And Practice. Butterworth-Heinemann (Elsevier Ltd), 2007.
- Thomas L Rodeheffer. The symmetric shortest-path table rout- ing conjecture. Microsoft Research, Silicon Valley, 2013.
- Daniel Delling, Thomas Pajor, and Renato F Werneck. Round-based public transit routing. Transportation Science, 49(3):591–604, 2014.
- Daniel Delling, Andrew V Goldberg, Thomas Pajor, and Renato F Werneck. Customizable route planning in road net- works. Transportation Science, 2015.
- Daniel Delling, Julian Dibbelt, Thomas Pajor, and Renato F Werneck. Public transit labeling. In Experimental Algorithms, pages 273–285. Springer, 2015.
- Ittai Abraham, Daniel Delling, Andrew V Goldberg, and Renato F Werneck. Alternative routes in road networks. Journal of Experimental Algorithmics (JEA), 18:1–3, 2013.
- Ling-Yin Wei, Yu Zheng, and Wen-Chih Peng. Constructing popular routes from uncertain trajectories. In Proceedings of the 18th ACM SIGKDD international conference on Knowledge discovery and data mining, pages 195–203. ACM, 2012.
- Tim Dwyer and Lev Nachmanson. Fast edge-routing for large graphs. In Graph Drawing, pages 147–158. Springer, 2009.
- Hannah Bast, Daniel Delling, Andrew Goldberg, Matthias Muller-Hannemann, Thomas Pajor, Peter Sanders, Dorothea Wagner, and Renato F Werneck. Route planning in transportation networks. In Algorithm Engineering, pages 19–80. Springer, 2016.
- Elena Georgievna Krushel, Ilya Victorovich Stepanchenko, Alexander Eduardovich Panfilov, and Elena Dmitrievna Beri- sheva. An experience of optimization approach application to improve the urban passenger transport structure. In Joint Conference on Knowledge-Based Software Engineering, pages 27–39. Springer, 2014.
- Paul Mees, John Stone, Muhammad Imran, and G Nielson. Public transport network planning: a guide to best practice in nz cities. Technical report, 2010.
- Daniel Delling, Andrew Goldberg, and Renato Werneck. Hub label compression. In Proceedings of the 12th International Symposium on Experimental Algorithms (SEA’13). Springer Ver- lag, January 2013.
- Holger Bast, Stefan Funke, Peter Sanders, and Dominik Schultes. Fast routing in road networks with transit nodes. Science, 316(5824):566–566, 2007.
- PTV Group. PTV Visum. http://vision-traffic. ptvgroup.com/en-uk/products/ptv-visum/.
- INRO Software. Emme. http://www.inrosoftware.com/en/ products/emme/.
- Citilabs. Cube. http://www.citilabs.com/software/cube/, 2015.
- NASA. Transims. https://code.google.com/archive/p/ transims/.
- Transport Simulation Systems. Aimsun. https://www. aimsun.com/wp/.
- Natalia Sadovnikova, Danila Parygin, Maria Kalinkina, Bulat Sanzhapov, and Trieu Ni Ni. Models and methods for the urban transit system research. In Creativity in Intelligent, Technologies and Data Science, pages 488–499. Springer, 2015.