Towards Deployment Strategies for Deception Systems
Towards Deployment Strategies for Deception Systems
Volume 2, Issue 3, Page No 1272-1279, 2017
Author’s Name: Daniel Fraunholz1, a), Marc Zimmermann1, Hans Dieter Schotten1, 2
View Affiliations
1Intelligent Networks, German Research Center for Artificial Intelligence, 67663, Germany
2Wireless Communication and Navigation, University of Kaiserslautern, 67663, Germany
a)Author to whom correspondence should be addressed. E-mail: daniel.fraunholz@dfki.de
Adv. Sci. Technol. Eng. Syst. J. 2(3), 1272-1279 (2017); ![]() DOI: 10.25046/aj0203161
DOI: 10.25046/aj0203161
Keywords: Information Security, Network Security, Deception Systems, Honeypots, Deployment Strategy, Machine Learning, Artificial Intelligence

Export Citations
Network security is often built on perimeter defense. Sophisticated attacks are able to penetrate the perimeter and access valuable resources in the network. A more complete defense strategy also contains mechanisms to detect and mitigate perimeter breaches. Deceptive systems are a promising technology to detect, deceive and counter infiltration. In this work we provide an insight in the basic mechanisms of deception based cyber defense and discuss in detail one of the most significant drawbacks of the technology: The deployment. We also propose a solution to enable deception systems to a broad range of users. This is achieved by a dynamic deployment strategy based on machine learning to adapt to the network context. Different methods, algorithms and combinations are evaluated to eventually build a full adaptive deployment framework. The proposed framework needs a minimal amount of configuration and maintenance.
Received: 22 May 2017, Accepted: 07 July 2017, Published Online: 01 August 2017
1 Introduction
Several studies suggest that cyber crime and espionage frameworks are flourishing. In the United States of America the monetary loss due to cyber crime is amounted to $1,070,000,000 in 2015 [1]. The European Union was also in the focus of organized cyber crime. 15 reported major security breaches leaked more than 41 million records of sensitive information, such as credit card information, email addresses, passwords and private home addresses [2]. In the context of highly sophisticated cyber crime such as industrial espionage, digital repression and sabotage it is common to not only trust perimeter based network security [3]. Several cyber attacks and developped attack methods such as AirHopper [4] proved that even physical isolation can be circumvented. This leads to a permanent and latent threat of successful infiltrations, which are undetectable by state of the art defense mechanisms such as firewalls, antivirus, rule based intrusion detection and prevention systems (IDS/IPS), network separation and user authentication. Deception systems (DS) enable in depth network defense support for the IT security concept. They mimic productive, secret or critical resources in the target system. Intruders can not distinguish between a DS and the actual resource. However, defenders easily detect intrusions because no connections, traffic and activities are expected on a DS. Any interaction with such a system can be classified as malicious. This technology therefore comes along with no false positive classifications, from which other defense in depth technologies such as anomaly detection often suffer. Typical issues for state of the art network defense are: Inside or insider attacks, encryption, highthroughput traffic, polymorphism and highly fluctuating signatures. Deception systems do not suffer any drawbacks on these issues. More than that, technology changes such as IPv6 do not impact DSs. However, there are other drawbacks coming along with DSs. A major drawback is the deployment [5]. The DS needs to mimic a actual system and additionally fit in the network structure [6]. State of the art for a proper configuration, deployment and maintenance is manual effort [7]. We state that a framework consisting of a scanning engine for context observation, a back-end database for proper storage of context information in combination with an engine for machine learning based on context analysis and a DS dependent deployment engine can solve this issue. This enables DSs for a broad range of applications and companies. Especially small and medium size companies will profit from manageable DSs, because they cannot afford cumbersome manual configuration, de-
This work is structured as follows: Since the idea of machine learning and deception in network defense is around 30 years old, we first identify recent trends and related work in chapter 2. Investigated machine learning methods as well as their advantages and drawbacks are introduced in chapter 3. In chapter 4 we propose our adaptive deployment framework and discuss important modules. The proposed framework is evaluated in chapter 5. Our work is concluded in chapter 6.
2 Related Work
In strategic defense and attack the idea of deception dates back to the 5th century BC [8]. It was first described from Clifford Stoll as digital strategy [9] in 1990 and first implemented from Lance Spitzer as network defense strategy [10].
2.1 Deception Systems
Modern DSs provide a vast variety of fake resources to deceive intruders. The most popular concept are server side systems. These systems mimic typical server protocols such as FTP, SSH or SMB. Connecting intruders trigger alarms and are under observation while they try to exploit the server. Other concepts are client side systems, which connect to potential malicious servers and observe the servers behavior. This concept is common to investigate web based attacks such as drive by downloads. A more recent concept employs tokens as trigger for alarms. Tokens impersonate documents, credentials or accounts. Stack canaries can be interpreted as token-based DS. Long-term and large scale studies with deception systems enable high quality insight in recent threats and their developments [11][12].
2.2 Deployment Strategies
Except for client-side DSs all need to be implanted in an existing and often fluctuating context. This context can be a IP-based network, a file system or any other architecture to defend. In this work we will focus on IP-based networks. There are two major groups of deployment modes: Research and production. In research mode the DS is directly connected with the Internet. In this mode its main purpose is the collection of threat intelligence, botnet observation and other trends. For non IT security companies this mode is not relevant. The production mode deploys DSs behind the perimeter. DSs in this mode typically have less interaction. However, in this mode any interaction is a strong indicator for perimeter breaches or internal misuse. In the production mode, six basic deployment concepts are prevalent [13][14]: Sacrificial lamb, deception ports on production systems, proximity decoys, redirection shield, minefield, zoo. In table 1 the different concepts are described.
State of the art deployment strategies do not employ automated deployment. Our adaptive framework supports all deployment concepts except for deception ports, since access to the production machines is not natively available. Furthermore, we argue that manipulation of software on production systems is not acceptable for most operators and vendors. This restricts the usage of the deception port concept in industrial scenarios and proprietary systems. We also argue that sacrificial lamb and zoo deployment suffer from lower attraction to intruders and less knowledge about the actual network security state. Both are implications of the deployment in a different subnetwork. Minefield deployment is a good choice to detect intrusions in an early state, but if an intruder circumvents the minefield there are no more defense in depth mechanisms. We focus on proximity decoys, since we think it is the most promising deployment concept for defense in depth strategies. Please note that redirection shield is a special case of all other concepts, where the DSs hardware is not located in the internal network, but the malicious traffic is tunneled out to an external environment.
2.3 Artificial Intelligence for Deception based Network Security
Artificial intelligence enables context-awareness. In network security this is crucial, since modern networks are heterogeneous and entities within the network can often change. To adapt DSs in these scenario several researches have been conducted. These researches can be classified in two major domains: Interaction and Deployment. Context-aware interaction focuses on decision making for DSs [15][16][17]. The adaptive deployment domain is in an early stage compared to the first usage of DSs. However, this domain decreases the probability for being fingerprinted by adapting to other entities in the network and also increases the intrusion detection probability by optimizing the ratio between DSs and production systems within a network. Conducted works are learning mechanisms of new unknown services and protocols [18], context-awareness for DSs [19] and automated configuration [20]. An overview of conducted research is given by Zakaria [21][22].
3 Unsupervised Machine Learning
The data acquired from our framework is not labeled. Even the number of clusters is unknown. To determine the optimal DSs deployment, we employ unsupervised machine learning methods to identify clusters and derive deployment prototypes. In this chapter we introduce and investigate several methods we identified as promising. These methods are later employed in our framework.
Table 1: Deployment concepts for DSs in internal networks
| Concept | Description |
| Sacrificial lamb | Single deployment isolated from any production systems |
| Deception ports on production systems | Deployment on the production system |
| Proximity decoys | Deployment near the production systems |
| Redirection shield | Redirection of certain traffic outside the internal network |
| Minefield | Deployment of a vast amount of DSs near the perimeter |
| Zoo | Deployment of a vast and versatile amount of DSs isolated from any production system |
3.1 Methods and Algorithms
We investigated three different clustering algorithms. All three are assigned to a different class of cluster algorithms. First is the centroid based k-medoids method [23]. In difference to the well known kmeans algorithm, k-medoids always sets an entity from within a cluster as centroid. This centroid is called medoid. As given in (1), we define the JaccardTanimoto metric [24] as distance measurement:
x y x y
d(x,y) = (1)
x ∪ y
where x and y are either a feature set of an observation or a feature set of an aggregation of observations. We employ this distance measurement as reference for all further investigations in this paper. There are, however, several distance measurements that are also feasible such as the Manhattan, Euclidean, Simpson, Dice and Mahalanobis distance [25]. The definition of the k-medoids method is given in (2):
k
X
argmax |Si|V arSi (2)
S i=1
where k is the number of clusters and S =
S1,S2,…,Sk the sets of all observations.
Our evaluation is based on the partition around medoids (PAM) [23] implementation. PAM is a heuristic method, employed to circumvent the NP-hardness of k-medoids.
Second is the connectivity based single linkage clustering [26]. We also chose the Jaccard-Tanimoto distance as distance measurement to ensure comparability. The single linkage method is an agglomerative hierarchical clustering method. All observations are considered as cluster and then merged into an agglomeration of clusters based on the distance between the clusters. The distance is calculated by a linkage function, which is given in (3) for the single linkage method
D(Si,Sj) = min d(u,v) (3)
u∈Si,v∈Sj
where D is the linkage function, Si and Sj are subsets of S, u is a observation in cluster Si and v a observation in cluster Sj. In our experiments we found that more complex linkage functions such as WPGMA, UPGMA and WPGMC do not significantly improve the results of our application. We used the SLINK implementation [27] to decrease the time complexity from O(n2log(n)) to O(n2).
Finally, we evaluated the density based spatial clustering of applications with noise (DBSCAN) method [28]. DBSCAN defines a distance measurement d(x,y) and a minimal number of observations minP ts that need to be in a certain distance of a given observation x to consider the observation x as part of the cluster. If a observation x is within the distance of less than minP ts observations, it is considered as cluster edge and is part of the cluster. The
Jaccard-Tanimoto metric is employed as d(x,y).
All three methods imply different advantages and disadvantages. A comparison is given in table 2.
It can be seen that the optimal algorithm depends on the application. Determining a suitable method requires an understanding of the data set. In our application it is not possible to assume a certain distribution of systems within a network. The diversity of clusters and the occurrence of outliers depend on the network architecture.
3.2 Convergence Criteria
The introduced algorithms require a proper parametrization to ensure reasonable results. Even methods that need no predetermination of k need parameters to calculate k.
We employed three methods to estimate the convergence criteria: The Elbow method, the GAP method and the Silhouette coefficient. An increasing number of clusters decrease the mean squared error (MSE). The MSE is defined as follows:
k
X X 2
u − µi (4) i=1 u∈Si
where k is the number of clusters, u an observation in cluster Si and µi the mean value of Si. The elbow method [29] investigates, if further incrementation of the number of clusters do significantly decrease the MSE. If the decrease is not significant, the optimal number of clusters is found. The GAP method [30] is based on the elbow method, but instead of ∆MSE∆k , the maximal difference between the MSE of the elbow function and the MSE of randomly distributed observations indicates the optimal number of clusters. A widely employed method to determine the number of clusters in machine learning applications is the silhouette coefficient [31]. The definition is given in (5).
Table 2: Comparison of different clustering algorithms
| Feature | k-medoids | Single linkage | DBSCAN |
| Class | Centroid | Connection | Density |
| Predetermined k | Yes | No | No |
| Outliers | – | + | + |
| Efficiency | PAM: O(k(n−k)2) | SLINK: O(n2) | O(nlog(n)) |
| Divers clusters | – | 0 | + |
| Deterministic | No | Yes | No |
0 for dist(Si,u) = 0
sj = maxdist{dist(Sv(,uSi),u−dist),dist(S(iS,uv,u) )} else (5)
The distance measure for the silhouette method based on (1). For the distance between an observation and a cluster, the mean value of the cluster is employed as defined in (6) and (7).
1 X
| dist(Si,u) = |Si| x∈Si d(x,u) | (6) |
|
1 X dist(Sj,u) = min |Sx| y∈Sy d(y,u) Sy,Si |
(7) |
The distance between Sj and u is the difference as defined in (1) to the nearest cluster Sy ∈ S. For an evaluation we will employ the three introduced convergence criteria.
4 Adaptive Deployment Framework
We developed an adaptive deployment framework consisting of a data acquisition engine (DAE), a clustering engine (CE) and a deployment engine (DE). A specific data format was also developed. In this chapter we describe our framework and the single components. The adaptive deployment consists of four consecutive processes: Context perception, context evaluation, configuration and deployment. In the first step the DAE collects context information such as other hosts. The acquired data is then stored in our data format. Based on this data, the CE statistically analyzes the stored data and determines k prototypes P . These prototypes P are DSs that are mind(P ,Si). The configuration process depends on the DE. In general, however, the required configuration file is generated in this process. Finally, the DE deploys the DSs based on the configuration file. The overall process of adaptive deployment is restartable at any time. This enables a fast adaption to changing architectures and contexts. The process is shown in Figure 1.
4.1 Data Acquisition Engine
The DAE captures the context and stores it in a defined data format. In our implementation we define the other hosts in the same subnetwork as context.
To capture as much information as possible about the context, the DAE combines passive information gathering by p0f [32] and active information gathering by nmap [33] and xprobe [34]. For each host in the subnetwork the information sources decide by vote for an operating system. The services available from a host are determined by nmap.
4.2 Data Format
The data format we developed is based on the Extensible Markup Language (XML). First an unique identifier (ID) is generated for each host. These IDs are associated with features. There are three major sections: meta data, services and operating system. The first section contains available meta data such as up time, MAC address, IP address and a time stamp. In the second section open TCP and UDP ports are listed. We map port numbers directly to services. This is efficient and produces sufficiently reliable results. In the third section we store information about the TCP stack based fingerprint. This information is extracted from the nmap and xprobe scan.
4.3 Clustering Engine
In the CE the prototypes for the deployment are generated. These prototypes need to contain all information that is needed for a sufficient deployment. In our implementation we employ the same data format for context information and prototypes. The CE determines k clusters containing Si hosts. The TCP stack and the available services for each P are equal to the medoid in Si. However, meta information is generated on distributions within Si. For example the MAC address: The first three octetes are extracted from the most prevalent vendor within Si and the other three are chosen randomly. For the IP address we developed an algorithm to reduce impact on the distribution in subnetworks. First a random IP within the cluster is chosen then the upwards next unoccupied IP address is assigned to the prototype. By the use of this algorithm the distribution within the cluster remains the same, since a specific probability distribution is preserved if only uniformly distributed observations are added on the existing observations. Please note that IP addresses are only assigned to one host at the same time and therefore the distribution is not perfectly preserved. Uptimes for prototypes are determined based on the mean uptime within a cluster.
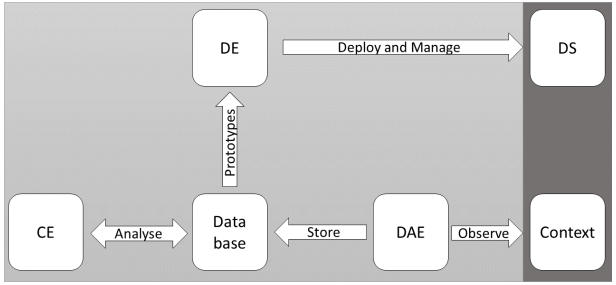 Figure 1: Overall process of the adaptive deployment framework Figure 1: Overall process of the adaptive deployment framework |
4.4 Deployment Engine
In a last step the actual deployment is executed. This step is most crucial to all previous steps. The required information for a proper configuration needs to be calculated or assumed. In our implementation we employ honeyd [35] as DE. honeyd is able to emulate a vast amount of hosts with TCP stack and offers the ability to open TCP and UDP ports as well as the execution of scripts to emulate services on the open ports. If it is needed honeyd is also able to emulate large network architectures including network elements such as routers, switches and tunnels [36].
5 Evaluation
In the evaluation chapter two different settings are investigated. First, an artificial scenario is evaluated. This scenario consists of several virtual machines (VMs) in an isolated network. The second scenario is an actual production network in which we deploy DSs by our framework.
5.1 Artificial Data Sets
As shown in table 3 eight different VMs are prepared for the simulation of a production network: Windows 10, Windows 7, Ubuntu 17.04, Ubuntu 12.04, Debian 8.8.0, Fedora 25, openSUSE 42.2 and Android 4.3. Two scenarios are defined in this evaluation. The first scenario mimics a network with equally distributed cluster sizes. In the second scenario the cluster sizes are different. We chose these diverse settings to not favor a specific algorithm. The deployment is realized with Virtualbox.
5.2 Real World Scenario
For scenario 3 we scanned a class C development network. The network consists of: 7 Windows 10 machines, 4 Ubuntu machines, 2 TP Link switches, 2 Cisco switches, 11 Raspberry Pis, 1 Android system and 4 other Unix systems. Unlike in the artificial scenarios the configurations of the systems are different.
5.3 Results
First we evaluated the determination of the number of clusters. In Figure 2 the comparison of combinations of different methods in scenario 1 is shown.
As it can be seen for the elbow method and the silhouette coefficient all three algorithms perform similarly. However, for GAP there are differences. We found that DBSCAN is not suitable when using GAP. Please note, that the determined number of clusters is six in this scenario for all algorithms. This is because Ubuntu 12.04 and Ubuntu 17.04 as well as Windows 7 and Windows 10 have closely resembling TCP-Stack implementations and similar open ports in the default configuration, reducing the number of clusters from eight to six. In Figure 3 we compare the same algorithms for scenario 2.
For DBSCAN the elbow method does not give a feasible result. The GAP method results only for SLINK in suitable results. PAM as well as DBSCAN result in a number of clusters of four. The silhouette coefficient only results in suitable values for the PAM. Figure 4 compares the results for the development network.
DBSCAN is not feasible with any convergence criteria in this scenario. This fits in our overall evaluation. However, it is recommend to estimate not on the number of cluster, but on the k-distance graph for DBSCAN. By doing so the results are probably better.
PAM and SLINK both result in reliable values for the
Table 3: Definition of the investigated scenarios
| Scenario 1 | Scenario 2 | |
| Windows 10 | 3 | 10 |
| Windows 7 | 3 | 5 |
| Ubuntu 12.04 | 3 | 0 |
| Ubuntu 17.04 | 3 | 4 |
| Debian | 3 | 2 |
| Fedora | 3 | 1 |
| openSUSE | 3 | 1 |
| Android | 3 | 5 |
| Scenario 1 | Scenario 2 | ||||||
| Elbow Method | GAP | Silhouette | Elbow Method | GAP | Silhouette | Mean | |
| SLINK | 0.25 | 0.25 | 0.5 | 0.25 | 0.25 | 0.25 | 0.29 |
| PAM | 0.25 | 0.25 | 0.13 | 0.25 | 0.5 | 0.25 | 0.27 |
| DBSCAN | 0.25 | 0.75 | 0.38 | 0.25 | 0.5 | 0.5 | 0.44 |
| Mean | 0.25 | 0.42 | 0.33 | 0.25 | 0.42 | 0.33 | |
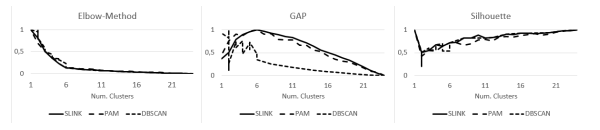 Figure 2: Evaluation of algorithms to estimate the number of clusters in Scenario 1
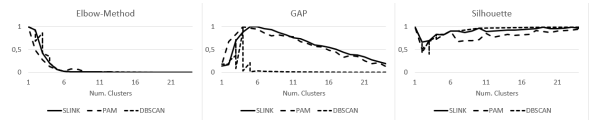 Figure 3: Evaluation of algorithms to estimate the number of clusters in Scenario 2
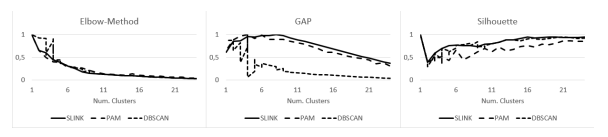 Figure 4: Evaluation of algorithms to estimate the number of clusters in Scenario 3
Table 4: Relative error for the estimation of the number of clusters
Table 5: Relative error for the estimation of the entities within the clusters in scenario 1
| C1 | C2 | C3 | C4 | C5 | C6 | C7 | C8 | Mean | |
| SLINK | 0.33 | 1.00 | 1.00 | 0.00 | 1.00 | 0.33 | 1.00 | 0.00 | 0.58 |
| PAM | 0.67 | 1.00 | 1.00 | 1.00 | 1.00 | 0.50 | 1.00 | 0.00 | 0.77 |
| DBSCAN | 0.33 | 1.00 | 1.00 | 0.00 | 1.00 | 0.33 | 1.00 | 0.00 | 0.58 |
Table 6: Relative error for the estimation of the entities within the clusters in scenario 2
| C1 | C2 | C3 | C4 | C5 | C6 | C7 | Mean | |
| SLINK | 1.00 | 1.00 | 1.00 | 1.00 | 1.00 | 1.00 | 1.00 | 1.00 |
| PAM | 1.00 | 1.00 | 0.67 | 1.00 | 0.00 | 0.00 | 0.80 | 0.64 |
| DBSCAN | 1.00 | 1.00 | 1.00 | 1.00 | 1.00 | 1.00 | 1.00 | 1.00 |
elbow method and the silhouette coefficient. The overall performance evaluation is given in Table 4.
Comparing the algorithms the best results are achieved for the SLINK implementation. For the convergence criteria the elbow method appears to provide the best results. However, the elbow method requires an additional criterion for the detection of the elbow. Formally a criterion detecting significant changes for ∆MSE∆k is required. These criteria tend to be unreliable [37]. For the silhouette coefficient it is also difficult to detect a reliable number of clusters. This is because the local maximum before a monotonic increase determines the optimal number of clusters and this maximum can be ambiguous, as shown in Figure
Besides the optimal number of clusters the clustering results are of importance for the adaptive deployment. In scenario 1 eight clusters are existing, all with the same size. In Table 5 the clustering results are evaluated. As similarity measurement we employ the Jaccard index.
In scenario 1 PAM performed best. This is as expected since a particular strength of centroid based clustering algorithms are equally sized clusters. However, in networks an equal distribution of hard- and software cannot be assumed. To evaluate also heterogeneous environments, scenario 2 features an unequal distribution of systems.
It can be seen, that SLINK and DBSCAN outperform PAM clearly. This result was expected since connection and density based algorithms are better suited for unequal sized clusters. The obtained results in our experiment suggest, that SLINK in combination with the elbow method or GAP produce the best results. However, since we did not compare SLINK with other connection based clustering algorithms, it is possible that other algorithms outperform the single linkage algorithm. The proposed method of an adaption of the DS to the context by observing and scanning the network and determining prevalent systems to mimic is possible by an employment of the investigated methods.
6 Conclusion and Discussion
In this work the authors proposed an adaptive framework for the deployment of deception systems for cyber defense. The proposed framework is implemented for an evaluation. Different algorithms and convergence criteria are evaluated in different aspects such as computational time, determination of the number of clusters and the cluster accuracy. The focus of the implementation are server-side deception systems. However, the framework can easily be extended to feature also token based deception systems. We found that SLINK provides the best results. Even though the lowest error was achieved for the elbow convergence criteria, we recommend to consider GAP in this application because of its robustness and the simple determination of the global maximum. The adaptive deployment framework enables deception based security mechanisms for a broad range of users and a significant decrease in configuration, deployment and maintenance effort of such systems. It provides an enhanced security concept in a simple to use solution.
Conflict of Interest The authors declare no conflict of interest.
Acknowledgment This work has been supported by the Federal Ministry of Education and Research of the Federal Republic of Germany (Foerderkennzeichen KIS4ITS0001, IUNO). The authors alone are responsible for the content of the paper.
- Federal Bureau of Investigation. Internet crime report 2015. 2015.
- Europol. Internet organized crime threat assessment. 2016.
- Bundesamt fur Sicherheit in der Informationstechnik. Die Lage der IT-Sicherheit in Deutschland 2015. 2015.
- M. Guri, G. Kedman, A. Kachlon, and Y. Elovici. Airhopper: Bridging the air-gap between isolated networks and mobile phones using radio frequencies. International Conference on Malicious and Unwanted Software, 9, 2014.
- L. Spitzner. Dynamic honeypots. 2003.
- D. Fraunholz, F. Pohl, and H. Schotten. Towards basic design principles for high- and medium-interaction honeypots. European Conference on Cyber Warfare and Security, 16, 2017.
- R. Grimes. Honeypots for Windows: Configure and Manage Windows Honeypots. 2005.
- Sun-tzu and S. Griffith. The Art of War. 1964.
- C. Stoll. The cuckoo’s egg: Tracking a spy through the maze of computer espionage. 1990.
- L. Spitzner. Honeypots: catching the insider threat. Annual Computer Security Applications Conference, 19:170–179, 2003.
- D. Fraunholz, M. Zimmermann, S. Duque Anton, S. Schneider, and H. Schotten. Distributed and highly-scalable wan net- work attack sensing and sophisticated analysing framework based on honeypot technology. International Conference on Cloud Computing, Data Science & Engineering, 7, 2017.
- D. Fraunholz, D. Krohmer, S. Duque Anton, and H. Schotten. Investigation of cyber crime conducted by abusing weak or default passwords with a medium interaction honeypot. International Conference On Cyber Security And Protection Of Digital Services, 2017.
- D. Moran. Trapping and tracking hackers: Collective security for survival in the internet age. Information Survivability Workshop, 3, 2000.
- B. Scottberg, W. Yurcik, and D. Doss. Internet honeypots: Protection or entrapment? 2003.
- G. Wagener, R. State, A. Dulaunoy, and T. Engel. Heliza: talking dirty to the attackers. Computer Virology, 2010.
- G. Wagener. Self-Adaptive Honeypots Coercing and Assessing Attacker Behaviour. PhD thesis, Universite du Luxembourg, 2011.
- G. Wagener, R. State, T. Engel, and A. Dulaunoy. Adaptive and self-configurable honeypots. IFIP/IEEE International Symposium on Integrated Network Management, 12:345–352, 2011.
- V. Chowdhary, A. Tongaonkar, and T. Chiueh. Towards automatic learning of valid services for honeypots. International Conference Distributed Computing and Internet Technology, 1.
- C. Hecker, K. Nance, and B. Hay. Dynamic honeypot construction. Colloqium for Inforation Systems Security Education, 10:95–102, 2006.
- C. Leita, K. Mermoud, and M. Dacier. Scriptgen: an automated script generation tool for honeyd. Annual Computer Security Applications Conference, 21, 2005.
- W. Zakaria and L. Kiah. A review on artificial intelligence techniques for developing intelligent honeypot. 2012.
- W. Zakaria and L. Kiah. A review of dynamic and intelligent honeypots. ScienceAsia, 2013.
- L. Kaufmann and Rousseeuwm R. Clustering by means of medoids. 1987.
- P. Jaccard. Etude comparative de la distribution florale dans une portion des alpes et des jura. Bulletin de la Societe Vaudoise des Sciences Naturelles, 37(547-579), 1901.
- P. Mahalanobis. On the generalised distance in statistics. Proceedings of the National Institute of Science of India, pages 49– 55, 1936.
- J. Gower and G. Ross. Minimum spanning trees and single linkage cluster analysis. Journal of the Royal Statistical Society, pages 54–64, 1969.
- R. Sibson. Slink: an optimally efficient algorithm for the single-link cluster method. The Computer Journal, pages 30– 34, 1973.
- M. Ester, H. Kriegel, J. Sander, and X. Xu. A density-based algorithm for discovering clusters in large spatial databases with noise. International Conference on Knowledge Discovery and Data Mining, 2, 1996.
- R. Thorndike. Who belongs in the family? Psychometrika, 18:267–276, 1953.
- R. Tibshirani, Waltherm G., and T. Hastie. Estimating the number of clusters in a dataset via the gap statistic. 2000.
- P. Rousseuw. Silhouettes: a graphical aid to the interpretation and validation of cluster analysis. Computational and Applied Mathematics, pages 53–65, 1987.
- M. Zalewski. p0f v3: Passive fingerprinter. 2012.
- F. Vaskovich. The art of port scanning. Phrack Magazine, 7, 1997.
- A. Ofir and F. Yarochkin. Xprobe2 – a fuzzy approach to remote active operating system fingerprinting. 2003.
- N. Provos. Honeyd: A virtual honeypot daemon. DFN-CERT Workshop, 10, 2003.
- R. Chandran and S. Pakala. Simulating networks with honeyd. 2003.
- D. Fraunholz, M. Zimmermann, and H. Schotten. An adaptive honeypot configuration, deployment and maintenance strategy. International Conference on Advanced Communication Technology, 19, 2017.