Medical imbalanced data classification
Medical imbalanced data classification
Volume 2, Issue 3, Page No 116-124, 2017
Author’s Name: Sara Belaroucia), Mohammed Amine Chikh
View Affiliations
Biomedical Engineering Laboratory, Department of Biomedical Engineering, Tlemcen University, 13000, Algeria
a)Author to whom correspondence should be addressed. E-mail: belaroucisara@gmail.com
Adv. Sci. Technol. Eng. Syst. J. 2(3), 116-124 (2017); ![]() DOI: 10.25046/aj020316
DOI: 10.25046/aj020316
Keywords: Multilayer neural networks, k- nearest neighbor, Support vector machine, Imbalanced medical database, Least Mean Square algorithm

Export Citations
In general, the imbalanced dataset is a problem often found in health applications. In medical data classification, we often face the imbalanced number of data samples where at least one of the classes constitutes only a very small minority of the data. In the same time, it represent a difficult problem in most of machine learning algorithms. There have been many works dealing with classification of imbalanced dataset. In this paper, we proposed a learning method based on a cost sensitive extension of Least Mean Square (LMS) algorithm that penalizes errors of different samples with different weights and some rules of thumb to determine those weights. After the balancing phase, we apply the different techniques (Support Vector Machine [SVM], K- Nearest Neighbor [K-NN] and Multilayer perceptron [MLP]) for the balanced datasets. We have also compared the obtained results before and after balancing method. We have obtained best results compared to literature with a classification accuracy of 100%.
Received: 19 March 2017, Accepted: 04 April 2017, Published Online: 15 April 2017
1. Introduction
Learning algorithms from imbalanced data has attracted a significant amount of interest in recent years. This is because in real world, imbalanced data exist in many applications, such as fault diagnosis [1], medical diagnosis [2], intrusion detection [3,4], text classification [5,6], financial fraud detection [7], data stream classification [8], and soon. In those applications, there are often one or some minority classes possessing very few samples compared with the other classes. And most of time, the “small” classes are more important than those “large” ones. Because of the unbalance data distribution of imbalanced learning problems, it is often difficult to obtain good performance for most cases by using traditional classifiers where a balanced distribution of classes is assumed and an equal misclassification cost for each class is assigned. As a result, traditional classifiers tend to be overwhelmed by the majority classes and ignore the minority ones, which is not acceptable in many real applications [9, 10].
Most previous works focused on the binary classification problems [11]. The others [12, 13] also tried to employ the multi-class data and define the class with a small number of data as the minority class while the other data are merged in to the majority class. Al though the minority class can be recognized by classifiers, the artificial majority class might be more likely to be misclassified. The knowledge of imbalanced data is complex especially when we solve the multi-class problems, since the amounts of some data classes are the same or similar to each other, which increases the difficulty to artificially select the minority class. The imbalanced learning problems can be summarized as two categories: absolute imbalance and relative imbalance [14]. The absolute imbalance occurs in the situation when the minority instances are significantly scarce and implicit, whereas the dataset with relative imbalance can show explicit data distribution but still rare quantity for minority examples. The characteristic of rare instances exists in the typical imbalance where the limited representative data lead to difficult learning regard less of between class imbalances. The other form of imbalance is within-class imbalance. It concentrates on the representative data distribution for the sub- concepts with in a class. The within-class imbalance problem seems to be more difficult than the datasets with the concepts in a similar characteristic [15, 16].
The works to be cited in Section 2 clearly show that most techniques cited in the literature were not able to find the best effective ways to address minority data.
In this paper, the learning method based on a cost-sensitive extension of Least Mean Square (LMS) algorithm is proposed to solve the imbalanced learning problems, and that penalizes errors of different samples with different weights, which increase the classification rate. In order to validate our empirical study, we have chosen three different algorithms from different paradigms of data mining, including Multilayer Perceptron (MLP), Support Vector Machines (SVMs) and the K-Nearest Neighbour (K-NN) as an Instance-Based Learning approach. We have also compared the results obtained before and after balancing the different datasets by the adopted LMS.
The rest of the paper is organized as follows. State of Art is presented in Section 2, it reviews several techniques applied for problems with imbalanced datasets. Next, section 3 presents the different techniques (MLP, SVM and K-NN) and our proposed method (LMS). In Section 4, the experimental work is presented also the obtained results are discussed and compared to other works in literature. Finally, Section 5 concerns conclusions and outlines possible directions for future research.
2. State of art
A variety of solutions has been proposed to address the imbalanced learning. To understand this issue comprehensively, most of the state of the art methods are generalized as the following categories. A critical and comprehensive survey on imbalanced learning can be found in [17].
Random oversampling for minority instances and under sampling for majority instances can facilitate change of the distribution for original dataset [18]. The data formed under sampling using K- Nearest Neighbor (K-NN) [19] is also presented. To overcome the disadvantages of the basic sampling methods, Such as, risk of overfitting for oversampling approach and risk of a loss of information for undersampling method, the Synthetic Minority Oversampling Technique (SMOTE) [20] is used. It selects one from the nearest neighbors for each original minority example, and generate synthetic minority data, based on the linear interpolations between the original examples and randomly selected nearest neighbors. Borderline Synthetic Minority Oversampling Technique (Borderline-SMOTE) [21] generates only synthetic data for the minority instances near the border rather than every original minority instance. Adaptive Synthetic (ADASYN) [22] is proposed to adaptively create the different quantities of synthetic data corresponding to the density distribution. Parallel Selective Sampling (PSS) technique [23] is proposed to select data from the majority class to reduce imbalance in large datasets. The PSS is a filter method, which can be combined with the Support Vector Machine (SVM) classification. The PSS-SVM showed excellent performances on synthetic datasets, much better than SVM. Other sampling strategies are integrated with ensemble learning techniques [24, 25] to address the imbalanced learning issue. The Synthetic Minority Oversampling Technique in boosting (SMOTEBoost) [26] algorithm is achieved via combining SMOTE with Adaboost.M2 (Adaptive Boosting.M.2.). Ranked Minority Oversampling in boosting (RAMOBoost) [27] adjusts the sampling weights of minority class examples based on the data distributions [16]. Other weighting approaches are proposed to overcome the problem of imbalanced datasets. The Least Mean Square (LMS) [28] algorithm is proposed to penalise errors of different samples with different weights and some rules of thumb to determine those weights. After the balancing phase, different classifiers (Support Vector Machine [SVM], K-Nearest Neighbour [K-NN] and Multilayer Perceptron [MLP]) are applied for the new balanced dataset. In addition, the results obtained by the LMS method are compared with the results obtained by the sampling methods (Under-sampling, Oversampling and SMOTE). Other local strategies are proposed to address the within-class imbalance issue of positive data sparsity, by directly adjusting the induction bias of specificity-oriented learning algorithms. The k Rare-class Nearest Neighbour (KRNN) algorithm [29] is proposed, where dynamic local query neighbourhoods are formed that contain at least k positive nearest neighbours and the positive posterior probability estimation is biased towards the rare class based on the size and positive distribution in local regions.
The goal of cost-sensitive learning [30- 33] is to calculate the costs for misclassification through different cost matrices. The Adaptive Cost sensitive boosting (AdaCost) [34] adopts the cost-sensitive learning with boosting. Cost-sensitive decision tree [35] can prune the scheme for imbalanced data with misclassification costs through specifying decision threshold. Cost-sensitive neural network models [36, 37] are also widely applied for imbalanced learning [16].
The kernel-based learning approaches include many state-of-the-art techniques for the application of data mining domain [38- 41]. A Granular Support Vector Machines-Repetitive Undersampling (GSVM-RU) algorithm [42] carries out the iterative learning procedure based on GSVM. Kernel-Boundary Alignment (KBA) [43] is proposed to modify the kernel matrix via a kernel function based on the distribution of imbalanced data. There is another typical kernel-based learning algorithm for maximizing Area Under Curve (AUC) of the Receiver Operating Characteristic (ROC) graph [16, 44].
The active learning methods [45- 47] are traditionally adopted to handle the special issues relevant to training data without class labels (unlabeled data). As mentioned in [48], the criteria of termination for active learning methods are investigated to apply for the class imbalance issues on Word Sense Disambiguation (WSD) through maximal confidence and minimal error [16].
3. Materials and Methods
A brief description of the used algorithms is reported below:
3.1. Classification techniques used
In this work, we have used a K-Nearest Neighbor (K-NN) as a statistical machine, a Support Vector Machine (SVM) as a kernel machine, and a Multi-Layer Perceptron (MLP) as a neural network. Brief descriptions of these algorithms are already reported in literature [49].
3.2. Least Mean Square algorithm
The Least Mean Square (LMS) algorithm which is also called the stochastic gradient algorithm is relatively easy to implement and is based on a simple concept, it was introduced by Widrow and Hoff in 1960 [50].
The LMS algorithm is an adaptive algorithm, which uses a gradient-based method of steepest decent. LMS algorithm uses the estimates of the gradient vector from the available data. LMS incorporates an iterative procedure that makes successive corrections to the weight vector in the direction of the negative of the gradient vector, which eventually leads to the minimum mean square error.
Compared to other algorithms LMS algorithm is relatively simple; it does not require correlation function calculation nor does it require matrix inversions [51].
In the LMS algorithm, the squares of mean quadratic errors are minimized by solving a system of linear equations. In this paper, to remedy the problem of the learning of the imbalanced dataset, we used a cost-sensitive extension of Least Mean Square algorithm that penalizes errors of different samples with different weights.
LMS algorithm formulation
We are given a training set which consists of independent identically distributed samples which is described by [50- 53]: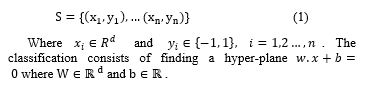
The solution for the least mean square algorithm classification can be found by solving the following constrained minimization problem:![]()
The LMS algorithm is probably the most popular adaptive algorithm that exists because of its simplicity.
From the method of steepest descent, the weight vector equation is given by:![]()
Where μ is the step-size parameter and controls the convergence characteristics of the LMS algorithm; is the mean square error between the beam former output and the reference vector which is given by,![]()
The gradient vector in the above weight update equation can be computed as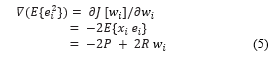
In the method of steepest descent, the biggest problem is the computation involved in finding the values P and R matrices in real time. The LMS algorithm on the other hand simplifies this by using the instantaneous values of covariance matrices P and R instead of their actual values i.e.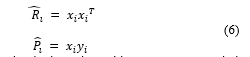
These are simply the estimated instantaneous correlations.
Therefore, the weight update can be given by the following equation,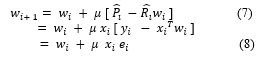
Note that is a random variable [since each new iteration i, depends random processes of .
Therefore, the LMS algorithm can be summarized in following equations [53]: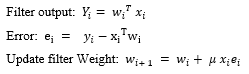
The LMS algorithm is initiated with an arbitrary value for the weight vector at . The successive corrections of the weight vector eventually leads to the minimum value of the mean squared error.
μ is the step-size parameter and controls the convergence characteristics of the LMS algorithm :
- If μ is chosen to be very small then the algorithm converges very slowly.
- A large value of μ may lead to a faster convergence but may be less stable around the minimum value.
The LMS algorithm is very simple: it requires only 2L + 1 multiplications and 2L additions by iteration, where L is the number of filter coefficients.
4. Results and discussions
4.1. Medical datasets
We have used five medical datasets from UCI database [54]. In order to validate the proposed methods on each one, we chose a subset of these datasets providing a heterogeneous test bench. These five datasets are Pima Indian Diabetes, Wisconsin Breast Cancer (WBC), Wisconsin Diagnostic Breast Cancer (WDBC), Liver disorder and Appendicitis. The main characteristics of these datasets are depicted in Table 1.
Table 1. Characteristics of the medical datasets.
| Dataset | Classes | Attributes | Instances | Min. class | Maj. class |
| Pima | 2 | 8 | 768 | 268 | 500 |
| WBC | 2 | 9 | 683 | 137 | 546 |
| WDBC | 2 | 31 | 569 | 212 | 357 |
| Liver disorder | 2 | 6 | 345 | 145 | 200 |
| Appendicitis | 2 | 7 | 106 | 21 | 85 |
4.2. Employed classifiers
In this subsection, we describe how we adjust some parameters of these techniques and how we estimate the classification reliabilities.
The K-NN algorithm requires no specific set-up. We test values of k and we choose the value providing the best performances on a validation set according to a fivefold cross validation. We estimate the reliability of each classification act on the basis of information directly derived from the output of the expert and analyzing also the reasons in the feature space giving rise to unreliable classification. For further details, we may refer to [49, 55].
We test a SVM algorithm with a Gaussian radial basis kernel. Values of regularization parameter C and scaling factor σ are selected within intervals and , adopting a log scale to sample the two intervals. The value of each parameter is tuned using a fivefold cross-validation on a validation set. The reliability of a SVM classification is estimated as proposed in [56], where the decision value of the classifier is transformed in a posterior probability [49].
We use a MLP algorithm with a number of hidden layers equal to half of the sum of features number plus class number. The number of neurons in the input layer is fixed by the number of the features whereas we chose two neurons in the output layer. The reliability is a function of the values provided by neurons in the output layer [49, 55].
4.3. Statistical metrics
To assess the predictive ability of constructed models, five statistical evaluation methods were employed and they are defined as follows:
1) The correct classification rate (CC %): is the recognition rate;
![]() (9)
(9)
Where true positives (TP) denote the correct classifications of positive samples; true negatives (TN) denote the correct classifications of negative samples; false positives (FP) denote the incorrect classifications of negative samples into the positive samples; and false negatives (FN) denote the positive samples incorrectly classified into the negative samples.
2) Error rate (E %):
![]() (10)
(10)
3) Sensitivity (SE %): the percentage of positive samples which are correctly classified;
![]() (11)
(11)
4) Specificity (SP %): the percentage of negative samples which are correctly classified;
![]() (12)
(12)
5) Gmean (%): It provides a simple way to evaluate the model’s ability to correctly classify the minority and majority class by the combination of Sensitivity and Specificity into a single metric. Gmean is considered as a measure of the balanced accuracy and is defined as:
![]() (13)
(13)
4.4. Statistical performance of different classifiers combined with LMS
In order to validate the influence of LMS on the different classifiers (MLP, SVM, K-NN), it is interesting to compare the performances of MLP, SVM and K-NN techniques in the two cases (with and without LMS). However, selecting objective statistical metrics are used to estimate the performance of different classifiers. Indeed, for the imbalanced classification problem, the overall classification accuracy is often not an appropriate measure of performance given that a trivial classifier that predicts every sample as the majority class could achieve very high accuracy in extremely skewed domains. In the present work, instead of the complicated metrics, five intuitive and practical measures (correct classification rate, error rate, Sensitivity, Specificity and Gmean) were adopted to estimate the current classifiers based on the following reasons: first, both Sensitivity and Specificity provide a class-by-class performance estimate, making one easily investigation on the predictive ability of a classification method for each sample class, especially the predictive ability for the interesting minority classes; second, Gmean is a combination of both Sensitivity and Specificity, which indicates the balance between classification performance on the majority and minority classes. A poor performance in prediction of the positive (interesting) samples still leads to a low Gmean value, even if the negative samples are classified with high accuracy, which is a common case for imbalanced dataset. The comparative study results are summarized in table 2.
The classification of the different imbalanced databases used in this work involves four steps:
- Step 1: application of the different techniques (SVM, K-NN and MLP) on imbalanced data.
- Step 2: application of the LMS algorithm to remedy the imbalance of data.
- Step 3: application of the different techniques (SVM, K-NN and MLP) on obtained balanced data.
- Step 4: comparison between results obtain successively in first and second step.
We notice from these experiments that the classification performances (CC, SE, SP, and Gmean) increase after balancing databases by using the least mean square algorithm.
We remark that before balancing the different datasets, the minority class is hardly recognized by the different classifiers (MLP, SVM and K-NN). However, after balancing these imbalanced databases, the performance is improved significantly with the employment of LMS algorithm as illustrated in table 4; by increasing the Sensitivity, the specificity, the correct classification rate, and the Gmean. Therefore, we have obtained the best classification performances. We can say that the classifiers have a good recognition of the minority classes and the majority classes, since in our experimentations the samples of the minority classes and the majority classes are correctly classified (TP and TN will increase / FN and FP will decrease after balancing).
Behavior of descriptors before and after balancing approach
To validate the influence of LMS on the different techniques (MLP, SVM and K-NN), we compare the values of descriptors before and after balancing. So we take a miss-classified case from the minority class before balancing the different databases (PIMA, WBC, WDBC, liver disorder and Appendicitis); and we apply the LMS algorithm, where each descriptor is weighted by a coefficient, and the same case was correctly classified (see figure1).
We notice also from this figure1 (a) that some descriptors in PIMA dataset remain unchanged (D1, D5, D7) however the rest has changed in a certain percentage which enhance the importance of the attributes. Also in the other used databases (WBC, WDBC, liver disorder and Appendicitis) we have obtained some changes in the different descriptors (figure1 (b), (c), (d), (e)).
Table 2. The obtained performances before and after balancing of the different imbalanced dataset on the testing base
|
Datasets
|
Classifiers |
CC (%) |
E (%) |
SE (%) |
SP (%) |
Gmean (%) |
|
|
PIMA |
MLP Classifier | MLP | 73.85 | 26.15 | 51.28 | 83.52 | 65.44 |
| LMS | 99.24 | 0.76 | 97.44 | 100 | 98.71 | ||
| SVM Classifier | SVM | 83.85 | 16.15 | 87.18 | 82.42 | 84.77 | |
| LMS | 99.23 | 0.76 | 100 | 98.90 | 99.45 | ||
|
K-NN Classifier |
K-NN | 80 | 20 | 61.54 | 87.91 | 73.55 | |
| LMS | 100 | 0 | 100 | 100 | 100 | ||
| WBC | MLP Classifier | MLP | 90.79 | 9.21 | 65.38 | 98.30 | 80.17 |
| LMS | 99.56 | 0.44 | 98.08 | 100 | 99.03 | ||
| SVM Classifier | SVM | 97.81 | 2.19 | 98.08 | 97.73 | 97.90 | |
| LMS | 99.12 | 0.88 | 100 | 98.86 | 99.43 | ||
|
K-NN Classifier |
K-NN | 98.68 | 1.32 | 96.15 | 99.43 | 97.78 | |
| LMS | 100 | 0 | 100 | 100 | 100 | ||
|
WDBC |
MLP Classifier | MLP | 96.32 | 3.68 | 97.73 | 95.89 | 96.81 |
| LMS | 100 | 0 | 100 | 100 | 100 | ||
| SVM Classifier | SVM | 97.37 | 2.63 | 97.73 | 97.26 | 97.49 | |
| LMS | 100 | 0 | 100 | 100 | 100 | ||
|
K-NN Classifier |
K-NN | 96.32 | 3.68 | 97.73 | 95.89 | 96.81 | |
| LMS | 100 | 0 | 100 | 100 | 100 | ||
|
Liver disorder
|
MLP Classifier | MLP | 77.39 | 22.61 | 65.85 | 83.78 | 74.28 |
| LMS | 100 | 0 | 100 | 100 | 100 | ||
| SVM Classifier | SVM | 66.96 | 33.04 | 65.85 | 67.57 | 66.70 | |
| LMS | 100 | 0 | 100 | 100 | 100 | ||
|
K-NN Classifier |
K-NN | 61.74 | 38.26 | 41.46 | 72.97 | 55.00 | |
| LMS | 99.13 | 0.87 | 97.56 | 100 | 98.77 | ||
|
Appendicitis
|
MLP Classifier | MLP | 71.43 | 28.57 | 77.78 | 50.00 | 62.36 |
| LMS | 100 | 0 | 100 | 100 | 100 | ||
| SVM Classifier | SVM | 74.29 | 25.71 | 74.07 | 75.00 | 74.53 | |
| LMS | 100 | 0 | 100 | 100 | 100 | ||
|
K-NN Classifier |
K-NN | 82.86 | 17.14 | 88.89 | 62.50 | 74.54 | |
| LMS | 94.29 | 5.71 | 96.30 | 87.50 | 91.79 | ||
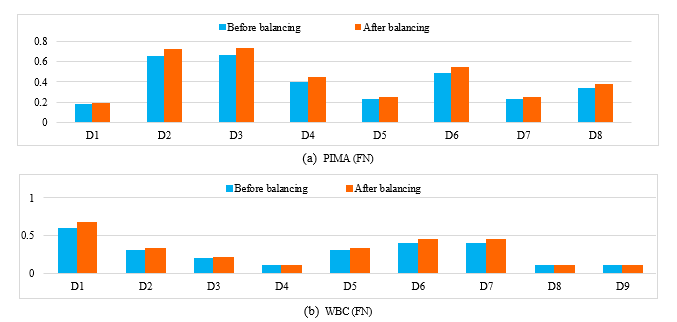
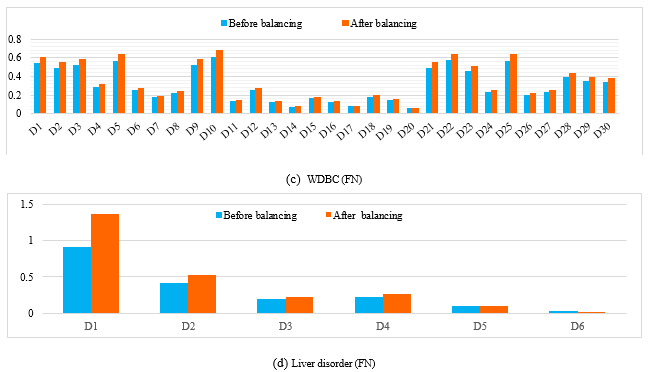
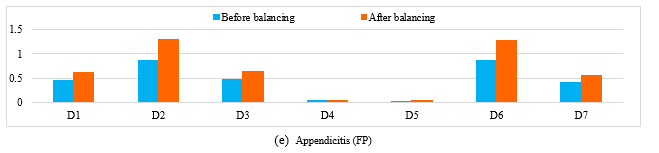
Figure 1. The obtained results before and after balancing the different databases of a miss-classified case from the minority class.
4.5. Comparative study with related works
In this section, we have compared the classification accuracies of our method with other methods applied to the same database:
Works tested on PIMA database
Table 3 gives the classification accuracies of our method and other methods applied on the PIMA database.
Table.3 classification accuracies obtained with our method and other classifiers in literature (PIMA)
| Method | Classification Accuracy (%) |
| GSVM [57] | 74.15 |
| WLTSVM [58] | 76.78 ±0.35 |
|
MLP with LMS SVM with LMS K-NN with LMS |
99.24 99.23 100 |
- Gonzalez-Abril and al. have proposed a new Support Vector Machine method (called GSVM), which is specially designed for bi-classification problems its objective was balanced accuracy between classes [57]. For the evaluation of the results, (L. Gonzalez-Abril and al.) have used many databases (23) and obtained an accuracy of 74.15% for Pima dataset. Y.Shao and al. proposed an efficient Weighted Lagrangian Twin Support Vector Machine (WLTSVM) for the imbalanced data classification, they use different training points for constructing the two proximal hyperplanes [58], they achieve 76.78 ±0.35% of accuracy. In this work, as can be seen from the results (Table. 3), our method (MLP with LMS, SVM with LMS and K-NN with LMS) gave excellent classification accuracy.
Works tested on WBC database
Table 4 gives the classification accuracies of our method and other methods applied on the WBC database.
Table.4 classification accuracies obtained with our method and other classifiers in literature (WBC)
| Method | Classification Accuracy (%) |
| S- AIRS [59] | 96.91 |
| WLTSVM [58] | 96.30±0.31 |
| MLP with LMS | 99.56 |
| SVM with LMS | 99.12 |
| K-NN with LMS | 100 |
Wang and Adrian proposed a hybrid method by combining Synthetic Minority Over-Sampling Technique (SMOTE) and Artificial Immune Recognition System (AIRS) to handle the imbalanced data problem that are prominent in medical data . This approach denoted as S- AIRS [59]. They obtain 96.91% accuracy. Y. Shao and al. proposed WLTSVM [58] and they achieve 96.30± 0.31% of accuracy. In this study, as can be seen from the results (Table. 4), our approach obtain the best classification accuracy with the different classifiers.
Works tested on WDBC database
Table 5 gives the classification accuracies of our method and other methods applied on the WDBC database.
Table.5 classification accuracies obtained with our method and other classifiers in literature (WDBC)
| Method | Classification Accuracy (%) |
| S- AIRS [59] | 96.52 |
| K-NN with resampling [60] | 98.42 |
| MLP with LMS | 100 |
| SVM with LMS | 100 |
| K-NN with LMS | 100 |
Wang and Adrian proposed a hybrid method S- AIRS [59]. Their approach obtained 96.52% accuracy. G. NAGA RAMADEVI and al. applied the five classifiers K-NN, SVM, Logistic Regression, C 4.5 and Random Forest on original four breast cancer datasets with and without resampling technique, they compare the obtained performances before and after resampling datasets [60]. They obtain the best accuracy with 98.42% by using K-NN and resampling method. In this work, as can be seen from the results (Table. 5), our approach obtain the best classification accuracy.
Works tested on Liver disorder database
Table 6 gives the classification accuracies of our method and other methods applied on the Liver disorder database.
Table.6 classification accuracies obtained with our method and other classifiers in literature (Liver disorder)
| Method | Classification Accuracy (%) |
| DGC+ [61] | 67.44 |
| GSVM [57] | 71.07 |
| MLP with LMS | 100 |
| SVM with LMS | 100 |
| K-NN with LMS | 99.13 |
Alberto Cano and al. proposed an algorithm called weighted Data Gravitation Classification (DGC+) that compares the gravitational field for the different data classes to predict the class with the highest magnitude. The proposal improves previous data gravitation algorithms by learning the optimal weights of the attributes for each class and solves some of their issues such as nominal attributes handling, imbalanced data performance, and noisy data filtering [61]. They achieve 67.44% of accuracy. L. Gonzalez-Abril and al. proposed GSVM method [57]; they obtained an accuracy of 71.07%. In this work, as can be seen from the results (Table. 6), our approach obtain the best classification accuracy with the different classifiers.
Works tested on Appendicitis database
Table 7 gives the classification accuracies of our method and other methods applied on the appendicitis database.
Table.7 classification accuracies obtained with our method and other classifiers in literature (Appendicitis)
| Method | Classification Accuracy (%) |
| DGC+ [61] | 84.09 |
| BSMAIRS [62] | 92.5926 |
| MLP with LMS | 100 |
| SVM with LMS | 100 |
| K-NN with LMS | 94.29 |
Alberto Cano and al. proposed a DGC+ algorithm [61] and they achieve 84.09% of accuracy. Kung-Jeng and al. developed a hybrid classifier approach, they combine Borderline Synthetic Minority oversampling technique (BSM) and Artificial Immune Recognition System (AIRS) as global optimization searcher with the nearest neighbor algorithm used as a local classifier. This approach denoted as BSMAIRS. For the evaluation of the results, Kung-Jeng and al. have used a fivefold cross validation strategy and they have obtained five accuracies; the best one obtained with 92.5926% [62]. In this study, as can be seen from the results (Table.7), our approach obtains an excellent classification accuracy.
5.Conclusion
In this paper, we proposed a learning method based on a cost sensitive extension of least mean square algorithm that penalizes errors of different samples with different weights. This approach is used to overcome the problem of imbalanced data, it gives high weights for the samples of the minority classes.
The proposed approach was applied on five medical datasets from UCI database to assess its performance. Experimental results revealed that LMS algorithm performed better (achieved higher performance values) than the other balancing methods. It shows clearly the advantage of LMS when we handle the imbalanced data. Moreover, the results showed that the combination of LMS with different techniques (MLP, SVM and K-NN) can enhance classifier performance, particularly in terms of accuracy.
We propose that our approach will be applied for multiclass datasets, also the LMS algorithm will be tested on other intelligent methods based techniques such as fuzzy logic in order to increase the interpretability of the results. Also we can extend the ratio of the minority class to majority class in order to do a study in this situation. Our approach will be proposed to overcome the disadvantages of the basic sampling methods. Because the LMS algorithm that penalizes errors of different samples with different weights. However, this approach does not eliminate the instances of the majority class and does not add the instances of the minority classes. We can conclude that, this method keeps the same database.
- D. Y. Liu, “Feature selection based on mutual information for gear faulty diagnosis on imbalanced dataset” J. Comput. Inf. Syst., Vol. 8, No.18, pp.7831–7838, 2012.
- L. Mena, J.A. Gonzalez, “Machine learning for imbalanced datasets: application in medical diagnostic” in: Proceedings of the 19th International FLAIRS Conference, May 11–13, Melbourne Beach, Florida, 2006.
- D. A. Cieslak, N.V. Chawla A. Striegel, “Combating imbalance in network intrusion datasets” in: Proceedings of 2006 IEEE International Conference on Granular Computing, May 10-12, pp. 732–737, Atlanta, USA, 2006.
- C. Thomas, “Improving intrusion detection for imbalanced network traffic” Security and Communication Networks, Vol.6, No.3, pp.309-324, 2013.
- Z. H. Zheng, X.Y. Wu, R. Srihari, “Feature selection for text categorization on imbalanced data” ACM SIGKDD Explor. Newslett, Vol. 6, No.1, pp. 80–89, 2004.
- Y. L. Li, G.S. Sun, Yehang Zhu, “Data imbalance problem in text classification” in: Proceedings of the Third International Symposium on Information Processing, October 15-17, pp. 301–305, Qingdao, China, 2010.
- J. Perols, “Financial statement fraud detection: an analysis of statistical and machine learning algorithms” AUDITING: J. Pract. Theory, Vol. 30, No.2, pp.19–50, 2011.
- A. Ghazikhani, R. Monsefi, H.S. Yazdi, “Ensemble of online neural networks for non-stationary and imbalanced data streams” Neurocomputing, Vol.122, pp. 535–544, 2013.
- M. Galar, A. Fernandez, E. Barrenechea, H. Bustince and F. Herrera, “A review on ensembles for the class imbalance problem: bagging-, boosting-, and hybrid-based approaches” IEEE Transactions on systems, man, and cybernetics—part c: applications and reviews, Vol. 42, No. 4, pp. 463–484, 2012.
- Yun Qian, Yanchun Liang, Mu Li, Guoxiang Feng and Xiaohu Shi, “A resampling ensemble algorithm for classification of imbalance problems” Neurocomputing, Vol. 143, pp. 57–67, 2014.
- R. Pearson, G. Goney, and J. Shwaber, “Imbalanced clustering for microarray time-series” in Proceedings of the International Conference on Machine Learning, Workshop Learning from Imbalanced Data Sets II, Washington, USA, 2003.
- Y. Sun, M. Kamel, and Y. Wang, “Boosting for learning multiple classes with imbalanced class distribution” in Proceedings of 6th International Conference on Data Mining, December 18-22, Washington, USA, 2006.
- K. Chen, B. Lu, and J. Kwok, “Efficient classification of multi- label and imbalanced data using min-max modular classifiers” in Proceedings of the International Joint Conference on Neural Networks, July 16-21, Vancoudar, Canada, 2006.
- G. Weiss, “Mining with rarity: a unifying framework” ACM SIGKDD Explor. Newslet, Vol. 6, pp.7–19, 2004.
- T. Jo, N. Japkowicz, “Class imbalances versus small disjuncts” ACM SIGKDD Explor. Newslett, Vol. 6, pp.40– 49, 2004.
- Qiao Cai, Haibo He, and Hong Man, “Imbalanced evolving self-organizing learning, Neurocomputing” Vol. 133, pp.258–270, 2014.
- H. He, E. Garcia, “Learning from imbalanced data” IEEE Trans. Knowl. Data Eng, Vol. 21, pp.1263–1284, 2009.
- X. Liu, J. Wu and Z. Zhou, “Exploratory under sampling for class imbalance learning” in Proceedings of the 6th IEEE International Conference on Data Mining, Hong Kong, China, 2006.
- J. Zhang, I. Mani, “K-NN approach to unbalanced data distributions: a case study involving in formation extraction” in proceedings of the International Conference on Machine Learning, Workshop Learning from Imbalanced Data Set, Washington, USA, 2003.
- N. Chawla, K. Bowyer, L. Hall, and W. Kegelmeyer, “SMOTE: synthetic minority over-sampling technique” J. Artif. Intell. Res, Vol. 16, pp. 321– 357, 2002.
- H. Han, W. Wang, and B. Mao, “Borderline- SMOTE: a new over-sampling method in imbalanced datasets learning” in proceedings of the International Conference on Intelligent Computing, August 23-26, Hefei, China, 2005.
- H. He, Y. Bai, E. Garcia, and S. Li, “ADASYN: adaptive synthetic sampling approach for imbalanced learning” in proceedings of the International Conference on Neural Networks, June 1-8, Hong Kong, China, 2008.
- A. D’Addabbo and R. Maglietta, “Parallel selective sampling method for imbalanced and large data classification” Pattern Recognition Letters, Vol. 62, pp. 61–67, 2015.
- J. Caballero, F. Martinze, C. Hervas, and P. Gutierrez, “Sensitivity vs. accuracy in multiclass problems using memetic Pareto evolutionary neural networks” IEEE Trans. Neural Netw, Vol. 21, pp.750–770, 2010.
- N. Garcia-Pedrajas, “Constructing ensembles of classifiers by means of weighted instance selection” IEEE Trans. Neural Netw, Vol. 20, pp.258– 277, 2009.
- N. Chawla, A. Lazarevic, L. Hall and K. Bowyer, “SMOTEBoost: improving prediction of the minority class in boosting” in proceedings of the European Conference on Principles and Practice of Knowledge Discovery in Databases, September 22-26, Cavtat Dubrovnik, Croatia, 2003.
- S. Chen, H. He, and E. Garcia, “RAMOBoost: ranked minority over sampling in boosting” IEEE Trans. Neural Netw, Vol. 21, pp.1624–1642, 2010.
- Belarouci, S., Bouchikhi, S. and Chikh, M.A., “Comparative study of balancing methods: case of imbalanced medical data” Int. J. Biomedical Engineering and Technology, Vol. 21, No. 3, pp.247–263, 2016.
- X. Zhang, Y. Li, R. Kotagiri, L. Wu, Z. Tari, and M. Cheriet, “KRNN: k Rare- class Nearest Neighbour classification” Pattern Recognition, Vol. 62, pp. 33–44, 2017.
- Y. Sun, M. Kamel, A. Wong, and Y. Wang, “Cost- sensitive boosting for classification of imbalanced data” Pattern Recognit, Vol. 40, pp.3358–3378, 2007.
- K. Ting, “A comparative study of cost- sensitive Boosting algorithms” in proceedings of the International Conference on Machine Learning, San Francisco, CA, USA, 2000.
- F. Cheng, J. Zhang, and C. Wen, “Cost-Sensitive Large margin Distribution Machine for classification of imbalanced data” Pattern Recognition Letters, Vol. 80, pp. 107–112, 2016.
- S. Ali, A. Majid, S. G. Javed, and M. Sattar, “Can-CSC-GBE: Developing Cost-sensitive Classifier with Gentleboost Ensemble for breast cancer classification using protein amino acids and imbalanced data” Computers in Biology and Medicine, Vol. 73, pp. 38–46, 2016.
- W. Fan, S. Stolfo, J. Zhang and P. Chan, “AdaCost: misclassification cost-sensitive boosting” in proceedings of the 6th International Conference on Machine Learning, Slovenia, 1999.
- M. Maloof, “Learning when datasets are imbalanced and when costs are unequal and unknown” in proceedings of the International Conference on Machine Learning, Workshop Learning from Imbalanced Data Sets II, Washington, USA, 2003.
- Z. Zhou, X. Liu, “Training cost- sensitive neural networks with methods addressing the class imbalance problem” IEEE Trans. Knowl. Data Eng., Vol. 18, pp.63– 77, 2006.
- M. Kukar, I. Kononenko, “Cost- sensitive learning with neural networks” in proceedings of the European Conference on Artificial Intelligence, Wiley, New York, 1998.
- K. Muller, S. Mika, G. Ratsch, K. Tsuda, B. Scholkopf, “An introduction to kernel- based learning algorithms” IEEE Trans. Neural Netw, Vol. 12, pp.181– 201, 2001.
- X. Hong, S. Chen, C. Harris, “A kernel- based two-class classifier for imbalanced data sets” IEEE Trans. Neural Netw, Vol. 18, pp.28– 41, 2007.
- M. Pérez-Ortiz, P. A. Gutiérrez, and C. Hervás-Martinez, “Borderline Kernel Based Over-Sampling” J.-S. Pan et al. (Eds.): HAIS 2013, LNAI 8073, Springer-Verlag Berlin Heidelberg, pp. 472–481, 2013.
- P. Li, K. L. Chan, S. Fu, and S. M. Krishnan, “Kernel Machines for Imbalanced Data Problem in Biomedical Applications” Y. Ma and G. Guo (eds.), Support Vector Machines Applications, Springer International Publishing Switzerland, 2014.
- Y. Tang, Y. Zhang, “Granular SVM with repetitive under sampling for highly imbalanced protein homology prediction” in proceedings of the International Conference on Granular Computing, May 10-12, Atlanta, USA, 2006.
- G. Wu, E. Chang, “KBA: kernel boundary alignment considering imbalanced data distribution” IEEE Trans. Knowl. Data Eng, Vol. 17, pp.786 –795, 2005.
- T. Fawcett, “An introduction to ROC analysis”, Pattern Recognit. Lett. Vol. 27, pp.861–874, 2006.
- S. Ertekin, J. Huang, L. Bottou and C. Giles, “Learning on the border: active learning in imbalanced data classification” in proceedings of the ACM Conference on Information and Knowledge Management, Lisbon, Portugal, 2007.
- A. Bordes, S. Ertekin, J. Weston and L. Bottou, “Fast kernel classifiers with online and active learning” J. Mach. Learn. Res, Vol. 6, pp.1579– 1619, 2005.
- M. Zieba and J. M. Tomczak, “Boosted SVM with active learning strategy for imbalanced data” Soft Comput, Vol. 19, pp.3357–3368, 2015.
- J. Zhu, E. Hovy, “Active learning for word sense disambiguation with methods for addressing the class imbalanced problem” in proceedings of the International Joint Conference on Empirical Methods in Natural Language Processing and Computational Natural Language Learning, Prague, Czech Republic, 2007.
- Roberto D’Ambrosio, “Handling Imbalanced Datasets by Reconstruction Rules in Decomposition Schemes” Ph.D Thesis, Campus Bio-Medico University, Roma, Italy, 2014.
- Christian JUTTEN, “FILTRAGE LINEAIRE OPTIMAL” During the fifth year of the department 3i options Images and Signals and Automatic to Joseph Fourier – Polytech’ Grenoble University, 2010.
- Thomas FILLON, “Traitement Numérique du Signal Acoustique pour une Aide aux Malentendants” Ph.D Thesis, Paris University, Paris, France, 2004.
- Yilun Chen, Yuantao Gu, and Alfred O. Hero, “Regularized Least Mean Square Algorithms” In IEEE, 2010.
- J.-F. Bercher and P. Jardin, “Introduction au filtrage adaptatif” ESIEE Paris, 2003.
- UCI MACHINE LEARNING REPOSITORY, http://archive.ics.uci.edu/ml/data / (last update 01/03/2015).
- L. P. Cordella and al., “Reliability parameters to improve combination strategies in multi-expert systems” Pattern Analysis & Applications, Vol. 2, No. 3, pp. 205–214, 1999.
- J.-C. Platt, “Probabilistic outputs for support vector machines and comparisons to regularized likelihood methods” Advances in Large Margin Classifiers, pp. 61–74, Cambridge, MA, 1999.
- L. Gonzalez-Abril, H. Nuñez, C. Angulo and F. Velasco, “GSVM: An SVM for handling imbalanced accuracy between classes inbi-classification problems” Applied Soft Computing, Vol.17, pp. 23–31, 2014.
- Yuan-Hai Shao, Wei-Jie Chen, Jing-Jing Zhang, Zhen Wang and Nai-Yang Deng, “An efficient weighted Lagrangian twin support vector machine for imbalanced data classification” Pattern Recognition, 2014.
- Kung Jeng Wang and Angelia Melani Adrian, “Breast Cancer Classification Using Hybrid Synthetic Minority Over-Sampling Technique and Artificial Immune Recognition System Algorithm” International Journal of Computer Science and Electronics Engineering (IJCSEE), Vol. 1, No. 3, 2013.
- G. NAGA RAMADEVI, Dr. K. USHA RANI and Dr. D. LAVANYA, “Evaluation of Classifiers Performance using Resampling on Breast cancer Data” International Journal of Scientific & Engineering Research, Vol. 6, No. 2, 2015.
- Alberto Cano, Amelia Zafra, and Sebastián Ventura, “Weighted Data Gravitation Classification for Standard and Imbalanced Data” IEEE Transactions on cybernetics, Vol. 43, No. 6, 2013.
- Kung-Jeng Wang, Angelia Melani Adrian, Kun-Huang Chen and Kung-Min Wang, “A hybrid classifier combining Borderline-SMOTE with AIRS algorithm for estimating brain metastasis from lung cancer: A case study in Taiwan” computer methods and programs in biomedicine, Vol.119, pp. 63–76, 2015.