Autonomous Micro-Air-Vehicle Control Based on Visual Sensing for Odor Source Localization
Autonomous Micro-Air-Vehicle Control Based on Visual Sensing for Odor Source Localization
Volume 2, Issue 3, Page No 1152-1158, 2017
Author’s Name: Kenzo Kurotsuchia), Mitsuharu Tai, Hiromasa Takahashi
View Affiliations
Center for Exploratory Research, Hitachi, Ltd., 1-280, Higashi-Koigakubo, Kokubunji, Tokyo 185-8601, Japan
a)Author to whom correspondence should be addressed. E-mail: kenzo.kurotsuchi.qs@hitachi.com
Adv. Sci. Technol. Eng. Syst. J. 2(3), 1152-1158 (2017); ![]() DOI: 10.25046/aj0203145
DOI: 10.25046/aj0203145
Keywords: odor source localization, autonomous, micro air vehicle, drone, gas sensor, vision

Export Citations
In this paper, we propose a novel control method for autonomous-odor-source localization using visual and odor sensing by micro air vehicles (MAVs). Our method is based on biomimetics, which enable highly autonomous localization. Our method does not need any instruction signals, including even global positioning system (GPS) signals. An experimenter simply blows a whistle, and the MAV will then start to hover, to seek an odor source, and to keep hovering near the source. The GPS-signal-free control based on visual sense enables indoor/underground use. Moreover, the MAV is light-weight (85 grams) and does not cause harm to others even if it accidentally falls. Experiments conducted in the real world were successful in enabling odor source localization using the MAV with a bio-inspired searching method. The distance error of the localization was 63 cm, more accurate than the target distance of 120 cm for individual identification. Our odor source localization is the first step to a proof of concept for a danger warning system. These localization experiments were the first step to a proof of concept for a danger warning system to enable a safer and more secure society.
Received: 11 May 2017, Accepted: 28 June 2017, Published Online: 16 July 2017
1. Introduction
As the performance of sensors is improved and as the internet of things (IoT) is expanded, new social systems utilizing sensors are being designed to improve safety and security. Although odor sensing is one of the most important kinds of information for living things, the sensitivity of gas sensors in the past could not come close to that of a living thing, such as dogs, which can respond to a parts-per-trillion (ppt) odor [1]. Gas sensors with parts-per-quadrillion (ppq) sensitivity have been reported [2]. As gas sensors are improved, new safety systems and disease-detection systems are being designed using gas sensors [2, 3].
This paper is an extension of work originally presented in 2016 23rd International Conference on Mechatronics and Machine Vision in Practice (M2VIP 2016) [4]. We challenged to discover issues and consider countermeasures for constructing a danger warning system to enable a safer and more secure system utilizing autonomous odor source localization by experiments. The results of the experiments were mainly presented in the previous paper.
Micro air vehicles (MAVs) are promising carriers of gas sensor devices in safety systems because these vehicles can move quickly enough to chase dubious characters and fly over pedestrians without any interference. In safety systems, plural MAVs will work in a coordinated manner and communicate with other systems such as security cameras and audience guide systems. If a MAV detects danger, the MAVs will give a warning of the danger using an alarm bell and/or notification to other security systems to call a security guard. While the MAVs need a lot of information, central control computer and network performance is limited. To enable robust control in complex situations, an autonomous-MAV-control system is required. Therefore, we studied autonomous-MAV control.
dor source localization has been studied widely for detecting explosives, for narcotics control, and for detecting gas leaks to ensure social safety and security [5–12]. Odor source localization using MAVs is a challenging task due to the non-uniform dispersion of odor, low sensitivity of commercially-available-gas sensors, and constraints of MAVs. Odor from its source is moved by the wind and is divided into many odor filaments. Localizing the source by following the concentration gradient of odor is difficult. In addition, MAV control is difficult due to unstable flight performance, low performance cameras for self-localization, small payload, and limited flight time. Therefore, a robust control method for odor source localization is needed. Many algorithms for odor source localization have been proposed. The first algorithm uses geometric control such as spiral patterns [6]. The second one is based on Bayesian inference theory [8]. The third mimics biological models such as cells [14], bacteria [9], insects [15], moths [10, 11], and ants [12]. Insects and animals use their olfactory senses with ingenuity for collecting food, avoiding enemies, and finding mates [10]. In this study, a bio-inspired algorithm, specifically a bacterium model, was utilized to achieve stable odor source localization in difficult circumstances. We thought that simple and effective control of bacterium model is valid as the first step in biomimetic control for odor source localization.
In addition, mobile robots—including MAVs—must have a self-localization method so that they can determine their position with respect to known locations in the environment in order to navigate effectively and to reach the goal region. For self-localization, two methods have been proposed. One is vision-based control, and the other is global positioning system (GPS) based control [5]. The safety system has applicability to large facilities, such as sports stadiums, stations—including underground train stations—and airports. The aforementioned places may be out of reach of the GPS-based control. Therefore, we selected a method that is GPS signal free and that has vision-based self-localization. This approach enhances the independence of the MAV.
2. Micro-Air-Vehicle Platform
2.1. Micro Air Vehicles
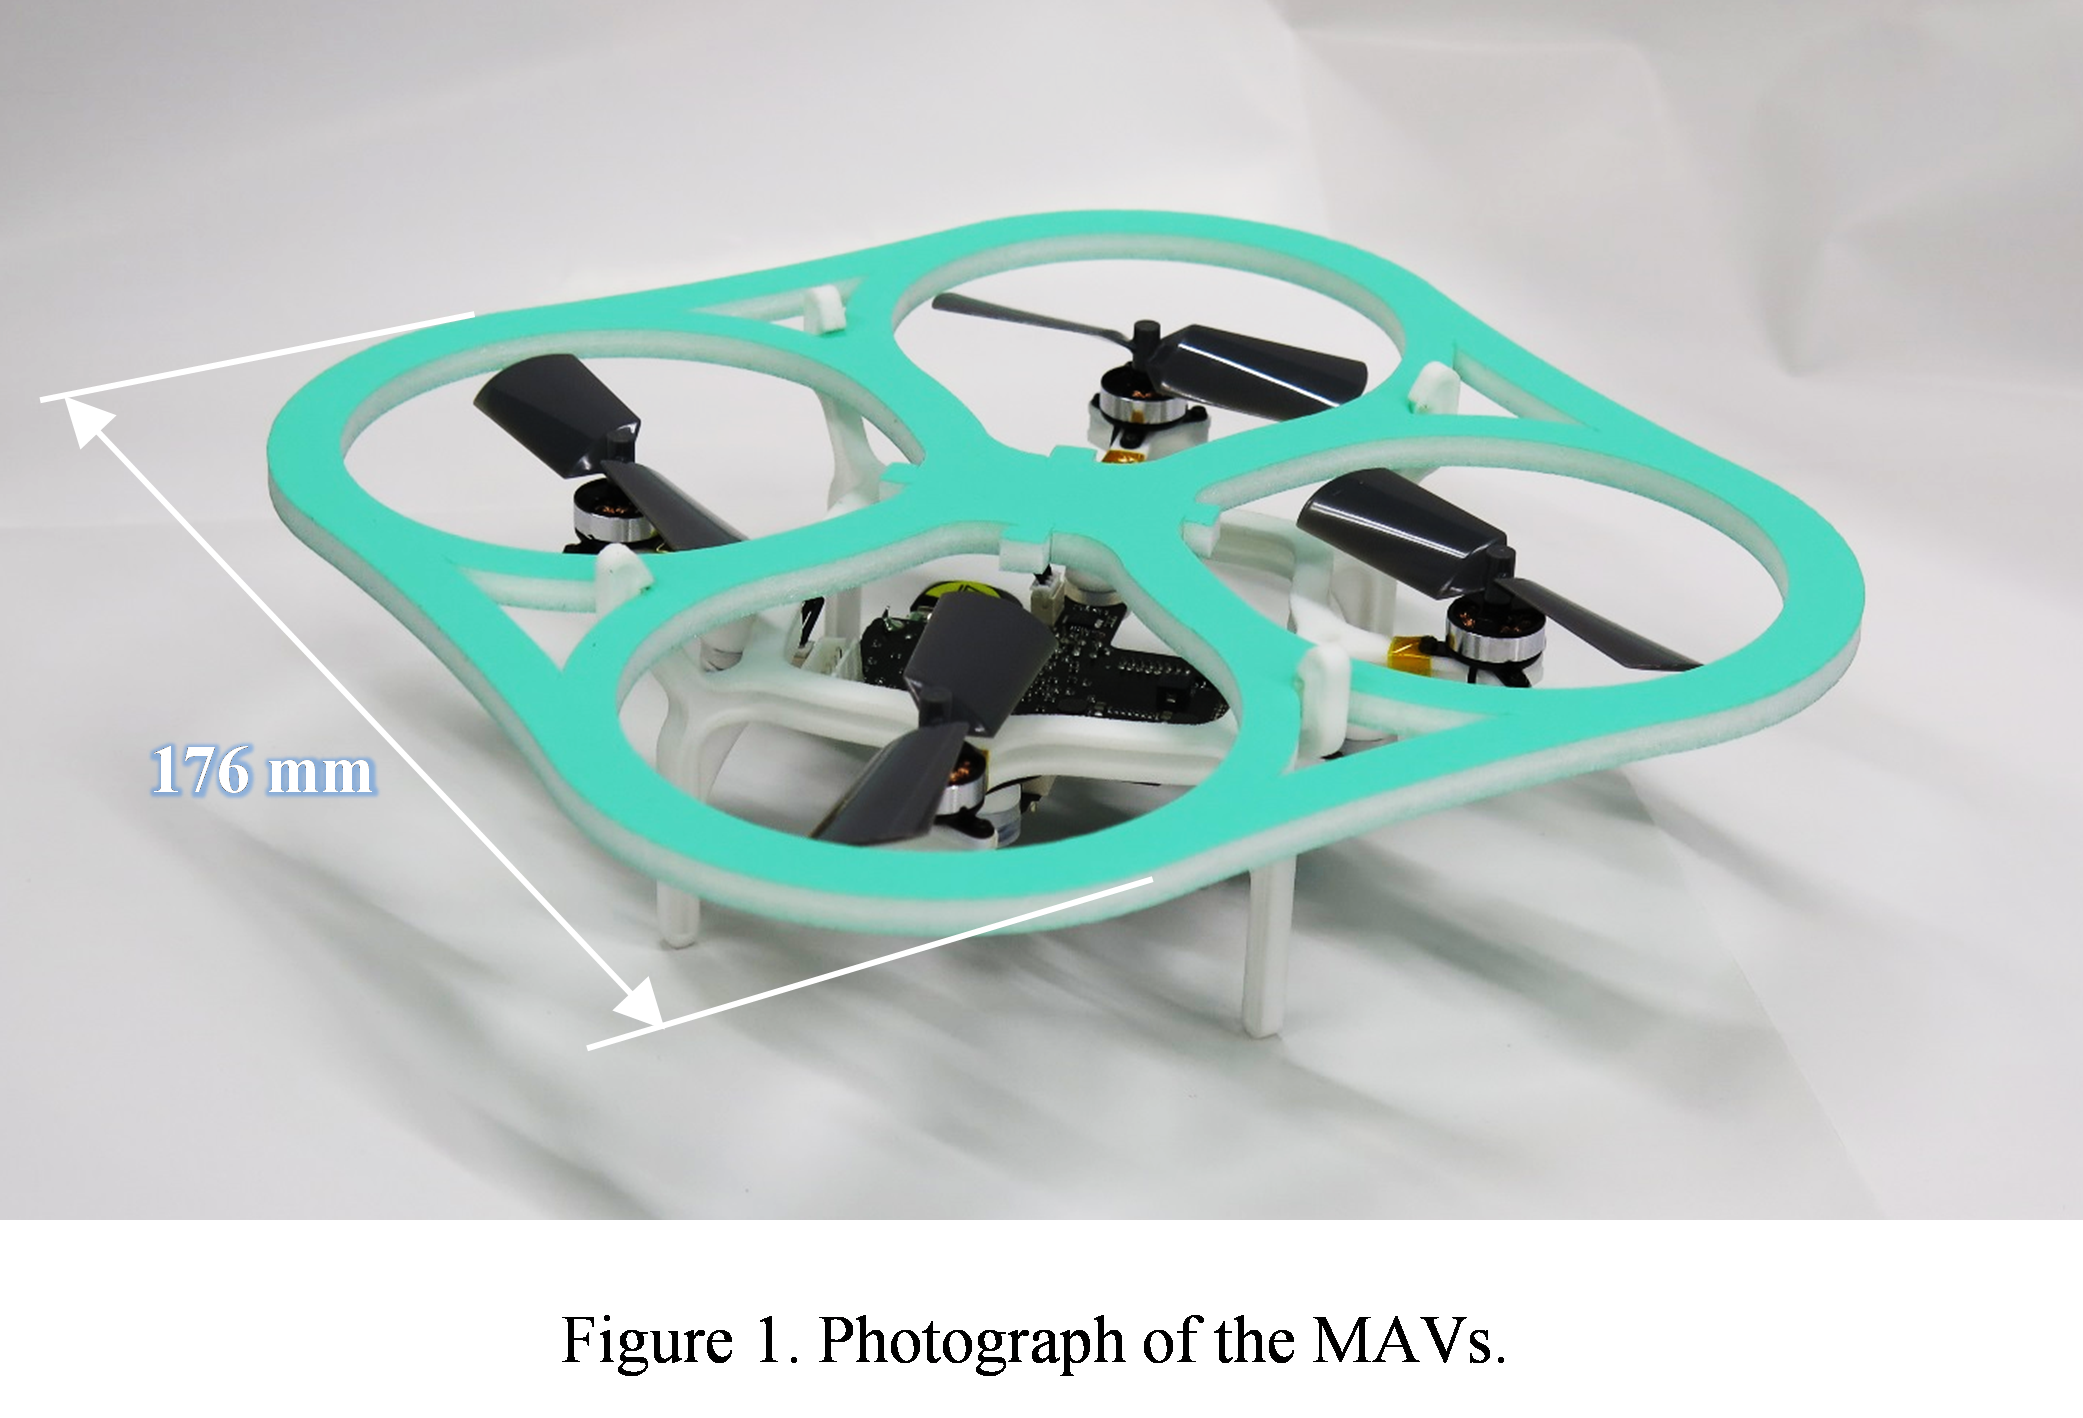
The Phenox 2 (Phenox Lab, referred to as MAV in this article) MAVs were selected because they are light-weight, they have high computing performance for vision-based self-localization, and they can be extended by attaching odor sensors and enabling control program flexibility [13, 16]. Figure 1 shows the Phenox 2, which flies using four electric motors and has a diameter of 176 mm. The specifications of the MAVs are summarized in Table I. The light-weight MAVs were designed so as not to cause harm to others even if they accidentally fall. One of them weighs 85 grams, including the odor sensor module, LiPo battery, and propeller guard. In some countries, there are regulations for drone whose weight is above standard (e.g. 200 grams in Japan). The MAV is lighter than the standard and easy to use. The controller chip is Zynq 7000 (Xilinx, XC7Z010), which consists of FPGA and dual-core CPUs. The FPGA conducts fast image processing for controlling self-positioning. The CPUs are Cortex-A9 667 MHz dual-core CPUs based on the ARM architecture. One CPU (CPU1) is used for real-time operation such as low-level-flight control. The other (CPU0) runs an odor-source-localization program written in C language on the Ubuntu/Linux OS. 256 MB DDR3 memory and a 4 GB microSD card are mounted on the MAV for working memory and storage.
 The flight control relies on cameras, an onboard inertial measurement unit (IMU, 9-DOF), range sensor, microphone, and gas sensor. The front and bottom cameras are CMOS cameras with 320×240 pixels, respectively. In this experiments, we use only bottom camera. The IMU consists of a three-axis accelerometer and a three-axis rotation rate sensor. In addition, a sonar sensor is used to control the altitude of the MAV. The MAV has a mounted microphone that receives a 3 kHz whistle signal blown by the experimenter. Communication is established using a Wi-Fi to send flight logs to the ground station. The MAV supports I2C communication to extend the hardware capabilities. We used I2C communication to connect to an odor sensor module board.
Figure 2 shows a block diagram of the MAV. The bottom camera mounted on the MAV collects image data. The front camera is unused for controlling the MAV. The FPGA conducts image processing of feature point detection based on the FAST algorithm [13, 20] and feature point description based on the BRIEF algorithm [21]. CPU1 calculates the current position based on the feature points for self-localization, and it notifies CPU0 of the current position. CPU0 determines the target position based on the current position and current odor concentration, and it notifies CPU1 of the target position. CPU1 calculates the parameters of the four motor drivers based on the current position, the target position, and information on the IMUs and range sensor. The FPGA controls the motor drivers to enable propellers to move the MAV.
2.2. Odor sensor module board
The odor sensor module board was designed for light-weight, low-power consumption. A photograph of the odor sensor module is shown in Figure 3. The gas sensor (Figaro Engineering, TGS8100) converts the concentration of odor to the current magnitude. We selected a MEMS-type gas sensor, which makes the sensor small and light-weight and enables it to have low-power consumption. A constant voltage is applied to the gas sensor. If hydrogen or alcohol is present, the resistance of the gas sensor is reduced, and the current flows more. For example, the current magnitude of 10 ppm ethanol is five times higher than that of clean air. The sensitivity of the commercially-available gas sensor is much lower than the nose of living things. For example, dogs can respond to a parts-per-trillion (ppt) odor [2]. Light-weight odor sensor modules with low-power consumption were fabricated
The analog front-end (Texas Instruments, LMP91000) converts the current magnitude to voltage magnitude. The analog-digital converter (Texas Instruments, ADS1100) converts the voltage magnitude to a digital signal and transmits to MAV’s CPU through the I/O. The I/O consists of four pins. Two pins are used for I2C communication. The other two pins are used for a voltage supply at 3.3 volts. The linear regulator (Texas Instruments, LP5907MFX-1.8) converts the supply voltage (3.3 volts) to voltage for the heater of a gas sensor (1.8 volt).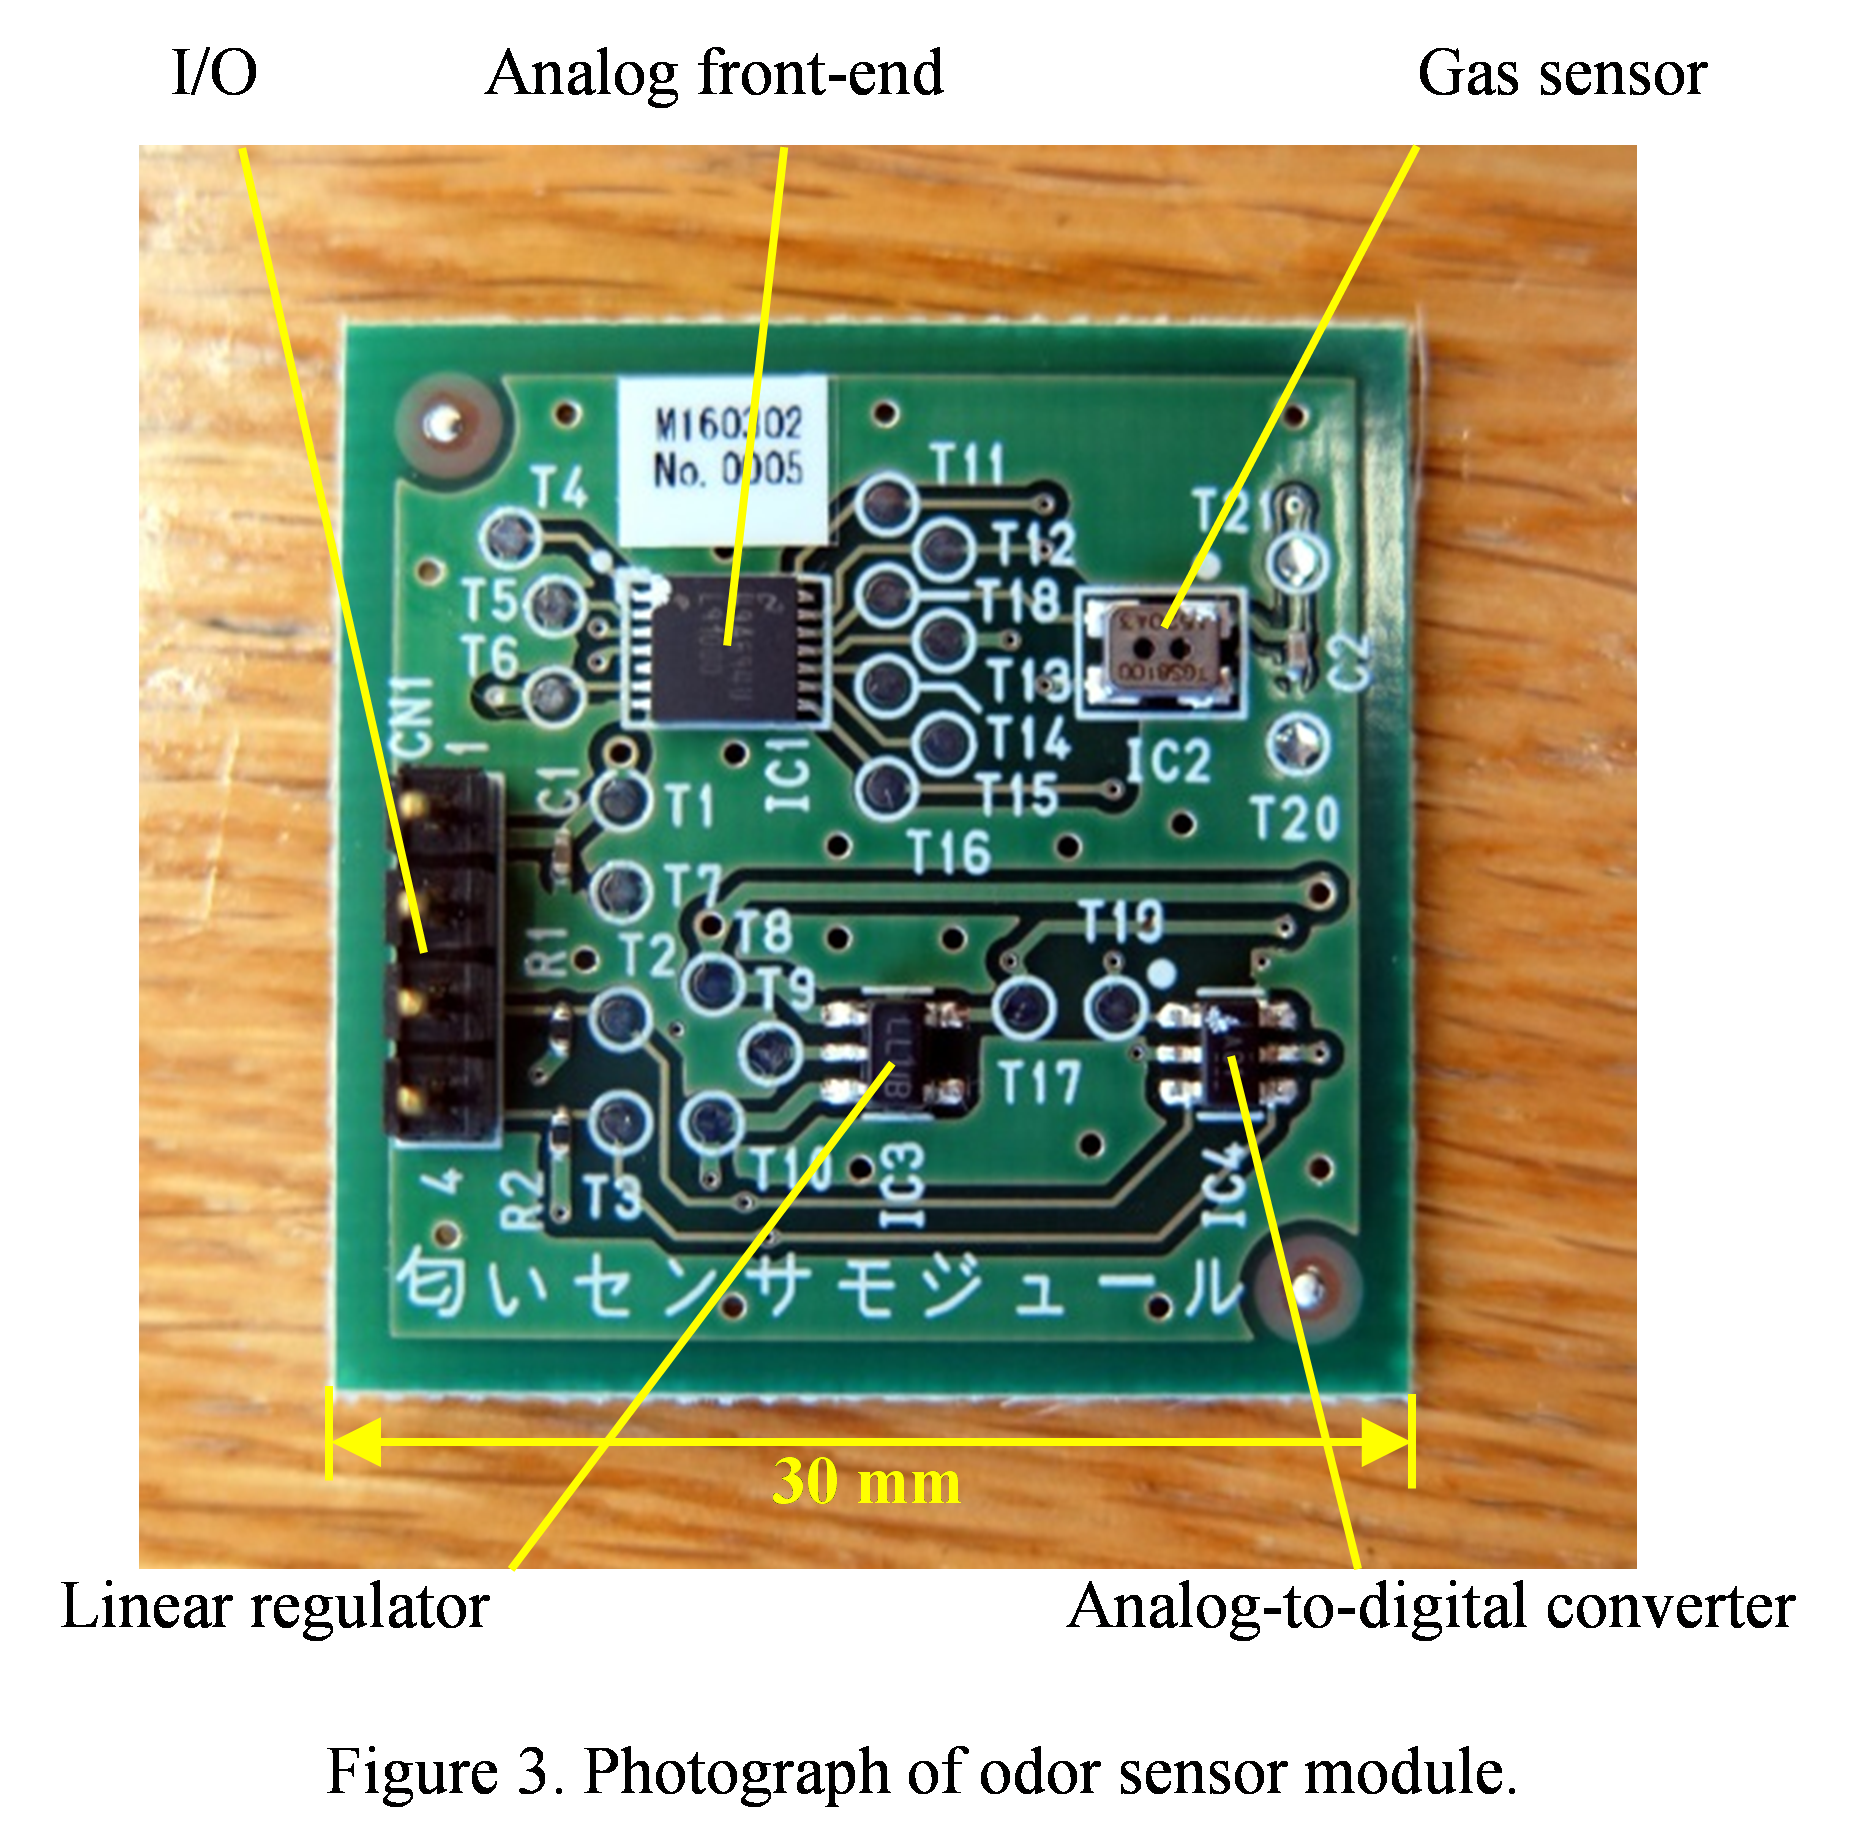
If the odor concentration increases, the magnitude of the current flow in the gas sensor and the output voltage of the analog front-end increase. Threshold output voltage VT for deciding how to finish the odor source localization is determined as follows:
VT = VI + 0.7 mV (1)
Initial voltage VI was measured at the start of the experiment; namely, the VI means the voltage of the clean air.
2.3. MAV arena
Reproducible experimental conditions are required to compare different odor source localization methods. Figure 4 shows a real- world experiment that was carried out in a 7 × 12 m training room without special lighting. A fabric (Asahi Kasei, Bemcot) sprayed with ethanol for disinfection (ethanol 76.9–81.4% v/v) was set on the top of a light stand as the odor source. Plural markers 30 cm in diameter were put into place to help the image feature extraction and to stabilize flight.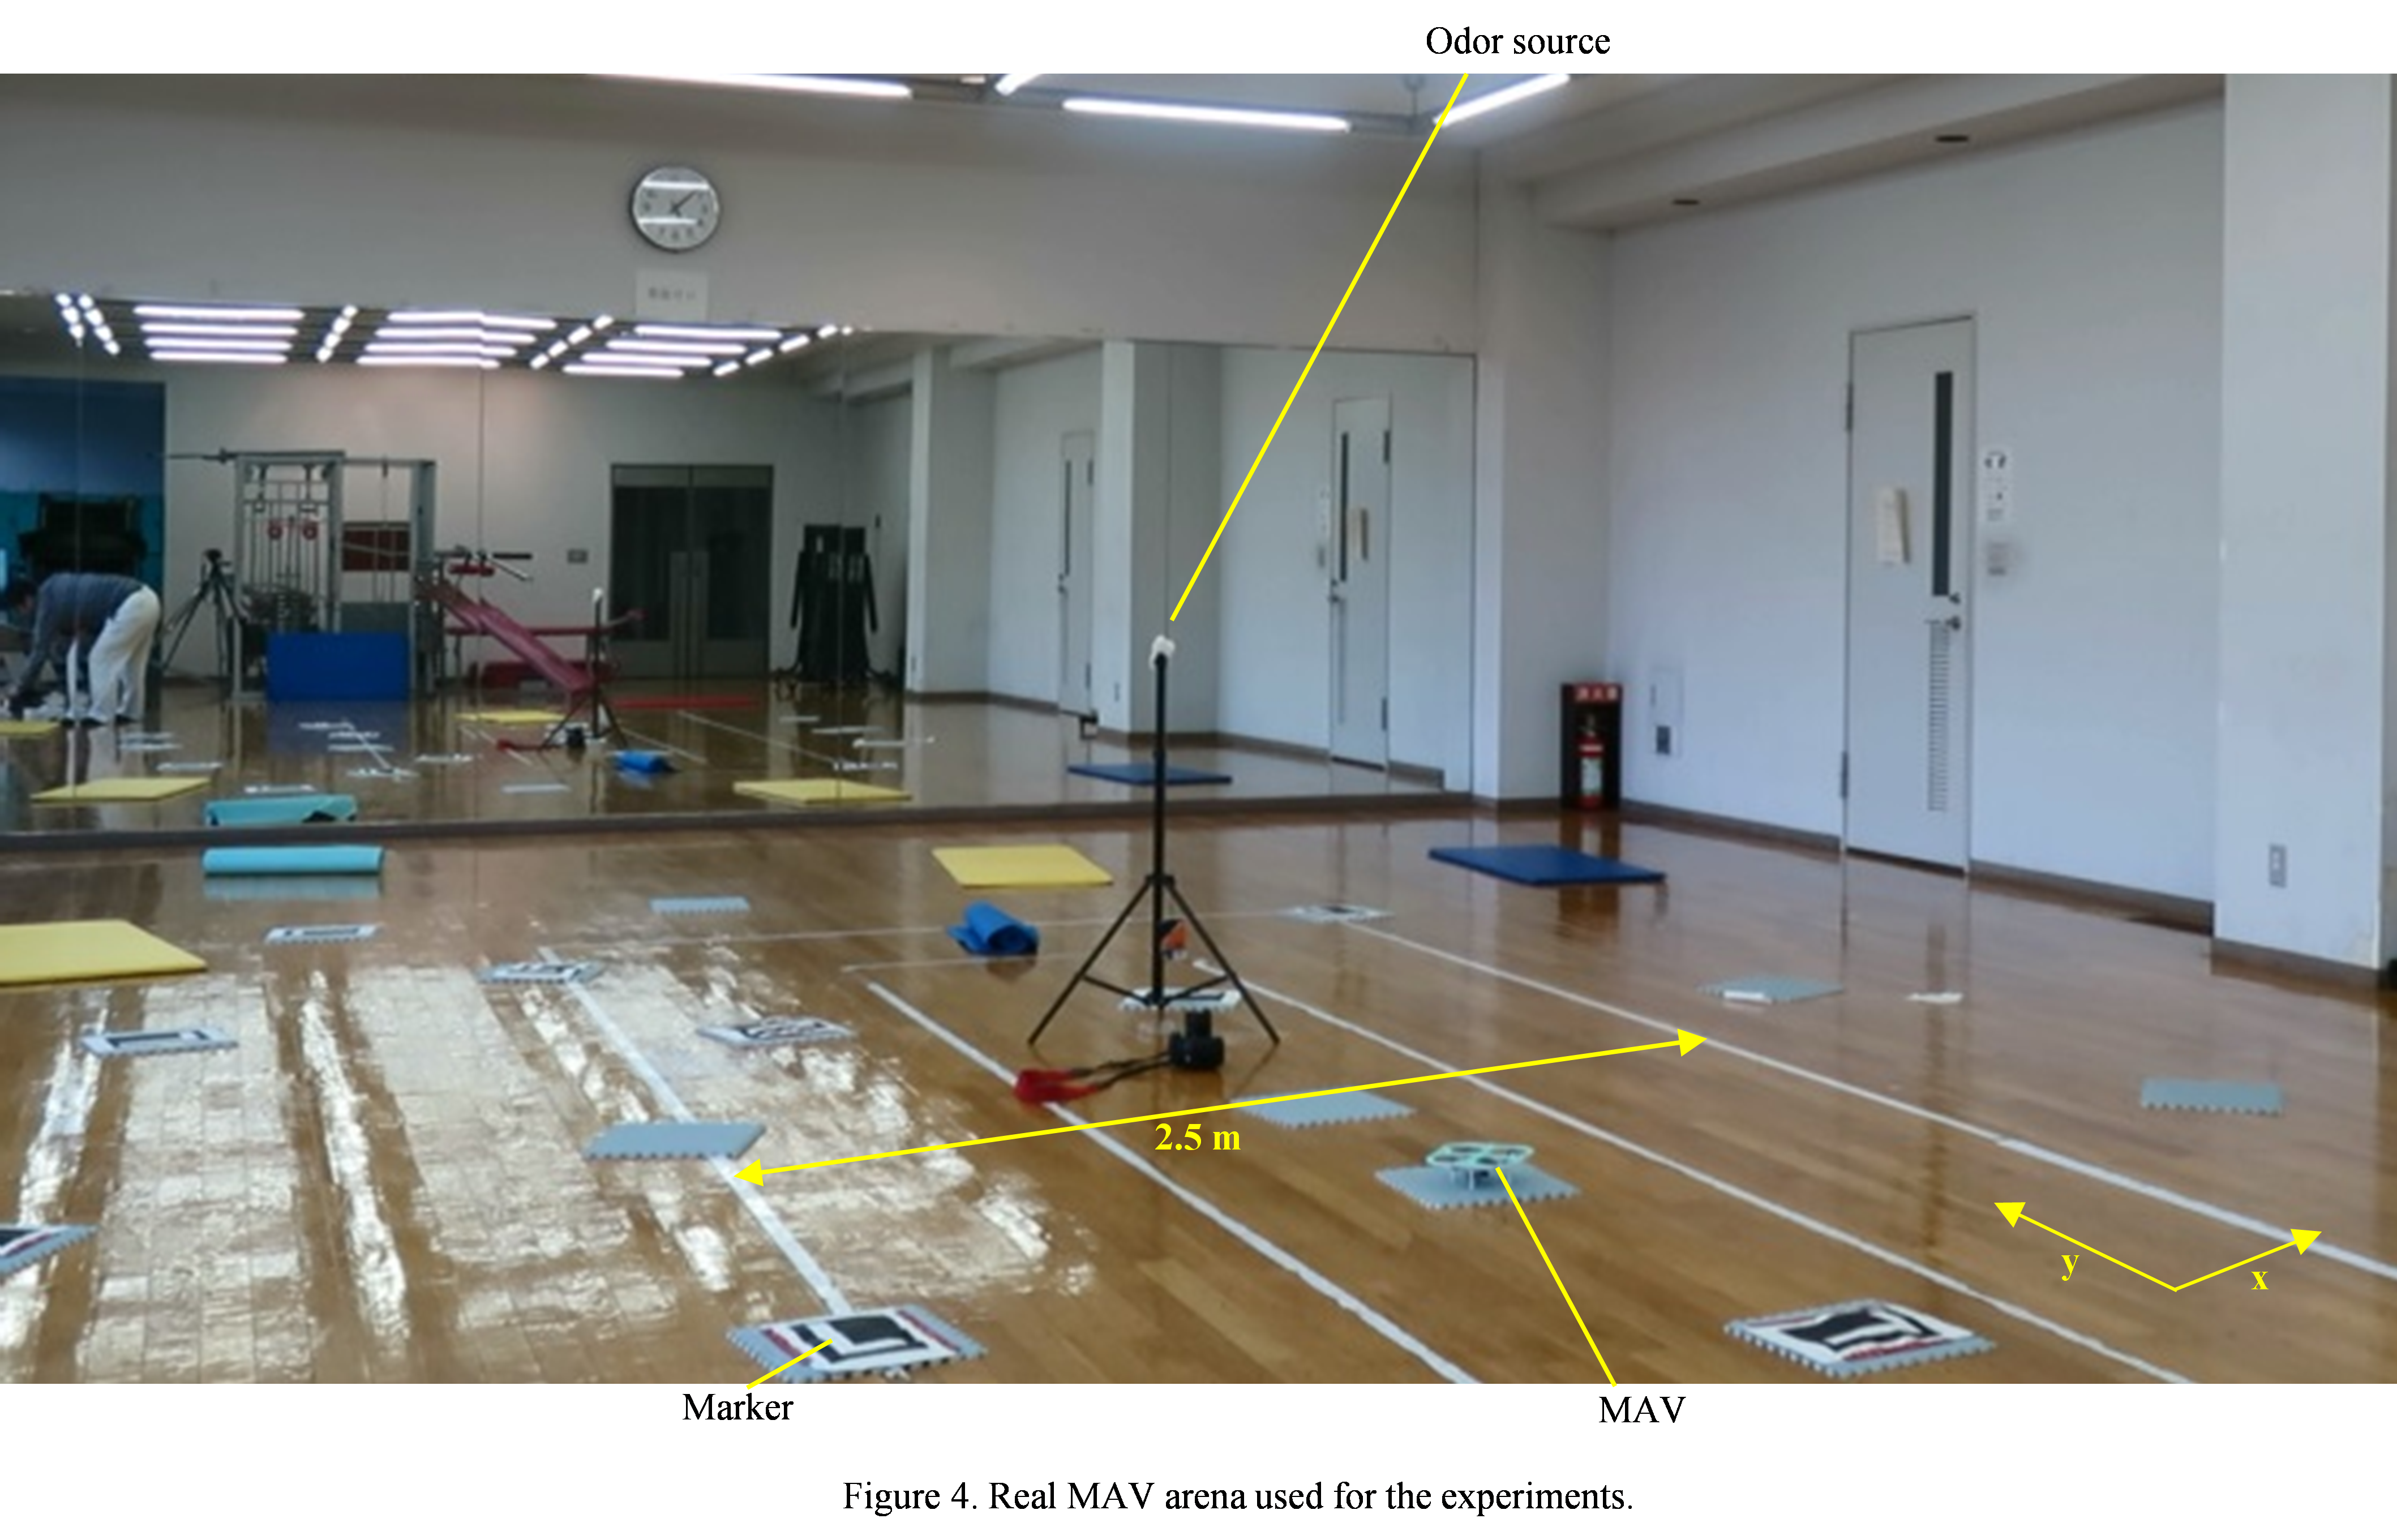
The MAV was placed on the floor at a position 1.8 m away from the odor source. Two external cameras were set outside of the arena. One camera with a fisheye lens was placed on the floor to take a movie. After the experiment, the trajectory of the flight was calculated. Another camera with a normal lens was set on a tripod to take a movie of the experiment. No signals were sent to the MAV for controlling it.
3. Bio-Inspired-Search Algorithm
3.1. Algorithm
We utilized a bio-inspired algorithm, specifically a bacterium model, to achieve stable odor source localization in difficult circumstances due to the limited power of the MAV’s onboard computer, the low image quality of the camera, and the low sensitivity of the gas sensor.
The cells undergo chemotaxis to get close to acceptable circumstances [19]. Some bacteria, such as E. coli, have several flagella, which can rotate in two ways. One is counter-clockwise (CCW) rotation, which aligns the flagella into a single rotating bundle, causing the bacterium to swim in a straight line (Straight swim). The other is clockwise (CW) rotation that breaks the flagella bundle apart, causing the bacterium to tumble in place (Tumbling). The chemotaxis is controlled by switching the rotation depending on the concentration gradient.
Figure 5 shows a pseudocode of the firmware for controlling the MAV. At the start of the experiment, the MAV was placed on the floor. The MAV started its takeoff after recognizing the whistle signal blown by the experimenter (pseudocode line 1). The cruising altitude was controlled to 1.2 m. After the whistle, the MAV flew autonomously, and the experimenter did not control the MAV. In addition, the MAV did not receive any external control signals, including a GPS signal. Next, the MAV hovered for eight seconds (line 2 and 3), and measured the initial odor concentration based on the output value of the analog-digital converter. The initial odor concentration determined the threshold odor concentration for finishing the odor source localization.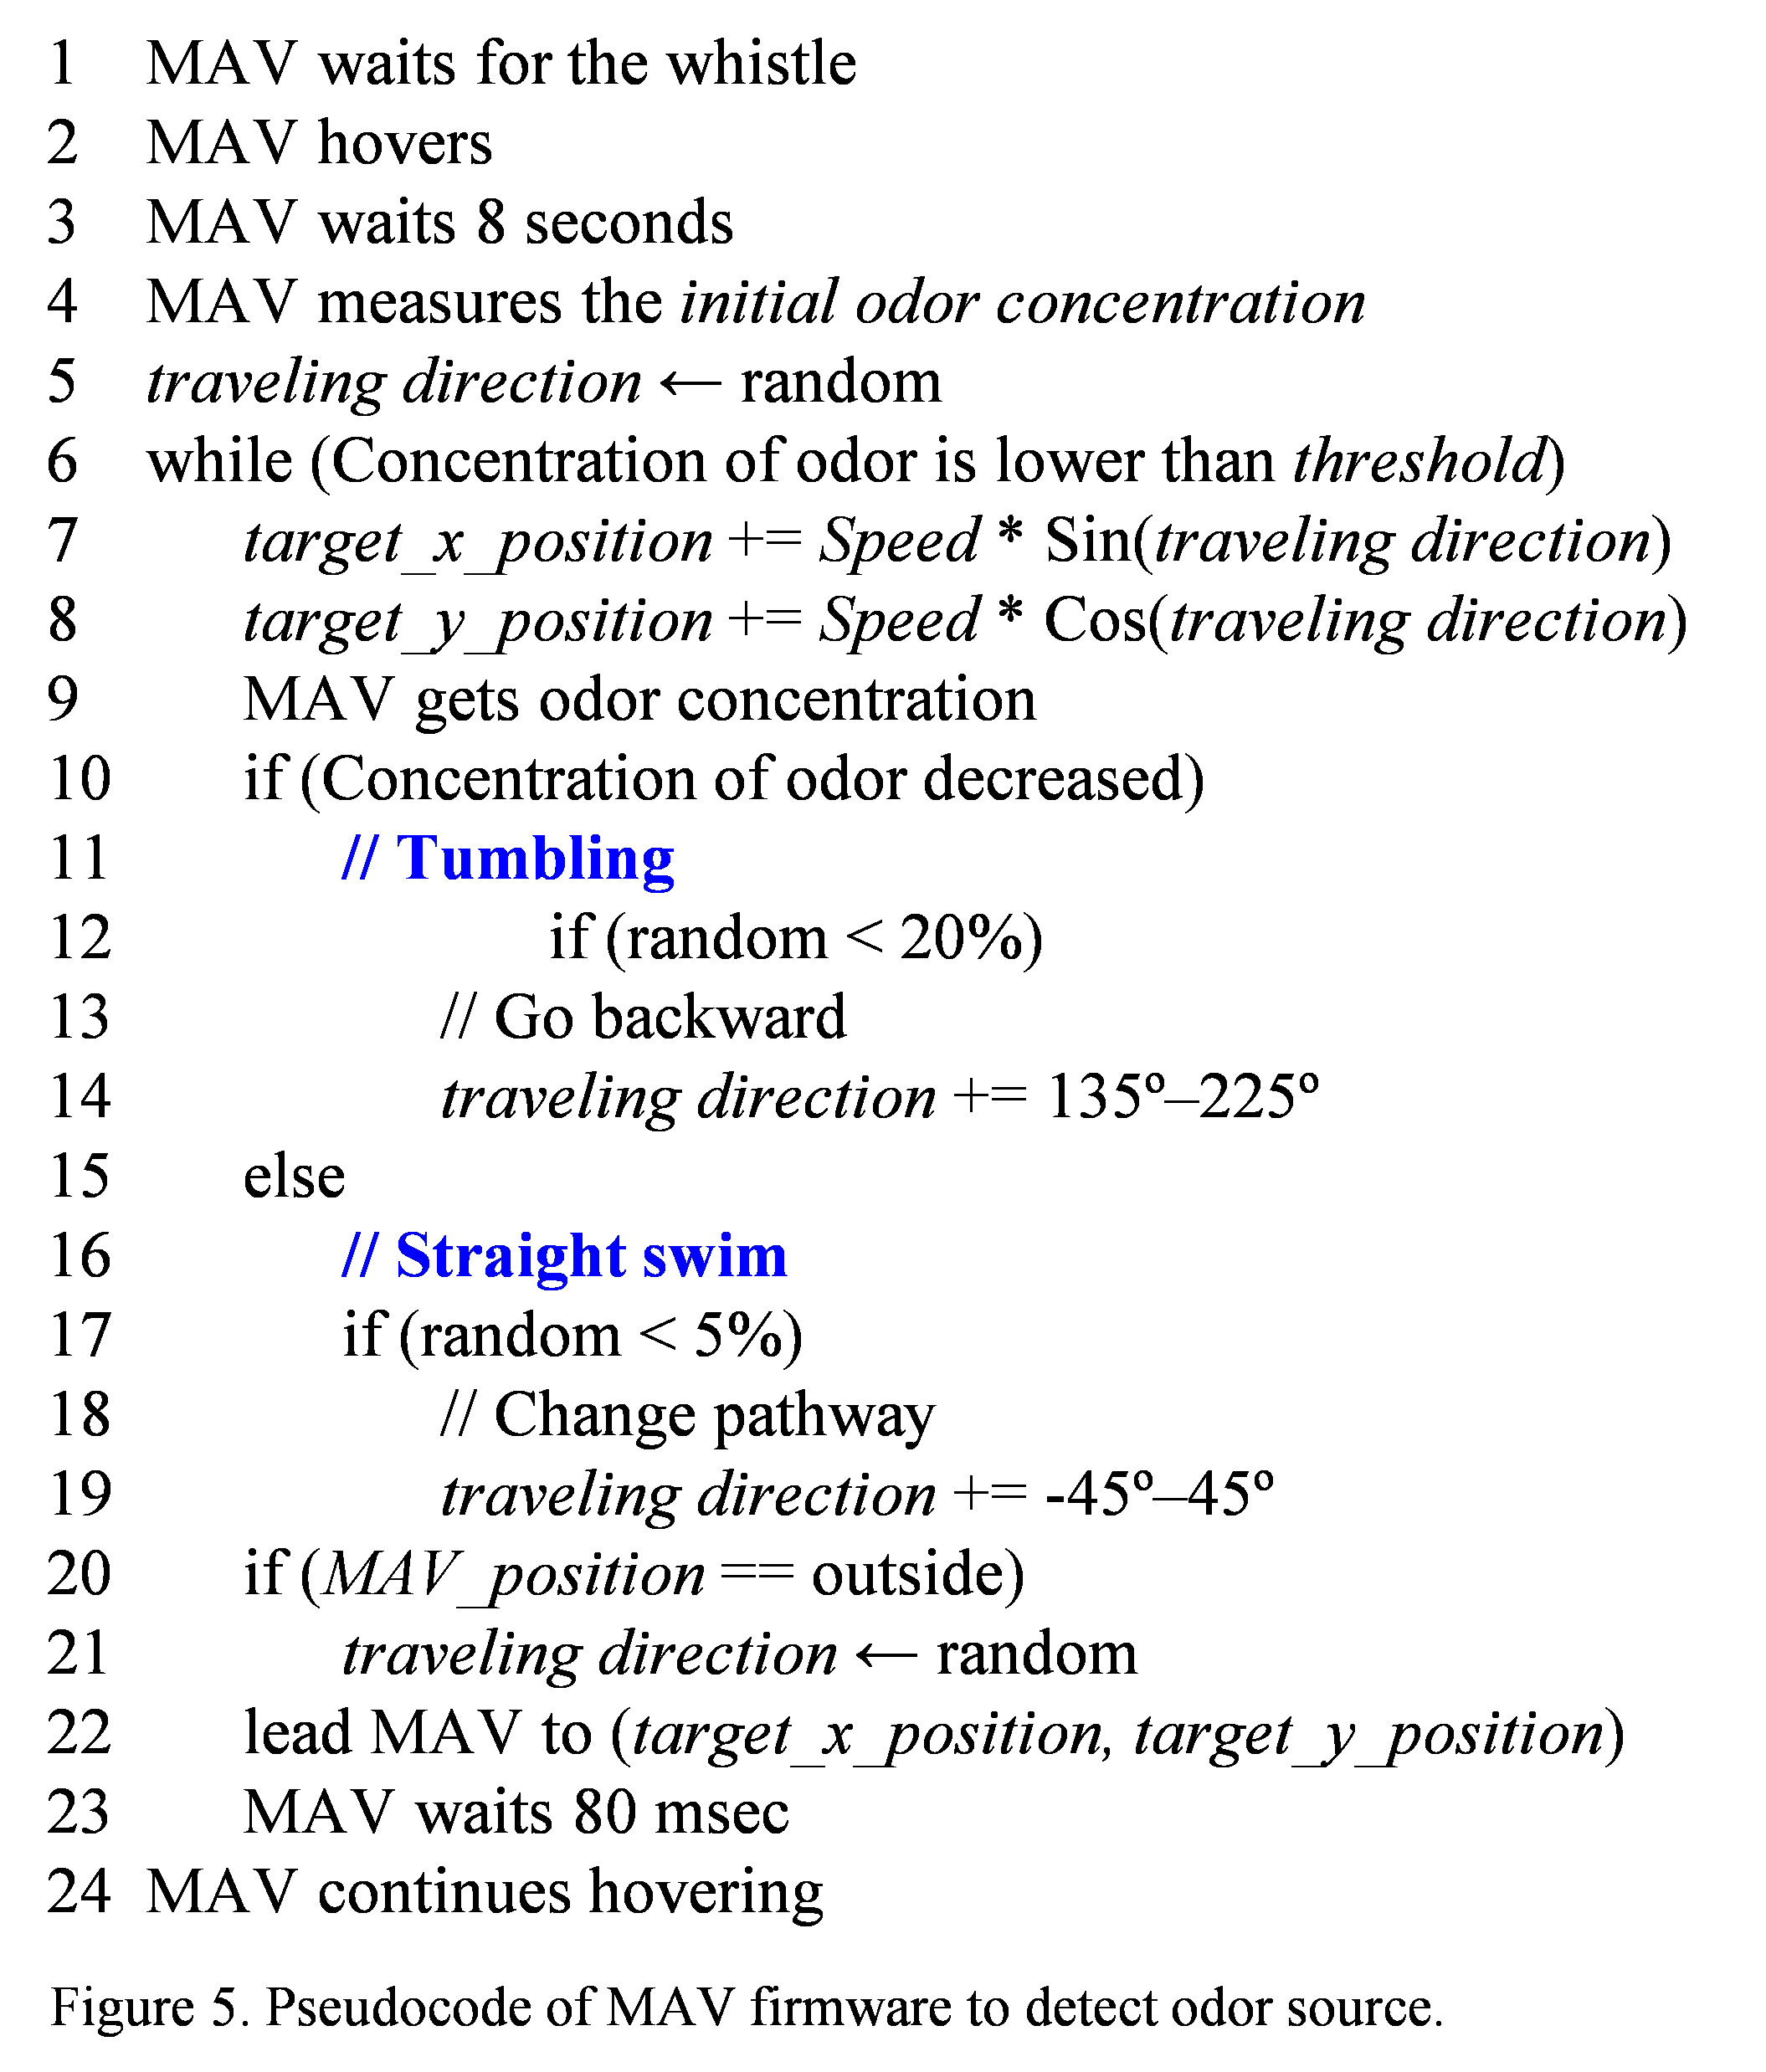
Also, the MAV randomly decided the traveling direction (line 5) from 360° to start odor source localization. If the odor concentration was less than the threshold, the processes of lines 7 to 23 were repeated. In these processes, the target positions were updated based on the traveling direction. The value of Speed was constant. Next, the MAV measured the odor concentration (line 9). If the odor concentration decreased (line 10), the MAV turned back with a probability of 20% (lines 11–15) (tumbling). However, if the odor concentration did not decrease, the MAV went forward (lines 16-19) (straight swim). Please note that the traveling direction made a small change with a probability of 5% (line 17). If the MAV became likely to fly out of the arena based on self-position localization using onboard camera and onboard CPUs, the MAV changed the traveling direction (line 20, 21) randomly from 180°. The size of the arena was limited to 400×700 pixels in the MAV camera, which corresponds to about 3×6 m in real space. The MAV was controlled to travel to the target position (line 22). These processes were repeated every 80 ms (line 23). If the odor concentration exceeded the threshold, the MAV continued hovering in the position (line 24), and notified the experimenter that the MAV found the odor source. The flight time was defined as the search time duration from finishing the initial hovering in eight seconds to starting the hovering near the odor source.
3.2. Comparison in simulation
The bio-inspired algorithm and random-walk algorithms for MAV’s control were compared in a simulation. The time required for odor source localization varied significantly and randomly. Therefore, many trials were required for studying the algorithms. Computer simulations, enabling results to be obtained in a short time, were useful.
In the simulation, the flight area of the MAV was 5×5 m, and the speed was 0.4 m/s. The distance between the MAV and the odor source was set to 1.8 m. We assumed the MAV could detect an odor concentration within 150 cm of the odor source and that the device succeeded in the odor source localization if it approached within 63 cm of the odor source. These values of the distances were determined experimentally.
The bio-inspired algorithm is shown in Figure 5. The random-walk algorithm is based on the bio-inspired algorithm excluding the “Go backward” process (tumble in place). A total of 19 trials were conducted for each algorithm.
The simulation results are shown in Figure 6. The results show the search time based on the bio-inspired algorithm was shorter. The median time required for odor source localization was 17 seconds in the bio-inspired algorithm and 36 seconds in the random-walk algorithm, respectively. The search time based on the bio-inspired algorithm was as much as 47% shorter than that based on the random-walk algorithm. The efficient bio-inspired algorithm was utilized for a real-robot search using the MAV.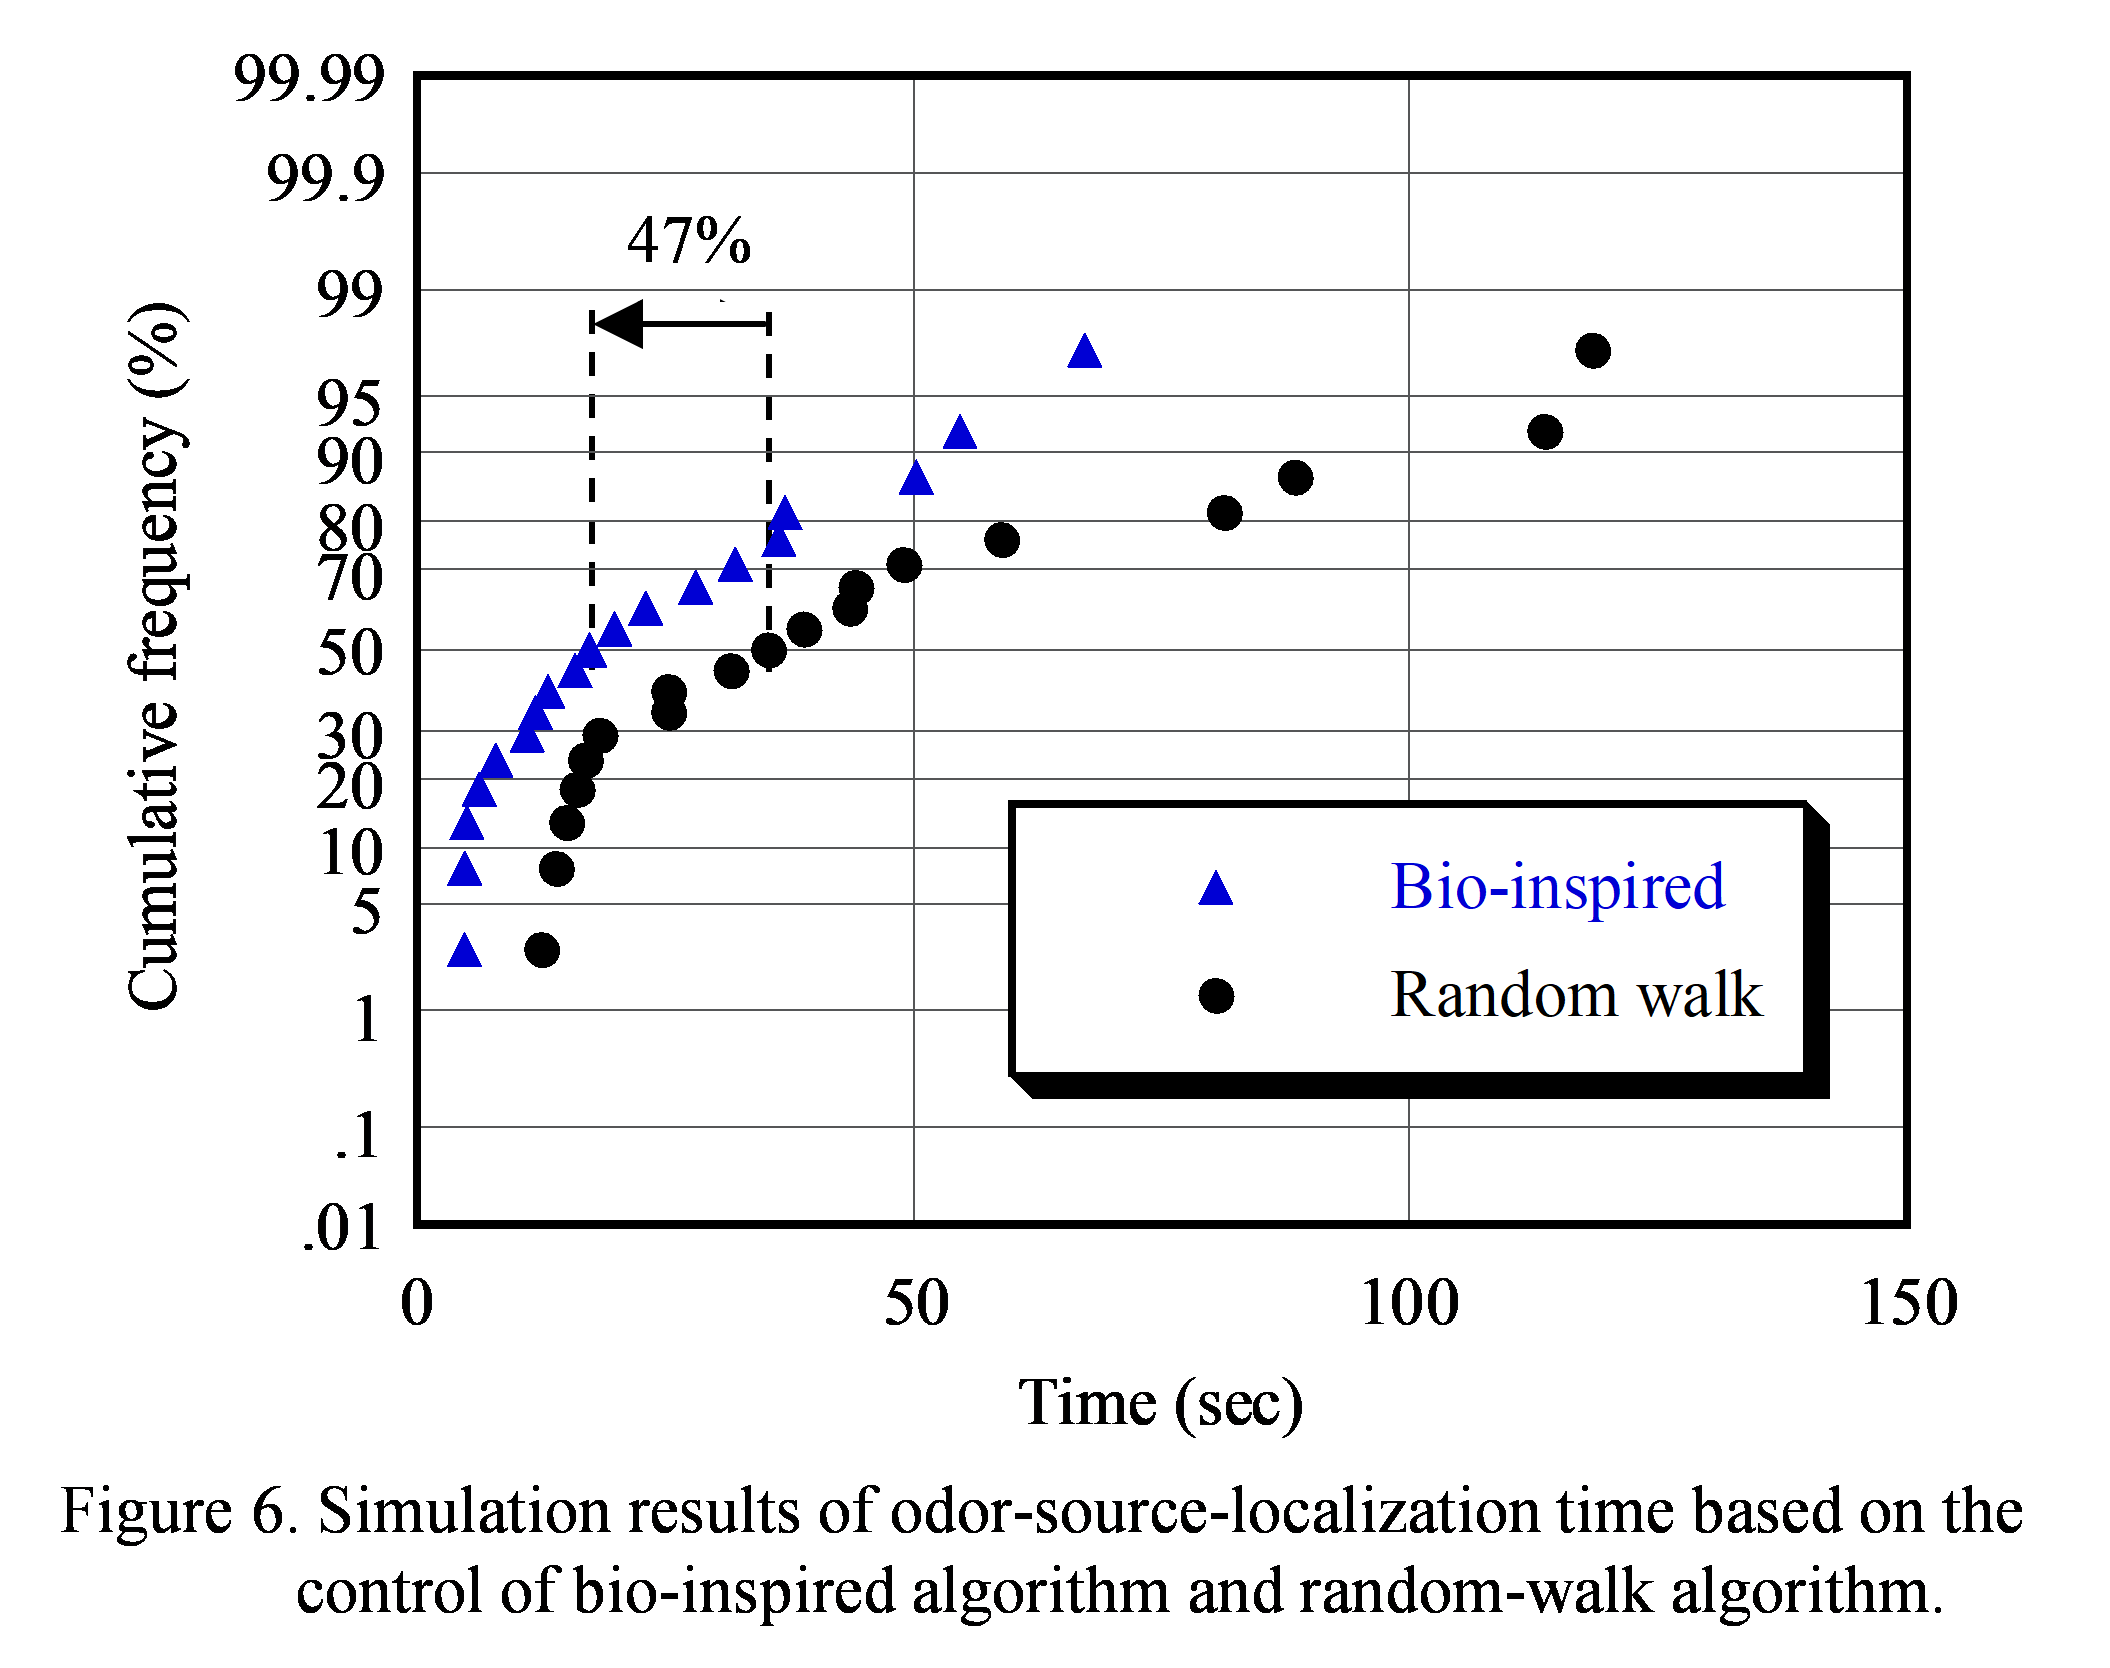
4. Results
The results of the experiments are shown in Table II. In the four experiments, the MAV succeeded in finding the odor source. In the 5th experiments, the MAV flied away from arena. The median distance of the MAV from the odor source was 63 cm. The median flight time required for searching the odor source was 35 seconds.
The results of the first trial are described in detail using Figures 7 to 9. The trajectory of the MAV is shown in Figure 7. The actual position was calculated using the recorded movie taken by the external camera with fisheye lens. The MAV took off from the placed position with various inclination angles due to deviation from the center of gravity in the MAV. The start position shows the position in which search began after taking off and hovering for 8 seconds. The MAV moved from position 1→2→3→4→5 and hovered, which shows that the MAV found the odor source. Figure 8 shows the time variation in the trajectory of the MAV. From 8.2 to 15.5 seconds, the MAV flew over the horizon of the external camera. Figures 8-(c) and (d) show the target position set by the MAV autonomously and the current position recognized by the MAV. At 5.7 seconds, the MAV finished hovering and started to search for the odor source.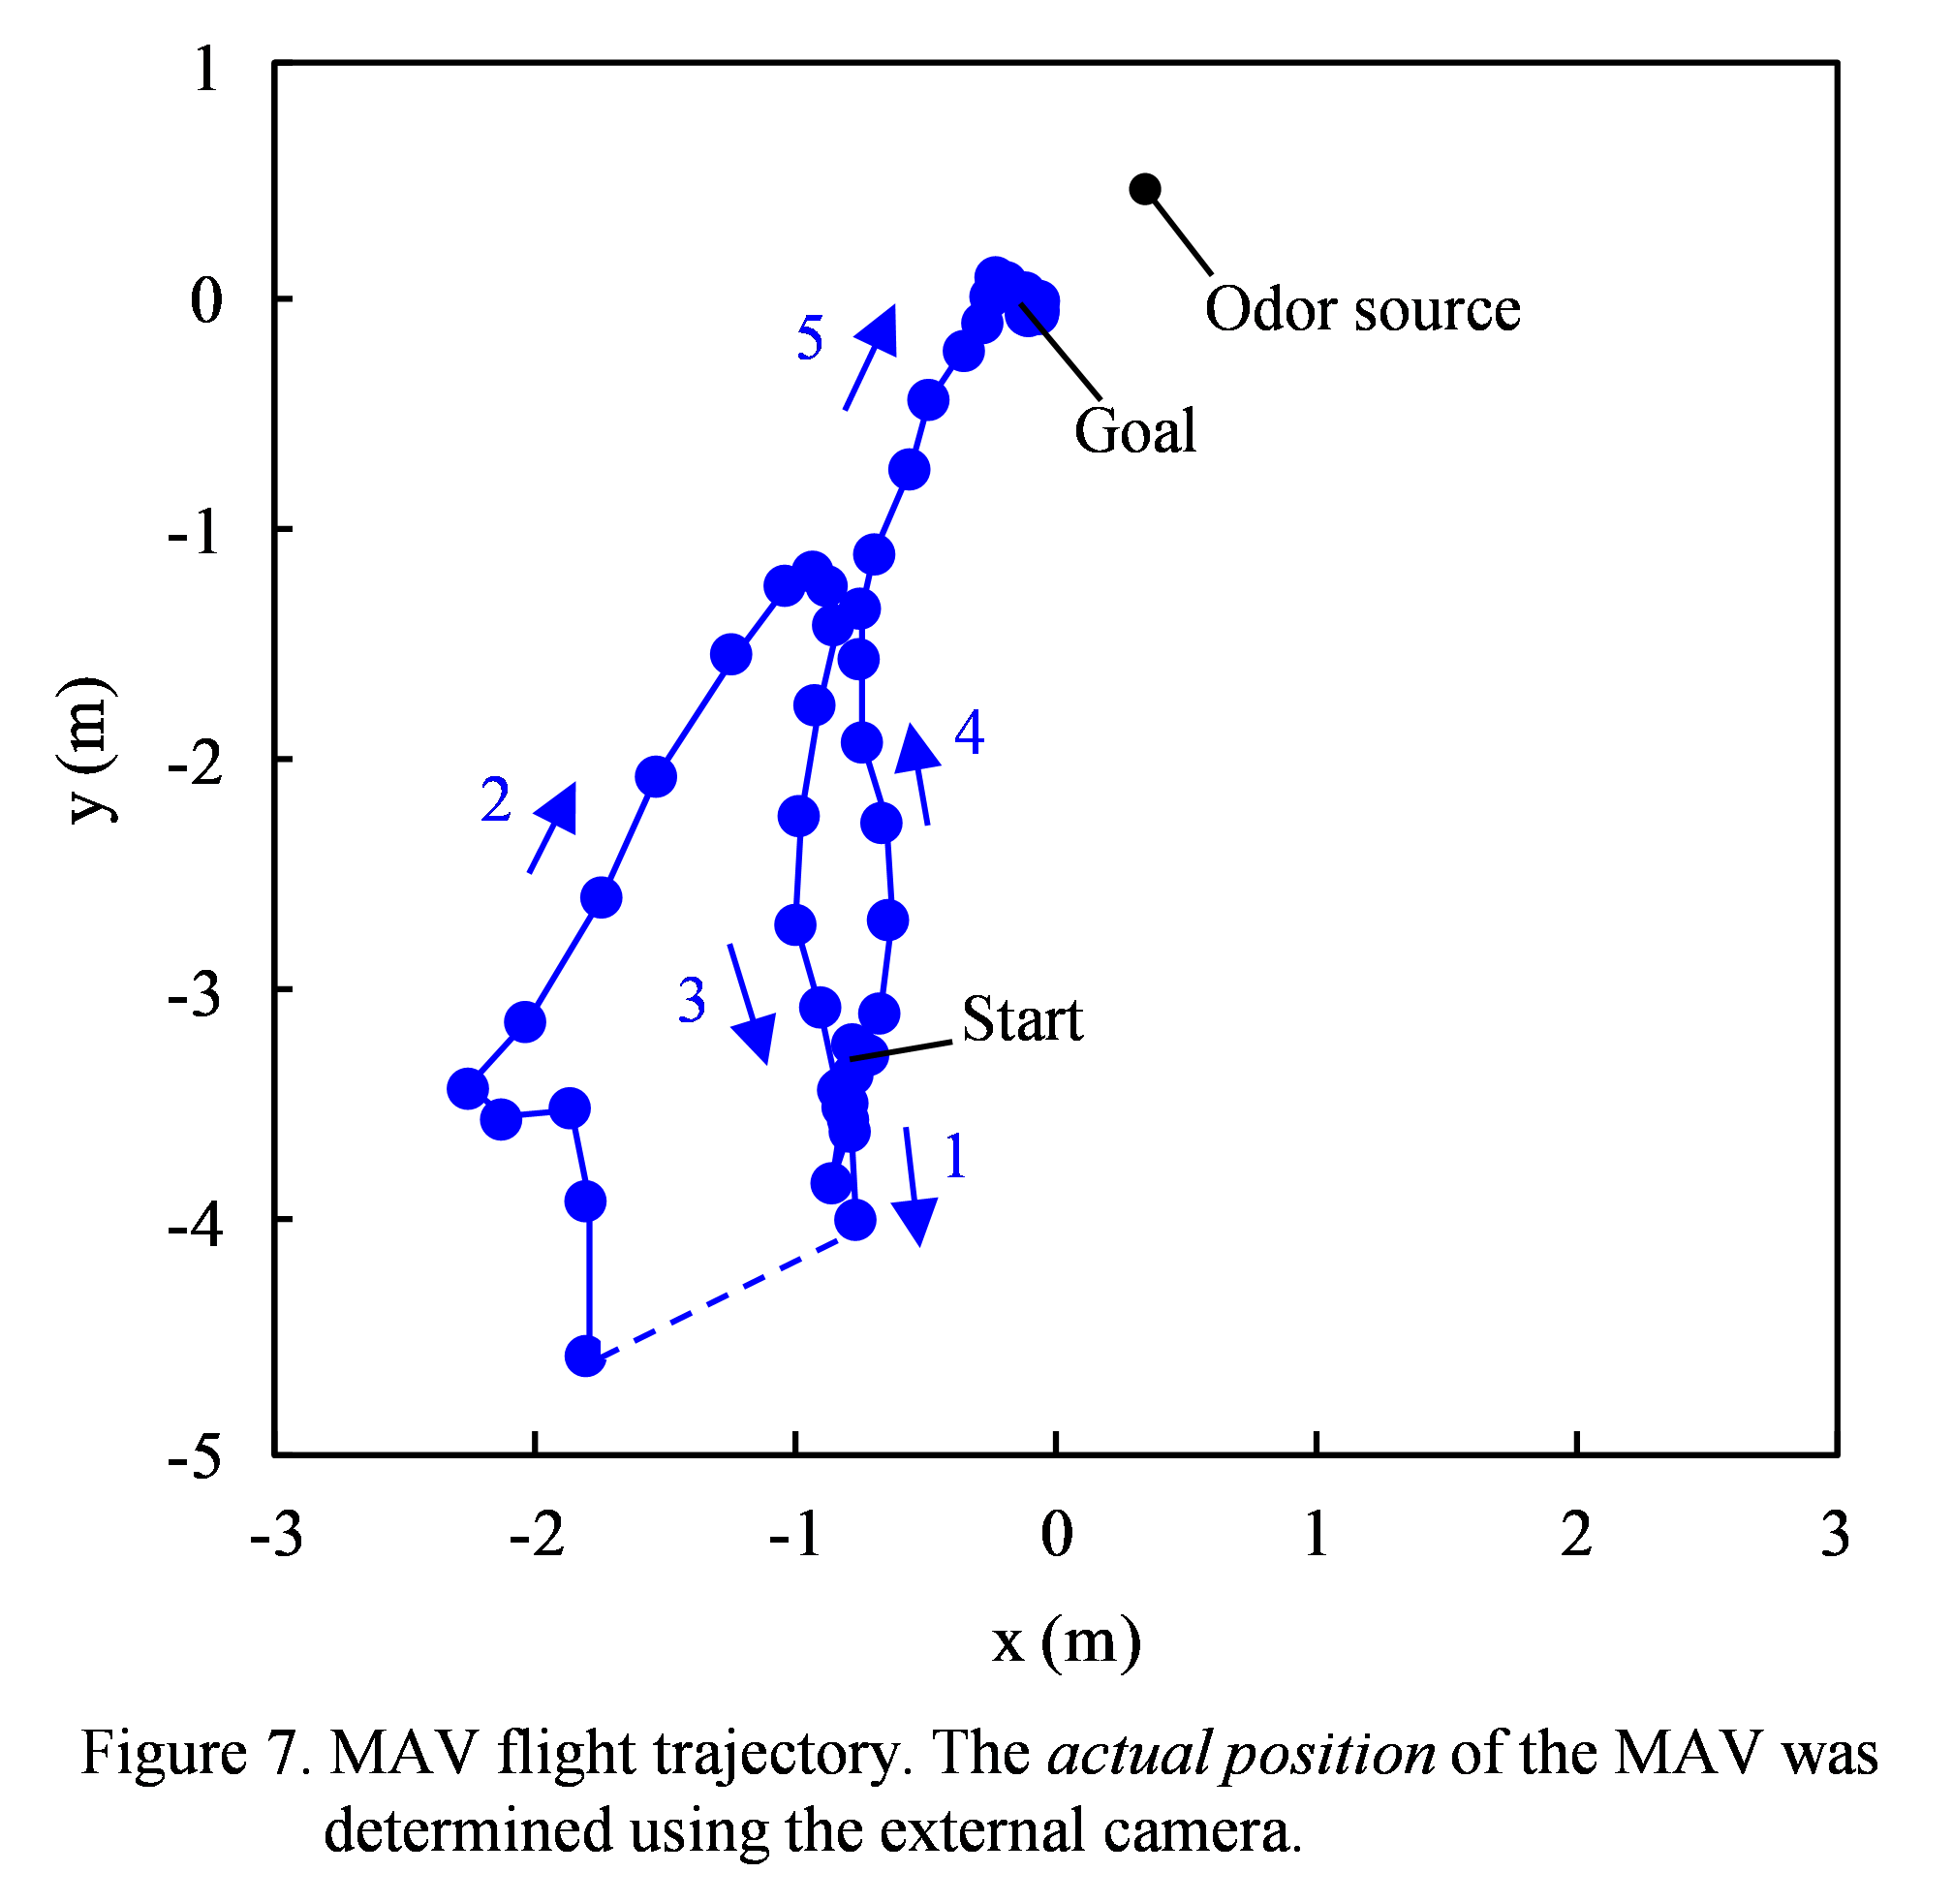
Figure 8 shows the actual position, target position, and current position. The actual position in Figure 8-(a) and (b) was calculated from the footage taken by the external camera. The target position and current position in Figure 8-(c) and (d) were logged by the MAV. Figure 8 shows that the actual position, target position, and current position were attuned to each other.
Figure 9 shows the variation in time of the output voltage of the analog front-end, which indicates the odor concentration. The initial voltage VI at the start of the odor source localization, namely the voltage of the clean air, was 919.3 mV. Therefore, the threshold voltage VT for finishing the search was set to 920.0 mV. Figure 9 shows the time of the MAV turn. The MAV operated the change pathway three times and the go backward three times. At 40.2 seconds, the output voltage exceeded the threshold voltage VT and notified the MAV to finish searching and started hovering.
The deviation distance of 63 cm means this localization method can achieve personal identification because the distance was lower than the personal space of 120 cm [17]. Most people feel discomfort, annoyance, or some level of anxiety when someone or something else encroaches on their personal space. In addition, the deviation distance allows for people to escape from danger found by a MAV. Our results are the first step towards improving social safety and security systems. The reasons for the deviation between the odor source and the position specified by the MAV can be stated as follows: (1) Odor diffusion by the wind; (2) A searching algorithm that terminates the search if the odor concentration exceeds a threshold and does not find the position with highest odor concentration; and (3) Utilization of a proportional and derivative (PD) control method that excludes integration (I) control.
In this experiment, the deviation between the target position and current position, which depends on the travelling direction, was observed. For example, Figure 8-(d) shows that if target position y was larger than the current position y, the deviation increased. The reason is that the estimated center of gravity in the MAV is located behind the ideal position, i.e., the device is weight biased. Therefore, forward moving, which decreases the current position, is slower than backward moving.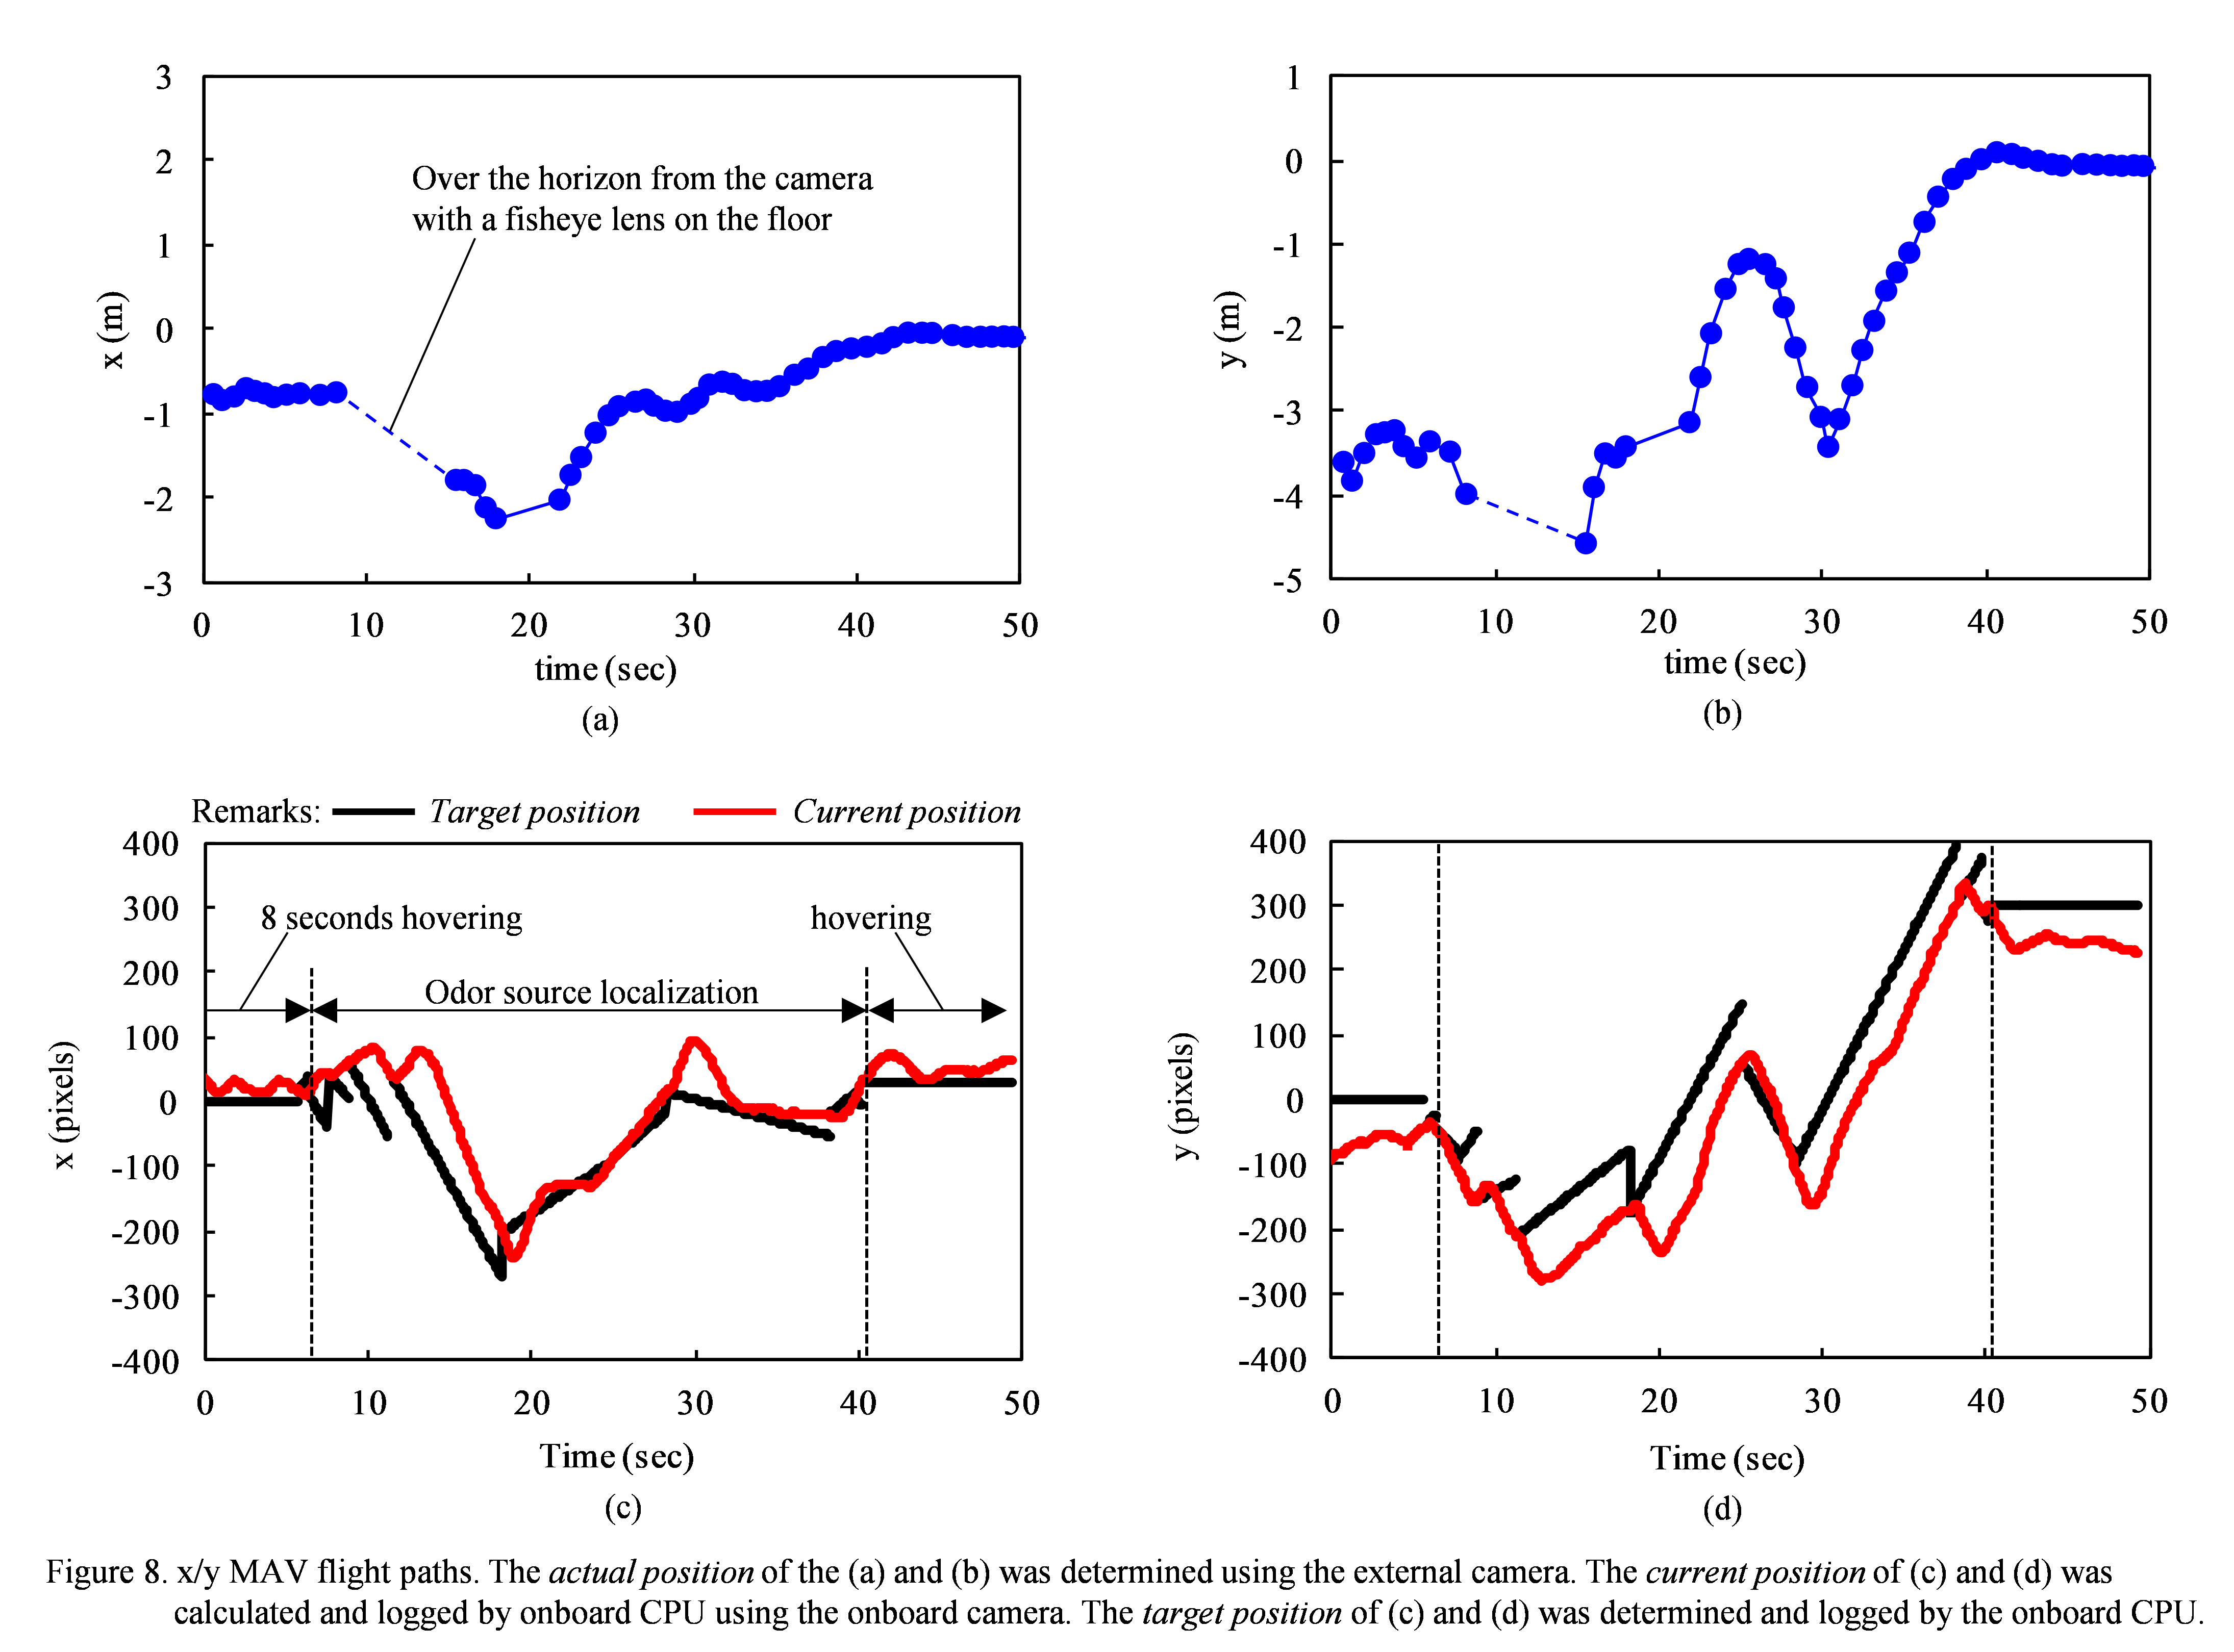
The search time in the real-MAV-experiment results was longer than that in the simulation results. The reason for that was presumed to be the simulation assuming that the velocity of the MAV was constant, whereas the real-MAV-experiment took sufficient time to turn around due to the PD control.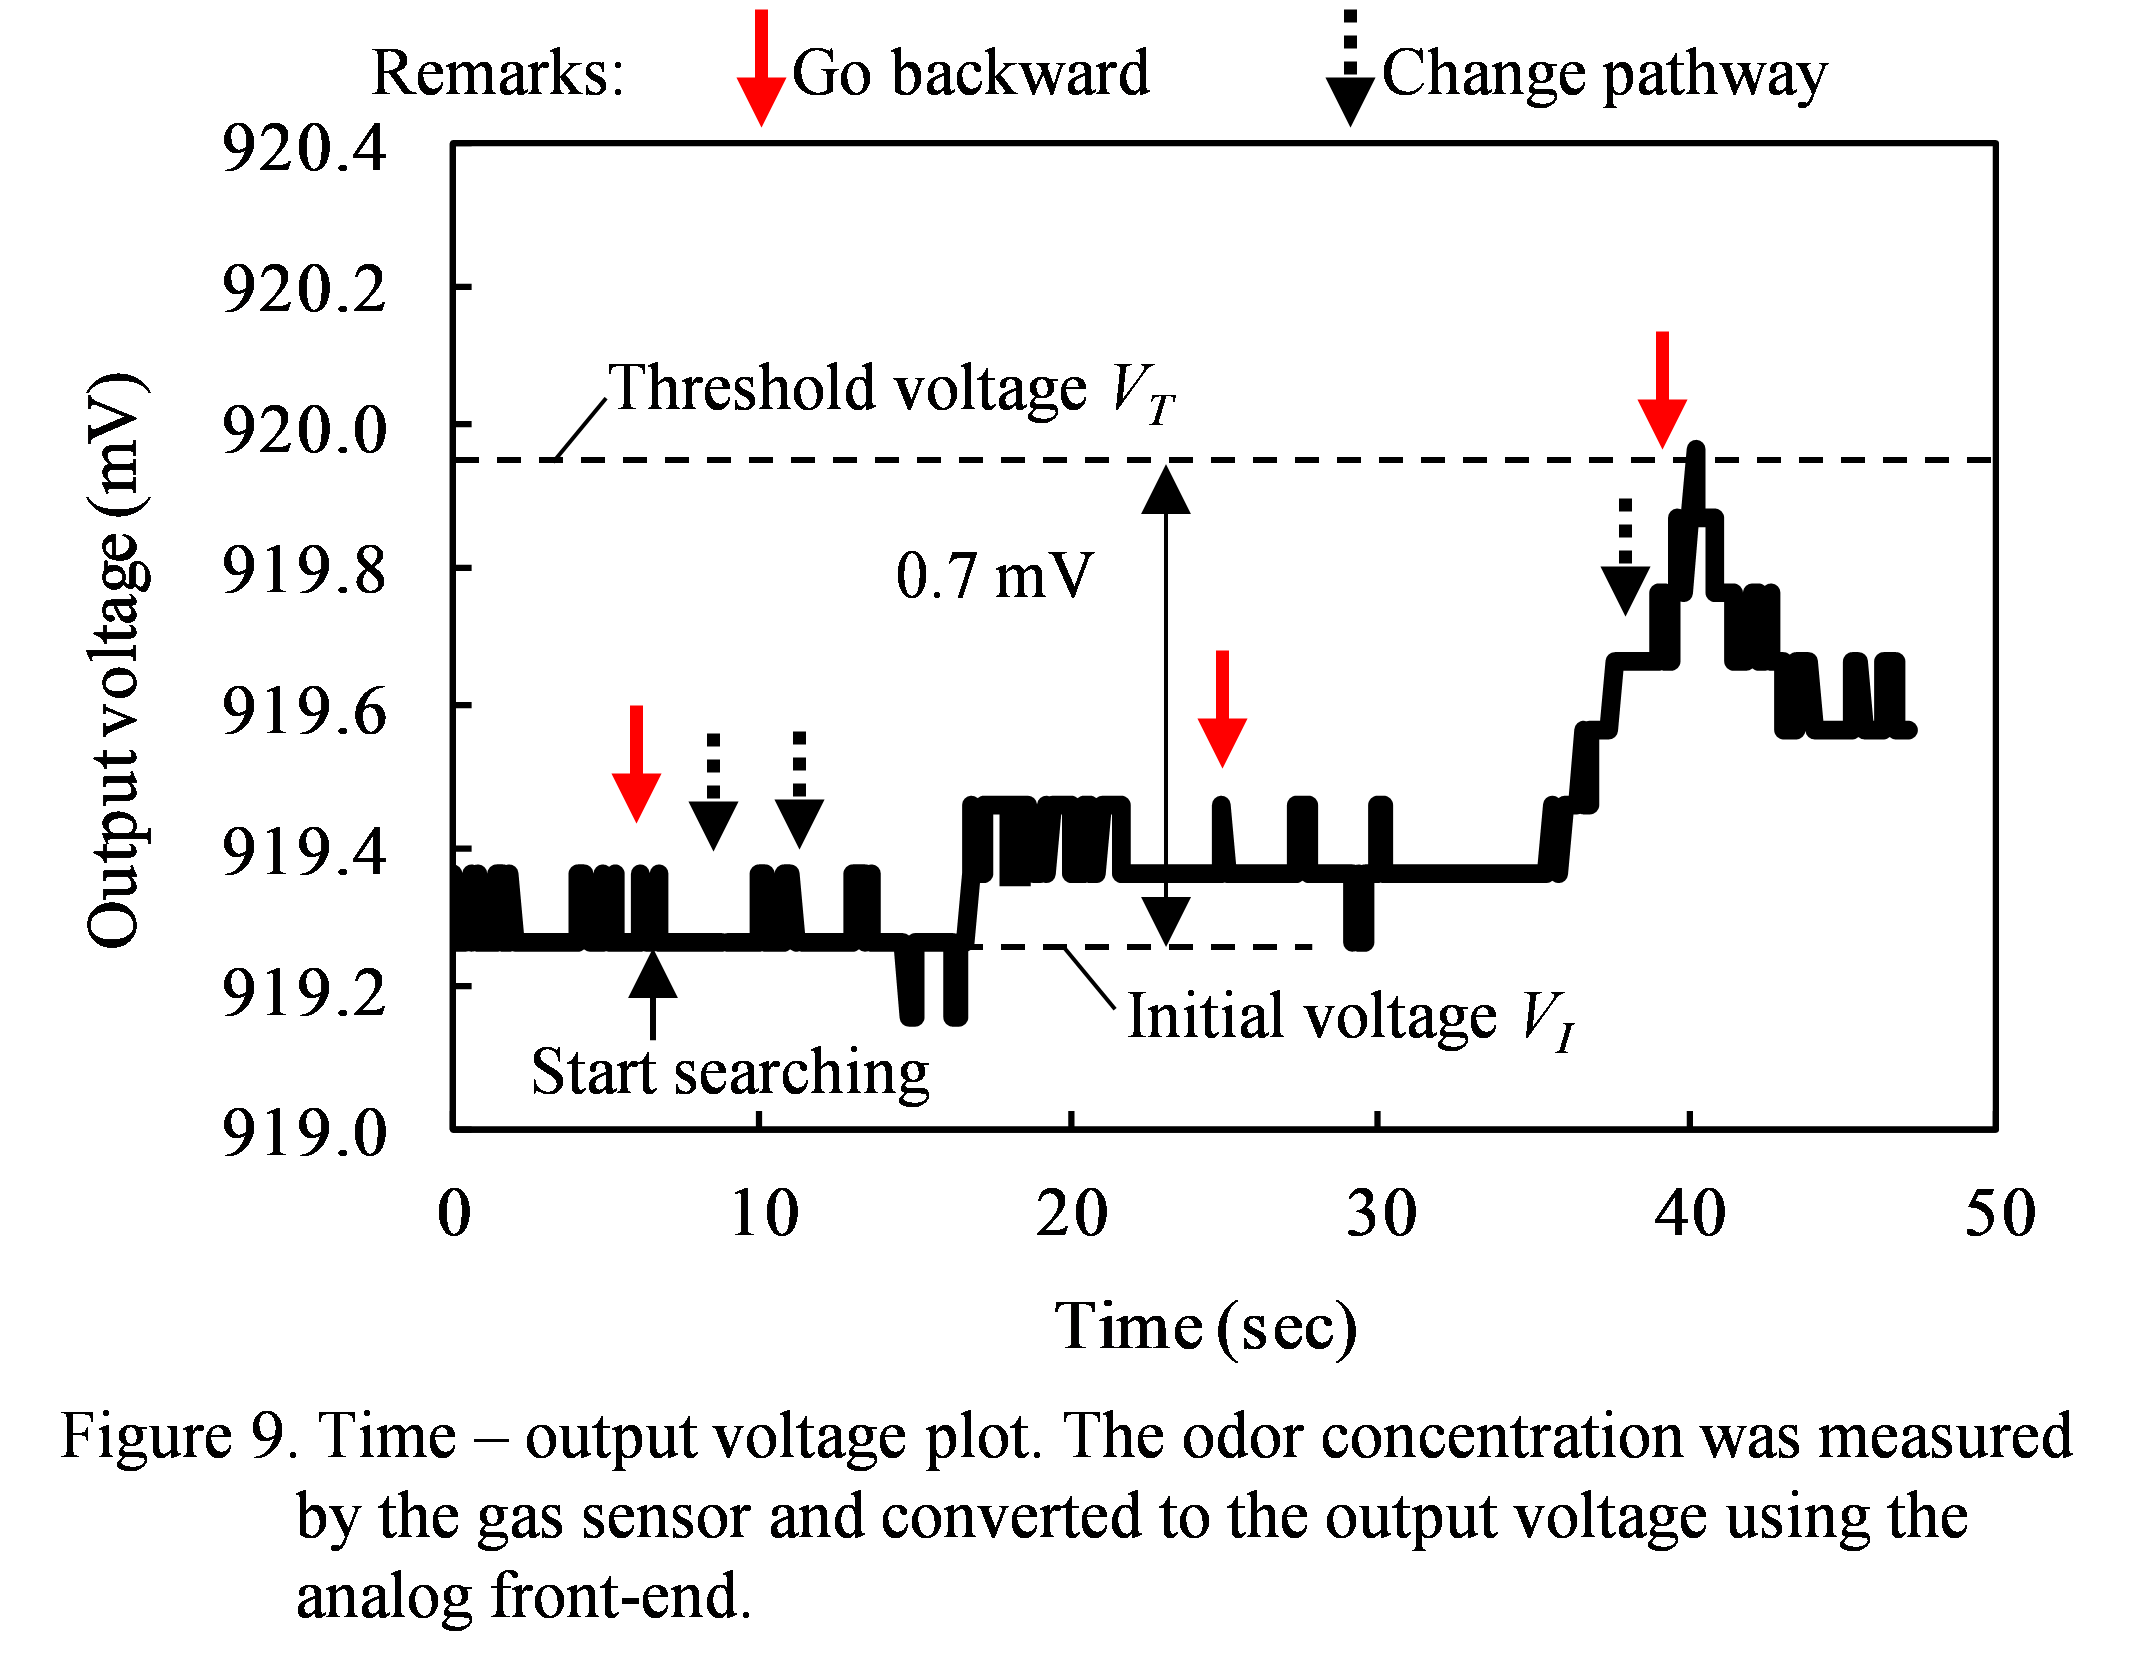
5.
Discussion
The issues obtained by this experiment for constructing a danger warning system to enable a safer and more secure society with MAVs are summarizes below:
- Vision sensing
- MAV’s balancing
- Odor sensing
- Swarm control
In the vision sensing, we used the markers. In the actual safety system, the markers often blocked by pedestrians. Therefore, more robust self-positioning method will be required. Dynamic detection method of crowd was reported [22]. In addition, the 5th experiment was failed by flying away from arena. This reason was the MAV lost the self-positioning estimation. The arena was illuminated by a strong afternoon sun. The bottom camera did not take photo of marker. The sun is thought to have disturbed photography of the pattern of the marker by the bottom camera of the MAV. Therefore, cameras with a larger dynamic range are required. A CMOS imaging array with wide dynamic range pixels was proposed [23]. It is necessary to examine the control method of the wide dynamic range camera for the MAVs.
In the MAV’s balancing, the MAV was attached self-produced odor sensor module and adjusted the balance by battery position. However, it was difficult to achieve a balance it as if the speed was different depending on the direction of movement. Therefore, improvement in exercise performance of MAVs is required.
In the odor sensing, the size of the arena was 7 × 12 m. In the actual system, the size will be much larger (e.g. 100,000 square meters in sports stadium). Therefore, ultra-sensitive odor sensors will be required. Gas sensors with parts-per-quadrillion (ppq) sensitivity have been reported [3].
In the swarm control, in large covered areas without any omission and robust exploration, swarm flight will be required.
In the future, we will improve the location accuracy of the odor source localization using person recognition and increase the amount of information collected to enable MAVs to search for suspects using their built-in cameras [18].
6. Conclusion
Localization of odor source using a MAV with vision and gas sensing was achieved. The MAV used vision and odor localization with ingenuity and succeeded in localizing odor sources like living things can. Our approach does not even require GPS-based control. The location accuracy of odor source localization based on a bio-inspired localization method was 63 cm, enabling individual identification. The MAV was controlled with highly autonomously. An experimenter just blows a whistle, and the MAV starts to hover, to seek odor sources, and to keep hovering during flight near the odor source. The MAV is light-weight and does not cause harm to others even if it accidentally falls. These localization experiments were the first step to a proof of concept for a danger warning system. These results will be applied to the system to enable a safer and more secure society.
- D. B. Walker, J. C. Walker, P. J. Cavnar, J. L. Taylor, D. H. Pickel, S. B. Hall, and J. C. Suarez, “Naturalistic quantification of canine olfactory sensitivity,” Appl Anim Behav Sci, vol. 97, pp. 241–254 (2006)
- A. Lichtenstein, E. Havivi, R. Shacham, E. Hahamy, R. Leibovich, A. Pevzner, V. Krivitsky, G. Davivi, I. Presman, R. Elnathan, Y. Engel, E. Flaxer, and F. Patolsky, “Supersensitive fingerprinting of explosives by chemically modified nanosensors arrays,” Nature Communications, vol. 5, Article number 4195 (2014)
- R. Vishinkin and H. Haick, “Artificially Intelligent Nanoarrays for Disease Detection via Volatolomics,” IEEE International Electron Devices Meeting (IEDM 2015) 33.4 (2015)
- K. Kurotsuchi, M. Tai, and H. Takahashi, “Vision-based Autonomous Micro-Air-Vehicle Control for Odor Source Localization,” International conference on mechatronics and machine vision in practice (M2VIP 2016)
- P. P. Neumann, V. H. Bennetts, A. J. Lilienthal, M. Bartholmai, and J. H. Schiller, “Gas source localization with a micro-drone using bio-inspired and particle filter-based algorithms,” Advanced Robotics, vol. 27, No. 9, pp. 725–738 (2013)
- AT Hayes, A Martinoli, and RM Goodman, “Distributed Odor Source Localization,” IEEE Sensors Journal, vol. 2, pp. 260–271 (2002)
- H. Jiu, J. Li, S. Pang, and B. Han, “Odor plume source localization with a Pioneer 3 Mobile Robot in an indoor airflow environment,” IEEE Region 3 South East Conference (SoutheastCon 2014) (2014)
- G. Ferri, M. V. Jakuba, A. Mondini, V. Mattoli, B. Mazzolai, D. R.Yoerger, and P. Dario, “Mapping multiple gas/odor sources in an uncontrolled indoor environment using a Bayesian occupancy grid mapping based method,” Robotics and Autonomous Systems, vol. 59.11, pp. 988–1000 (2011)
- A. Dhariwal, G. S. Sukhatme, and A. A. G. Requicha “Bacterium-inspired robots for environmental monitoring,” Proceedings of IEEE International Conference on Robotics and Automation (ICRA ’04), vol. 2, pp. 1436–1443 (2004)
- H. Ishida, H. Hayashi, M. Takakusaki, T. Nakamoto, T. Moriizumi, and R. Kanzaki, “Odour-source localization system mimicking behavior of silkworm moth,” Sensors and Actuators A, vol. 51, pp. 225–230 (1996)
- A. Liberzon, R. Gurka, A. Harari, and G. Zilman, “Robust moth olfactory search algorithm based on dispersion of pheromone puffs,” arXiv:1310,1411 (2013)
- Y. Zou and D. Luo, “A modified ant colony algorithm used for multi-robot odor source localization,” Advanced Intelligent Computing Theories and Applications. With Aspects of Artificial Intelligence 5227, pp. 502–509 (2008)
- R. Konomura and K. Hori, “Phenox: Zynq 7000 based quadcopter robot,” in 2014 International Conference on ReConFigurable Computing and FPGAs (ReConFig14) (2014)
- Tetsuya J. Kobayashi, “Implementation of dynamic Bayesian decision making by intracellular kinetics,” Physical Review Letters 104, 228104 (2010)
- J. Murlis, J. S. Elkinton, and R. T. Carde, “Odor plumes and how insects use them,” Annual review of entomology, vol. 37, pp. 505–532 (1992)
- PHENOX LAB: Phenox, http://phenoxlab.com/?page_id=601
- Edward Hall, “The hidden dimension,” Anchor Books (1966)
- K. Al-Mutib, M. Emaduddin, M. Alsulaiman, H. Ramdane, and E. Mattar, “Motion Periodicity based Pedestrian Detection and Particle Filter based Pedestrian Tracking using Stereo Vision Camera,” in Mechatronics and Machine Vision in Practice (M2VIP), 19th International Conference, pp. 32–37 (2012)
- R. B. Bourret and A. M. Stock, “Molecular information processing: lessons from bacterial chemotaxis,” Journal of Biological Chemistry 277.12, pp. 9625–9628 (2002)
- G. Klein and D. Murray, “Parallel Tracking and Mapping for Small AR Workspaces,” International Symposium on Mixed and Augmented Reality (ISMAR’07, Nara) (2007)
- E. Rosten, R. Porter, and T. Drummond, “Faster and better: A machine learning approach to corner detection,” IEEE Trans. Pattern Analysis and Machine Intelligence, vol. 32:105119 (2010)
- H. Chebi, D. Acheli, and M. Kesraoui, “Dynamic detection of abnormalities in video analysis of crowd behavior with DBSCAN and neural networks,” Advances in Science, Technology and Engineering Systems Journal (ASTESJ), vol. 1, No. 5, pp. 56-63 (2016)
- S. Decker, R. D. McGrath, K. Brehmer, and C. G. Sodini, “A 256/spl times/256 CMOS imaging array with wide dynamic range pixels and column-parallel digital output”, IEEE Solid-State Circuits (JSSC), vol. 33, Issue 12 (1998)