A Microwave Reflectometer Prototype for Detection of Body Through the Rubble of Collapsed Buildings
A Microwave Reflectometer Prototype for Detection of Body Through the Rubble of Collapsed Buildings
Volume 2, Issue 3, Page No 1092-1106, 2017
Author’s Name: Syed Daniyal Ali Shaha)
View Affiliations
Department of Electrical Engineering, COMSATS Institute of Information Technology (CIIT), 54810, Lahore, Pakistan
a)Author to whom correspondence should be addressed. E-mail: 9daniyal@gmail.com
Adv. Sci. Technol. Eng. Syst. J. 2(3), 1092-1106 (2017); ![]() DOI: 10.25046/aj0203139
DOI: 10.25046/aj0203139
Keywords: FMCW, ISM Band, MATLAB, Microwave, Radar, Reflectometer, Signal Processing, Transceiver

Export Citations
There is a growing interest in using radio frequency in imaging for problem solving in situational awareness, surveillance, search and rescue operations, and screening for security. This has been fetched from recent development in addition to innovative technologies in microwave radar imaging applications. Despite the fact that no new phenomenology is exposed in this field, the prospects to eventually realize systems that operate under adverse weather conditions, interferences and obscuration has prompted newer prospects. However, the existing systems for RF imaging are not easy to afford and are not easily available and there is a need to make affordable imaging available to support people’s lives. The effort provided an economic, compact and easy solution for human body detection applications using Radio Frequency (RF) by designing and developing a microwave transceiver that can give data in a suitable form for further signal processing and data acquisition. In this project, different types of RF imaging techniques and the most feasible techniques that may be employed for under debris search and rescue operations were studied. Link budget analysis and software simulations were conducted. Individual components along with the transmitting and receiving chains were tested on VNA. Gain and radiation pattern of antennas was determined in anechoic chamber. During this project the performance of transceiver, regarding its detection ability, range resolution, signal to noise ratio (SNR) etc., were also investigated. At the end a prototype FMCW transceiver is given that is able to detect human body under debris or behind a walls whether living or dead, which is effective at transmitting as well as receiving the reflections and giving data in an audio format for further signal processing.
Received: 29 April 2017, Accepted: 24 June 2017, Published Online: 16 July 2017
1. Introduction
This paper is an extension of work originally presented in 19th IEEE International Multi Topic Conference (INMIC 2016) [1]. The initial scope of the project was to build antennas and conduct software simulations to define the parameters on which a transceiver could be built like type of transceiver design that could be employed, operating frequency, transmit power and bandwidth etc. Furthermore, the work was extended to develop and test an economical and simple transceiver system to demonstrate the concept and feasibility of the prototype. Not all of the initial proposals could come to reality but a transceiver reflectometer was developed to demonstrate the feasibility of proposal. An Analog to Digital Converter (ADC) and a Data Acquisition Device (DAQ) used for conducting experiments and collecting data. There was no dedicated electronic hardware used for data collection and generating image, which reduced the complexity of the technical requirements, but imposed certain constraints on the capability of the system. This project was to provide foundation research and work for more complex system to be built in the future. Figure-1 has been presented for thorough understanding of the project and an idea of what is being conceived through the project. The project outcome may be transformed for commercial use.
The data given by radar contains the bearing and also range to the Transceiver and the body which is buried under debris. Hence, it is employed in a number of areas in which the requirement for this kind of locating is vital. Pakistan is located at the north far western region of the Indian subcontinent which also overlaps with the Indian as well as the Eurasian tectonic plates. The Sindh and also some of the regions in Punjab province rest on the north western nook of the Indian tectonic plate, whereas, Baluchistan province as well as the vast majority of the Khyber Pakhtunkhwa exists within the Eurasian tectonic plate which primarily makes up the Iranian plateau. The Northern Regions as well as Azad Kashmir rests mostly in Central Asia besides the edge of the Indian tectonic plate, therefore, are vulnerable to ferocious earthquakes exactly where both the tectonic plates collide. Due to the lack of advanced equipment a lot of lives are lost during these natural disasters. If rescue response teams are able to equip themselves with devices that are able to detect life under debris, the amount of lives that can be saved by this device are unimaginable. The objective is to make a microwave transceiver that is able to detect living beings under debris and is man pack handheld.
The capability to discover moving objects inside a structure or behind the wall [2] is also one of the noteworthy applications of the RF transceiver. The transceiver delivers users with situational knowledge for an operational benefit. The through the wall detection capabilities are priceless for both equally the Armed forces and Law Enforcement agencies associated with tactical operations in Urban Terrain. Military Operations in Urban Terrain (MOUT) necessitates successful attainment of military aims. These capabilities significantly improve the pre-planning and also execution of military operations.
An imaging transceiver model comprises a wireless transmitter that produces radio waves in specific direction. Whenever, these waves come in contact with a physical entity they are generally echoed and also dispersed in lots of different directions. The objective is to make some of these radio waves echo back form a living body the place where channel do not favor optical visibility. A Figure 1 of such a transceiver system is shown below which is being conceived for the project.
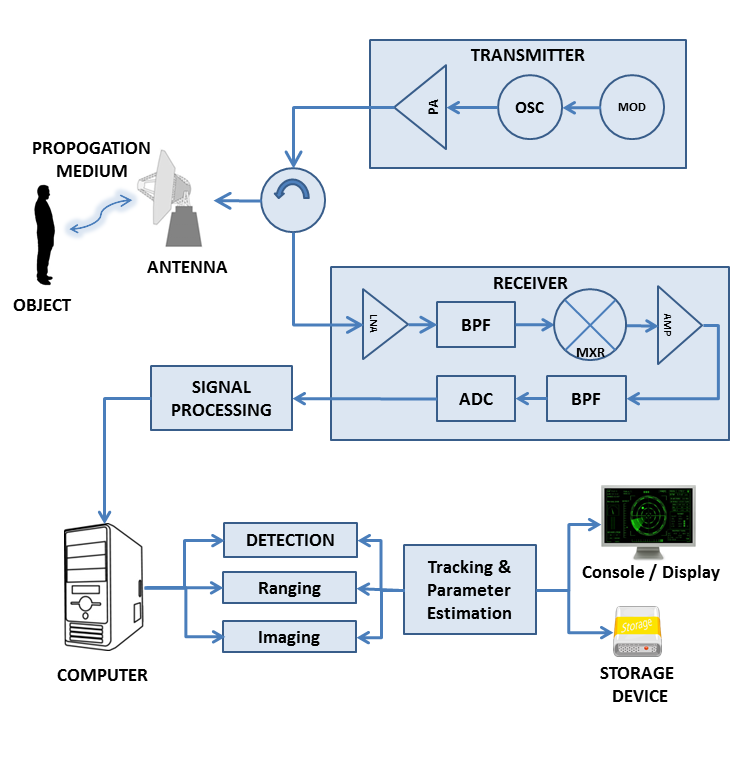 Figure 1 – Overview of Generic Transceiver System.
A link budget calculation of all of the gains and losses of the components and parts of transceiver will be presented and also analyzed. Additionally, the losses inculcated as a result of propagation through the channel would certainly be taken into consideration. Albersheim’s equation [3] is used to figure out the needed Signal to Noise Ratio (SNR) for the particular detection and also false alarm probabilities as well as the maximum detectable range for monostatic radar [4] is going to be determined and investigated for the desired range of operation. Comparing between different types of radar techniques, specifically Pulse Doppler (PD) as well as Continuous Wave (CW) [5], the most appropriate technique is going to be implemented for transceiver design. The true to life differences between them may very well rely more upon the compromises than the hypothetical attainable. Antenna selection as well as design is among the most crucial areas of a wireless system for dependable Radio Frequency (RF) communication. One grave constraint using this elucidation is that the Electromagnetic (EM) waves are emitted in an Omni direction pattern, so the quantum energy in the bearing being studied is a very trivial portion of that radiated energy from the antenna. To obtain an acceptable amount of received power, the transmitting antenna should be directional.
1.1. Project overview
To identify the issues in the creating of RF system the properties of such system were investigated along with the environment. Receiver as well as transmitter architectures were studied and also their viability in existing Integrated Circuit (IC) solutions for instance superheterodyne (superhet) technology [6], direct detection and power meters. The operating frequency selected for the project is in industrial, scientific, and medical radio band (ISM band) exactly 2.4 GHz range [7], and follows maximum transmitting output power limit of 30 dBm or simply 1 watt in accordance with the government regulations [8]. In addition to mere component accessibility numerous other issues were also well thought-out while developing and planning this system. Field testing of the prototype was carried out and outcomes are reported. It was summarized by looking at upcoming future directions in RF microwave transceiver concepts and improvements that can be made to the existing system.
2. Design Objectives
There is certain required criterion that need to be met in order to work in conditions the device is intended to operate and function. There are also certain government regulations that need to be met so that the equipment in utility is within the legal boundaries.
2.1. Low cost
The transceiver needs to be low cost, it needs to be easily affordable for governmental and non-governmental organizations, for a poor country with low economic conditions and meagre resources.
2.2. Compact size
The transceiver needs to be compact in size so that it can be easily moved and operated in affected areas like a region struck with earthquake.
2.3. Easy to operate
The transceiver needs to be user-friendly and easy to learn, as complex equipment requires specialized training which is not easy to resource and afford.
2.4. Low maintenance
Transceiver should be low on maintenance as higher maintenance costs needs higher affordability.
2.5. Low operation cost
Transceiver need to have lower operating costs as it matters to buyers why they are operating in large quantities.
3. Regulations requirements
The PTA (Pakistan Telecommunication Authority) guidelines for unrestricted wireless apparatus functioning in the ISM frequency bands [9] is restricted. The ISM RF frequency bands were initially reserved for electromagnetic frequency that is generated by industrial, scientific as well as medical (ISM) apparatus. In order to abide by these rules, the equipment bandwidth will remain within the ISM Band of operation particularly 2.4735 to 2.4835 GHz which also gives us the bandwidth availability of 10 MHz only. Max wireless radiated power to be fed to the antennas should be less than 30 dBm or 1 watt. The obligation for remaining within all these radiated power restrictions falls on the manufacturer. Even if the equipment is professionally built by specialists, or in case if it is self-designed. In order to remain within these regulations, the maximum wireless transmitter output power to be fed to the antennas should not exceed 30 dBm and Effective Isotropic Radiated Power (EIRP) should not exceed 30 dBm. Keeping this in mind it was decided to keep the maximum transmit power at 29 dBm or 794 mW.
4. Zero IF Design
A Direct Conversion Receiver also referred to as Zero Intermediate Frequency (IF) Receiver, synchrodyne or even homodyne is a RF receiver model that down converts the arriving RF signal making use of synchronous demodulation detection which is driven with the help of oscillator, the frequency of which is equal to or close to the transmitted frequency of the expected signal [10]. Whereas, in the case of regular superheterodyne receiver in which this really is achieved after transformation to an IF (Intermediate Frequency).
The simplicity of carrying out merely a single conversion of frequency decreases the elementary RF circuit complication, however, other concerns relating to dynamic range do ensue. In its unaltered form it turned out unsuitable to obtain Amplitude Modulation (AM) as well as Frequency Modulation (FM) radio signals without employing a Phase Locked Loop (PLL). Even though these kinds of engineering problems realized this approach rather unrealistic when the technique was in its initial development stages in 1930’s. Present technological innovations and software defined radio have particularly re-established its use in various areas such as certain consumer based equipment [11].
4.1. Zero IF Design
Even though the superhet method happens to be effective receiver architecture, it really is nowadays finding competition from Direct Conversion Receiver (DCR) technique also known as the Zero IF receiver (Figure 1) [6]. Here, the Local Oscillator (LO) frequency is placed very near to RF transmitted frequency of the acquired signal. The mixed output is directly at baseband, and also there is absolutely no IF stage required.
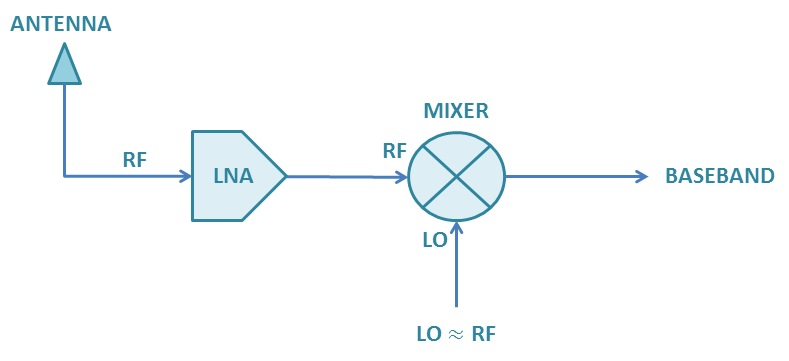 Figure 2 – Block Diagram of Zero If Design.
The RF signal is fed into the mixer in Direct Conversion Receiver the same way as in superheterodyne receiver [6]. In contrast to the superhet, the frequency of LO does not have an offset from RF frequency. The outcome is a demodulated baseband output signal just like the one obtained from a superheterodyne technique employing synchronous detection following an IF stage [10]. To put it differently, the down conversion is performed in just one frequency transformation. This prevents the complication of superhet like image rejection problems, IF stages and a couple of frequency conversions.
Despite the fact that this technique decreases the basic circuit complication in principle, it places serious requirements on almost all stages, as well as noise, stability, dynamic range, tuning range, and distortion. For certain very carefully chosen as well as developed purposes, ICs could make Zero IF receivers competitive or even better than the superhet with its IF stages.
4.2. Technical Problems
To come at par with the efficiency of the superheterodyne down conversion, several of the features typically sorted out by the IF phase needs to be achieved at baseband. Since there are no IF amplifiers with high gain, therefore, by making use of Automatic Gain Control (AGC) the power level at baseband output contrasts over a very wide dynamic range. This really is major engineering challenge which restricted the feasibility of the model. An additional concern is the incapability of the model to employ envelope detection of amplitude modulated signals. Hence, reception of AM or FM signals directly requires locking of the phase of the local oscillator to the transmitted frequency, an even more challenging job as compared with the more widely used envelope detector at the output port of an IF implementation stage in superheterodyne model. Nevertheless, this may be prevented when it comes to a Direct Conversion model making use of quadrature detection and after that Digital Signal Processor (DSP) is employed [12]. Making use of software defined radio approach, the two quadrature outputs could be processed so that any kind of demodulation can be carried out as well as filtering on baseband signals from frequencies around the LO frequency [12]. The significant increase of digital equipment, together with improvements in the analogue components associated with the frequency transformation to demodulated signal, has consequently created this more straightforward topology effective in several applications.
4.3. Advantages
The beat frequency signals which are unwanted by products from the frequency mixing stage do not require any additional signal processing because they are rejected by using a Low Pass Filter (LPF) at the output. The demodulator model carries the added benefit of higher selectivity, which is for this reason a precision demodulator. The model concepts could be expanded to allow splitting up of adjoining channel transmitted signals in which sidebands might overlay the desired transmitted signal. The model furthermore enhances the detection ability of pulse modulation transmitted signals.
5. Modulation Requirement
Continuous Wave Frequency Modulated (CWFM) also called Frequency Modulated Continuous Wave Radar (FMCW) radar [13] is a small distance calculating radar efficient at figuring out range. This enhanced dependability by delivering range measurement together with velocity measurement, that is certainly important if multiple sources of reflection are arriving at the radar antenna. Additionally, it is put to use as wave radar, proximity sensors and early warning radar. Doppler effect is not necessarily required for identification when frequency modulation is employed.
In such a transceiver the Transmitted (Tx) signal of a well-defined steady continuous wave frequency changes back and forth in regularity over a set time frame by a controlling modulated signal. The distinction of frequency between the receiver and the transmitted signals raises with delay, together with range. This smudges away the Doppler frequency. Reflections from an object are after that mixed with the Tx signal to generate a beat frequency which will lead us to the range of the object after demodulation.
There are lots of feasible modulation forms [14] that can be employed for various measurements & requirement needs but saw tooth or triangular modulation scheme is of the interest. The saw tooth wave modulation pattern is employed in comparatively large distance measurement applications along with a minimal effect of Doppler shift in frequency for instance, a maritime radar for navigation [15]. Saw tooth modulation is the single most widely employed in FMCW radars when distance measurement is favorite for targets that do not have moving elements. Range data and the Doppler speed are mixed by means of this approach. Modulation could be switched off on alternative scans to recognize speed making use of carrier frequency shifts of unmodulated wave. This enables distance and also speed to be found with a single reflectometer set. Triangular waveform modulation is often used to accomplish the identical objectives. In a triangular shaped frequency changing, a range calculation is usually carried out on both the increasing and also on the dropping edge simultaneously, the precise Doppler shift in frequency could be figured out from two measurements. The shift between the two different frequencies is two times the Doppler frequency [15]. Due to the fact the two differential frequencies are not at the same time available this comparison demands digital signal processing, with saving the measured results and processing them later. This modulation enables simple splitting up of the difference frequency of the Doppler shift frequency .
Distance is restricted to one fourth of the wavelength of the transmitted modulation. Measurable distance for 100 Hz FM will be 500,000 meters. That restriction is dependent upon the kind of modulation as well as demodulation. The succeeding normally is applicable [15].
Where:
The radar will certainly record inaccurate ranges for echoes from ranges beyond the distance resolution, for example from the moon. Range determination for FMCW are merely dependable around 60% of the instrumented distance, or even for about 100 Hz FM is 300 km. In order to maintain versatility of the transceiver system the majority of the modulation patterns such as sinusoidal, triangular and Frequency Shift Keying (FSK) are integrated in the transceiver design but triangular modulation scheme for the intended purpose was used.
6. Dynamic Range
The transceiver needs to be effective at dealing with RF signal reflections from surface of debris and also shorter range objects as well as sense minute RF signals in close proximity to the noise floor form the human skin. The ratio of the highest receivable RF signal to a bare minimum of detectable reception is known as the dynamic range which is calculated for the system as below [4]:
It is actually 11.9 dB for a particular transmit bandwidth. The highest energy of receiver RF signal in terms of maximum Root Mean Square (RMS) voltage at receiver should not saturate the transceiver front end as well as considering a 14 dB Low Noise Amplifier (LNA) is also given to the acquired signal, it is also the highest sampling rate of the ADC. Furthermore, for a FMCW transceiver, the greatest RF signal in the acquired bandwidth is determined by a compression point of 1 dB the down converter mixer in which the gain turns from linear behavior this shoulders virtually no saturation once the mixed signal is achieved. A bare minimum of detectable RF signal power in terms of minimum RMS voltage at receiver needs to be above the received background noise level as well as have a minimum detectable SNR. In the majority of reflectometer in which detection of target is the primary application, SNR of 8 dB is mostly required [16]. In the majority of applications in Ground Penetration Radar (GPR), a minimum voltage also needs to have a nominal amount of signal to clutter ratio (SCR) so that the received signal is capable of determining and also identifying the target profile.
The FMCW transceiver’s dynamic range will certainly have an effect on the greatest distance at which an object could be identified. Usually, radars will have a greater equipment dynamic range as compared to sampling dynamic range. The ADCs dynamic range in dB is as comprehensive as , where N is the amount of bits or even roughly N times 6 dB [17]. Consequently, a 16-Bit ADC will have a 96 dB of calculated dynamic range. However, additional elements impact the authentic attainable dynamic range [18]. There are techniques for instance like stacking which might be employed to enhance the SNR and also AGC to get over the issue of dynamic range variances [16].
7. Project Architecture
7.1. Methodology
An FMCW radar comprises fundamentally of a transmitting chain and a receiving chain collectively known as transceiver along with a data acquisition device. The transceiver is a small in size, portable and a light weight module which typically consists of the antennas integrated as standalone transmitter as well as receiver antennas. An RF wave typically in microwave region is produced by a Voltage Controlled Oscillator (VCO) which can be a modulated waveform which directly feeds the transmitting antenna, or even its strength may also be amplified by employing a power amplifier. A typical form of transmitting chain is shown below.
 Figure 3 – Block Diagram Transmit Chain.
A portion of the radio frequency is coupled out and also fed to a mixer which down converts the acquired as well as amplified mirrored RF signal in the baseband. The signal acquisition unit handles the transceiver, transforms the echo signals in an electronic format as well, typically by means of Universal Serial Bus (USB) wire which guarantees the connectivity with PC or a laptop. A LPF is also employed in order to restrict spurious frequency components getting into the obtained signal. Utilizing an analogue to digital converter, the control voltage is supplied to the VCO’s frequency control. The output voltage of the mixer is digitized as well as stored.
If a single antenna is being used, then a ferrite circulator then to differentiate the receiving and transmitting signals is essentially required, since simultaneously transmitting as well as receiving signals are detected by the FMCW radar. When the Tx and Rx antennas are close to one another there is a direct positive feedback between the two antennas which is like crosstalk in terms of communication. In order to mitigate this typically, the antennas employed are polarized, the polarization direction is rotated by 180° against one another. In order to further decreases crosstalk a shielding plate is also used between the antennas. Considering that the measurement is conducted as a frequency variance between the transmitting and receiving signal, the RF signal that is generated by this direct coupling could be suppressed or filtered because the frequency output is very less as compared to the coupling frequency.
Depending on the application of CW radars solely the Doppler frequency has to be processed, when transmitting a constant frequency or alternatively in the event that very low modulation frequency is applied as compared to the transmitting frequency. This consists of frequencies just approximately 16.5 KHz by applying an FMCW transceiver working in K–Band (24 GHz) and the estimated speeds for recording are around 360 Km/h. Similarly, for the case in which detection of the object is the sole purpose of the transceiver the system does not require very high received signal bandwidth. For that reason, as microprocessor there may be a regular stereo audio processor, that is manufactured in large quantities as well as being used for instance in audio cards for home laptops or computers. Even just in the rectangular shape modulation (FSK) this kind of a processor can be employed conditionally.
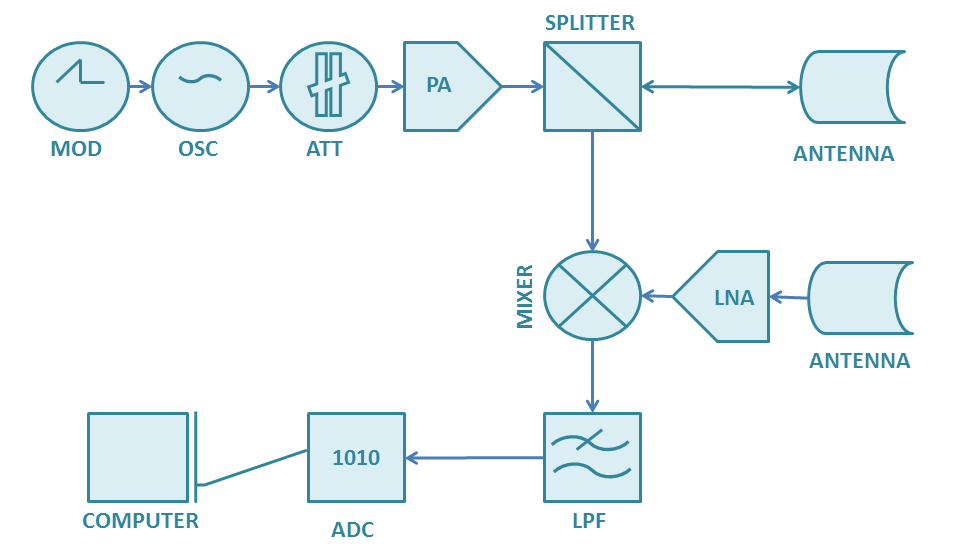 Figure 4 – Block Diagram Generic Transceiver Design Without Circulator.
On the other hand, the receiver in a FMCW radar application needs to be able to process the entire transmitter’s frequency shift. Consequently, frequencies as much as 300 MHz are estimated in the received signal. This carries a considerable effect on the bandwidth of the succeeding amplifier along with the required sampling frequency of the ADC converter. As a result, the signal processing of FMCW radar is significantly expensive in relation to the CW radar transceiver.
One of the difficulties of this system design is that the baseband signal also varies over the bandwidth if the transmitted signal. This issue is resolved in signal processing of the received signal in which the reference signal is parsed in to data, wave by wave, with respect to a reference signal which is a square waveform.
7.2. Link budget calculations
Keeping in view all the design criteria, constraints, component losses and previous analysis of the losses and absorption of building materials following designs are visualized. A separate transmitter and receiver design is given below in which approximately 90% signal is lost due to reflection, absorption or attenuation. Signal propagation or path loss models [19] were not calculated although a rough estimation of the propagation losses by carrying out literature review on attenuation in propagation was considered. The transmitted signal bandwidth is kept at 300 MHz which is the maximum bandwidth of the system this allows to achieve a decent range resolution.
Since VCO source that could produce such a high power signal was not available so an amplifier was used to increase the power as desired. This lead to an increase in components employing an attenuator in addition to an amplifier lead us to the desired power of 16 dBm. Although this produced the desired results but also increased the noise floor unnecessarily.
An innovative way was devised to decrease the noise floor as well as to reduce the quantity of components required. This ultimately lead to the decreased cost of transceiver which was also one of the main goal to deliver a low cost solution. After transceiver design research and looking deep into radar operational fundamentals [20] a design which is simplistic yet effective for the detection application was conceived.
If the transmit bandwidth of 300 MHz is maintained which is within the frequency range of Data Acquisition Devices (DAQ’s) and if the modulation frequency to the VCO is known in real time, then it can be directly down converted from 2.4GHz using stolen carrier from the transmitter. But it is coupled with a problem that the received signal varies over the frequency range of 300 MHz. This seems like there is high rate frequency hopping in the receiver system, which can be tackled in signal processing, when received data is parsed taking reference from the synchronization pulse from the modulator. This design is given below assuming similar characteristics of propagation loosing 90% of the received signal.
Now a data acquisition device had to be acquired it was found out that data acquisition devices that are available nowadays are quite big to be portable enough to use in the application so it required to figure out how to acquire signal using some handheld portable device. It was later suggested that if the transmitted bandwidth is kept at or below 20KHz which is within the frequency range of most audio processors and at such low frequencies (20 KHz) can be directly down converted from 2.4GHz using stolen carrier from the transmitter. The output can then be directly fed to a sound card of a computer or audio processor but the bandwidth of the system is greatly reduced which resulted in decreased range resolution, this technique could be useful in detection but this was not supportive in range measurement or object profiling.
If the transmitted bandwidth is kept in audio range (20 KHz) which can be processed by audio processors and at this frequency range the direct down conversion from 2.4GHz using stolen carrier from the transmitter varies over the frequency range of 20 KHz this indicates there is frequency hopping in the system. This issue was dealt by taking a signal from the modulator which is in Synchronization with the input frequency of VCO this way the data can be parsed wave by wave and hop the frequency at the same rate. The synchronization frequency is given to the left channel of audio jack and the received signal is given to the right channel of the audio jack. The acquired results can be directly fed in an audio jack input of any computer instead of using a DAQ or any other ADC. This greatly reduces the cost of the transceiver as now days a lot of high speed precision DAQ’s are quite expensive. The design is given below.
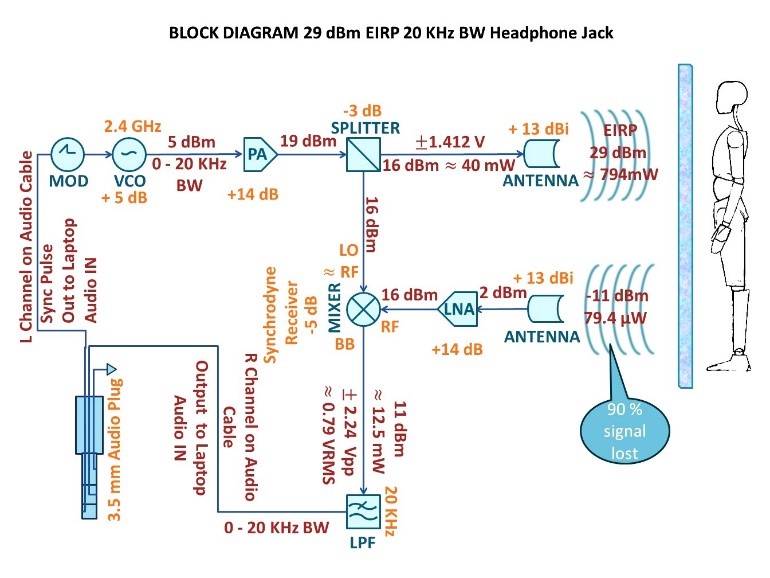 Figure 5 – Block Diagram of TRX.
This is the final design of the Microwave transceiver prototype that was implemented.
7.3. Modulator
In order to provide input to VCO’s V-Tune XR-2206 IC was utilized. The XR-2206 is a function generator incorporated monolithic circuit effective at generating good quality sine, rectangular, triangle, ramp, and also impulse wave-forms of great stability as well as precision. The generated wave-forms could be both frequency as well as amplitude modulated by an external voltage source. Frequency could be chosen by an external input over a frequency range of 1 Hz to in excess of 1 MHz. The circuit is a good choice for telecommunications, instrumentation applications, and also function generator uses demanding sinusoidal signal FM, AM, or even FSK production requirement. The oscillator’s frequency could be swept linearly over a 1:2000 frequency band with an external voltage control, while maintaining minimal signal distortion level.
The circuit designed has a voltage supply of 9-12 VDC. The waveforms that can be generated are Square, Sine & Triangle. The impedance is 600 Ohm + 10% and the frequency range of operation is 1Hz – 2MHz.
The characteristics of the waveforms are given below at the input voltage of 9 volts Direct Current (DC) that can be employed to achieve results.
- Sine Waveform
| Amplitude: | 0 – 8 V |
| Distortion: | 1% (at 1 kHz) |
| Flatness: | 0.05 dB (1 Hz – 100 kHz) |
- Square Waveform
| Amplitude: | 0 – 8 V |
| Rise Time: | 50 ns at 1 kHz |
| Fall Time: | 30 ns at 1 kHz |
| Symmetry: | 5% at 1 kHz |
- Triangular Waveform
| Amplitude: | 0 – 8 V |
| Linearity: | 1% up to 100 kHz |
The square wave is in frequency synchronization with triangle and sine wave forms so it can be used as sync pulse for Data processing [3]. Frequency chirp was carried out in order to cover the bandwidth using triangular wave so demodulated waveform is also scattered over the bandwidth as stolen carrier from the transmitter is being taken.
7.4. Audio Amplifier / Low Pass Filter
A LPF permits signals with a frequency less than a particular cut-off frequency as well as attenuates the frequencies more than the cut-off frequency. The degree of attenuation for every single frequency is dependent upon the LPF model. A Sallen Key Low Pass filter was used to get rid of electronic noise in a circuit, however, it may also be employed to avoid aliasing by restraining the frequencies of signals to be dealt with. The filter response could be transformed by replacing an individual resistor or even capacitor value.
In the case, LPF is utilized to decrease signal noise. Noise is a group of undesirable, random electronic signals that can be found in RF electronic circuits. Almost all RF devices are prone to the unwanted effects of noise, especially the ones that operate at comparatively lower energy signals. One more use for filtering is to avoid aliasing at the time of signal processing. Additionally, an LPF was employed to make sure that only lower frequency signals are allowed to pass through and high frequency noise is going to be discarded.
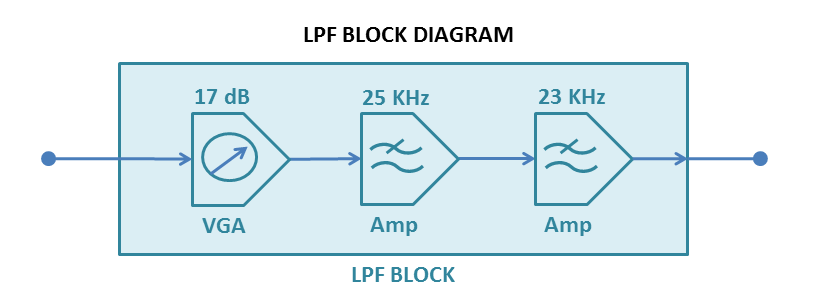 Figure 6 – LPF Block Diagram Representation.
The type of filter employed was Sallen Key Active filter topology simply because it provides a straightforward to execute filtering topology. The cut-off frequency can be adjusted by altering an individual resistor or a capacitor value. The filter constructed in Lab was tested on an oscilloscope at multiple frequencies and a bode plot was produced for the analysis of the constructed LPF. One such reading is shown. The yellow waveform is the input frequency signal and the blue waveform is the output signal that has been passed through the Sallen Key Low Pass Filter.
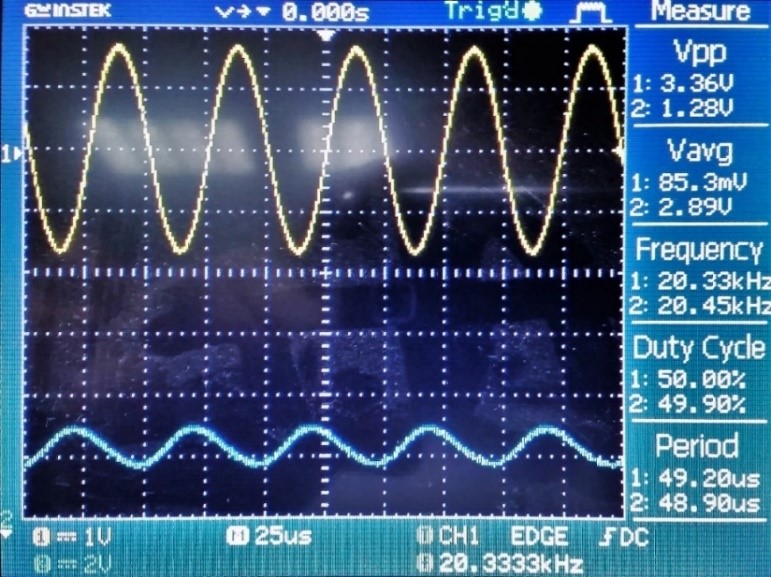 Figure 7 – Sallen Key LPF Result at 20 KHz.
The filter is functioning as desired. A -3dB gain factor was desired at 20 kHz and the filter produced slightly higher attenuation than ‐3dB. Calculations have been given below:
After taking multiple readings at interval frequencies this bode plot was created which is shown here after.
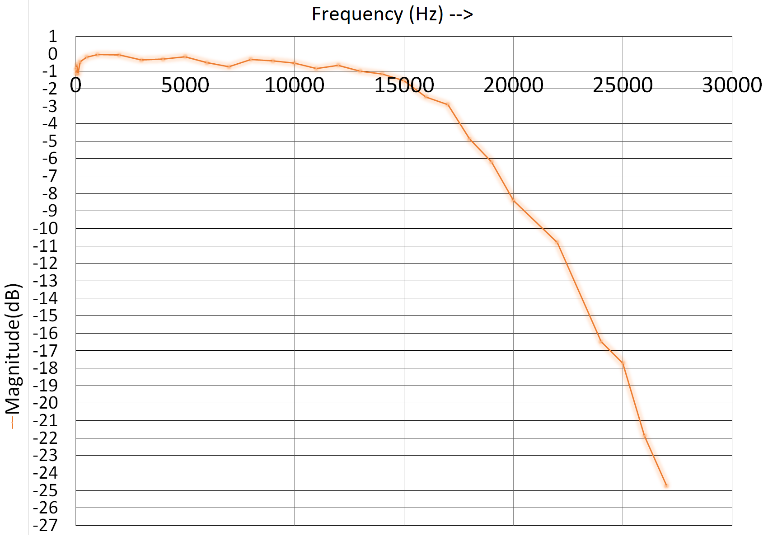 Figure 8 – Bode Plot 20 KHz LPF.
Since the filter is producing better than -3dB attenuation at 20 kHz, the Filter is working better than expected. This is likely due to parts tolerances that varied between 1 % to 5 %. Due to the ease of design and implementation, a Sallen Key filter is the perfect candidate for electronic filtering. It is ideal for eliminating electrical noise and since Operational Amplifiers (OP AMPs) draw a negligible amount of current, the filter will not load the circuit to which it is attached.
7.5. Understanding Microphone Input Sensitivity
As the analogue to digital microphone input includes different units, comparing a single type to another can be difficult to understand; however, they share a very common unit of measurement in the audio frequency signal domain, input power level in dBV [21]. One may have an analogue voltage input or a PDM modulated input, however, their maximum acoustic input power as well as SNR can be instantly analyzed. The difference between the 94 dB Sound Pressure Level (SPL) reference and the noise floor of microphone input of 65dB, altering the input relative to the 94 dB SPL, would result in changing dBV output at the microphone jack input.
7.6. Choosing Sensitivity and Setting Gain
A balance between the microphone’s input port noise floor, distortion, clipping point as well as level of sensitivity decides whether or not a microphone input is an effective match for a specific practical application. A microphone input with significantly higher level of responsiveness may require significantly less pre-amplification gain before the ADC, however, it might have much less headroom before clipping, compared to a microphone with reduced level of responsiveness.
In signal processing applications, similar to the this, in which a microphone with increased level of responsiveness is much more likely to achieve the higher audio input, distortion, as well as result in clipping. Alternatively, a higher level of sensitivity might be suitable in the application forms, in which the audio signal is attenuated as the length from the source to the microphone input port raises.
Nominal line level for consumer equipment is , which is equal to . For simple sinusoidal input waves or in other words theoretical maximum input of microphone jack [22].
However, audio equipment will often include as much as of headroom above this value before clipping, so a full scale signal could be , or or [22]. Of course, every manufacturer wants to be louder than everyone else in competition, so devices tend to have higher inputs and outputs than they should be producing, consequently inputs have less headroom than they should have.
The aim would be to remain within the limit in all circumstances so that problems during signal processing are not experienced.
7.7. Pyramidal horn antenna
Following are the dimensions and pictorial representation of fabricated antenna:
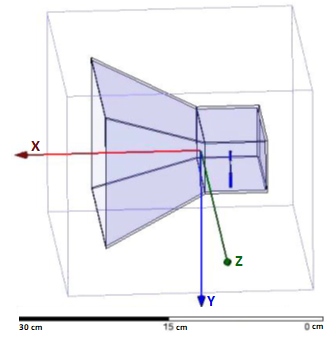 Figure 9 – HFSS Model Visualization Of Ism Band Antenna.
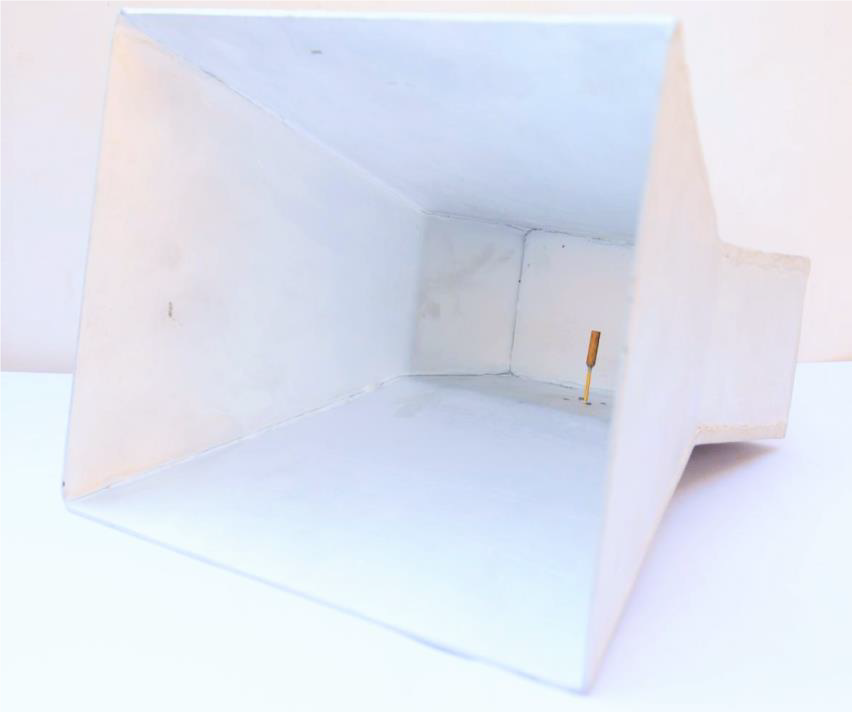 Figure 10 – Fabricated Model of ISM Band Antenna.
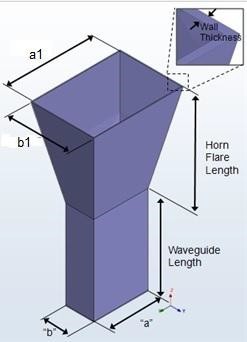 Figure 11 – Dimensions for Horn Antenna .
Table 1 – Dimensions of Horn Antenna
| Units | Cm |
| Material | Aluminum |
| Connector type | SMA |
| Waveguide | WR-430 |
| Waveguide “a‟ dimension | 10.92 |
| Waveguide “b‟ dimension | 5.46 |
| Waveguide length | 10.37 |
| Horn size in “a1‟ dimension | 18.66 |
| Horn size in “b1‟ dimension | 14.51 |
| Horn flare length | 31.1 |
| Wall thickness | 0.203 |
| Gain | Approx. 13dB |
| Lambda | 12.244 |
7.8. Results of Antenna
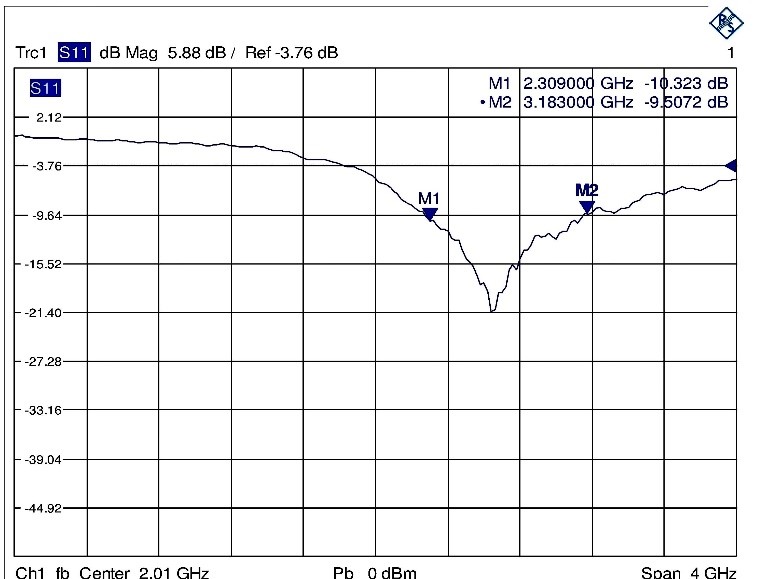 Figure 12 – Return Loss of Fabricated Tx Antenna.
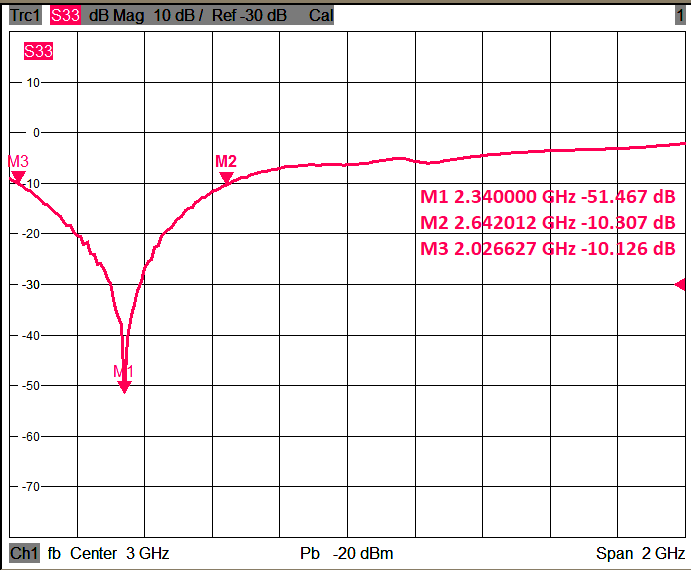 Figure 13 – Return Loss of Fabricated Rx Antenna.
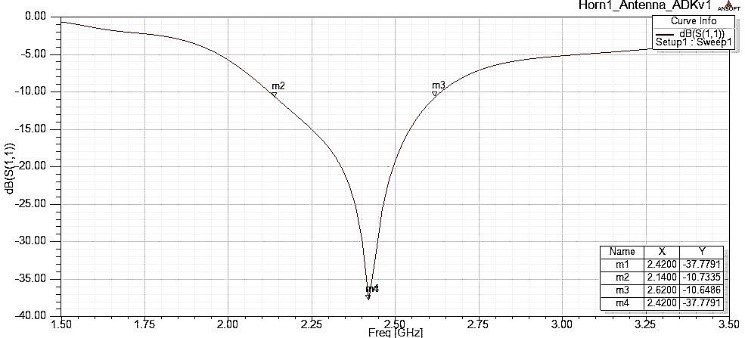 Figure 14 – Return Loss Of HFSS Simulated Antenna.
The return loss that is calculated by High Frequency Structure Simulator (HFSS) software simulation is -37.7791 dB and the return loss measured by the network analyzer is at a minimum of -21.40 dB. The -10 dB bandwidth of the Tx antenna is calculated from simulation as 480 MHz (2.62 GHz – 2.14 GHz) and the one measured from network analyzer is 883 MHz (3.183 GHz – 2.3 GHz) it can be seen that the centre frequency is shifted a little to 2.55 GHz but it still remains within the desired bandwidth of operation. The -10 dB bandwidth of the Rx antenna measured from network analyzer is 622 MHz (2.642 GHz – 2.02 GHz) it can be seen that the centre frequency is shifted a little to 2.34 GHz but it still remains within the desired bandwidth of operation.
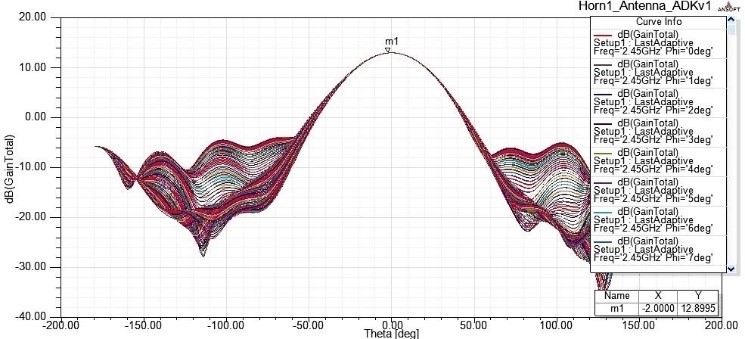 Figure 15 – Gain of HFSS Simulated Antenna.
Antennas Radiation pattern was also tested in Antenna Test Range (ATR) at Space and Upper Atmosphere Research Commission (SUPARCO) Laboratories. The plots of the results obtained are shown below.
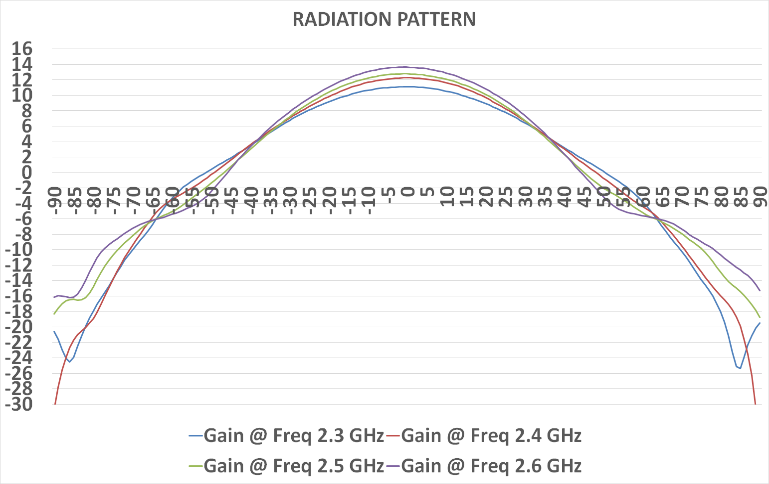 Figure 16 – Gain Measurement at ATR (Tx).
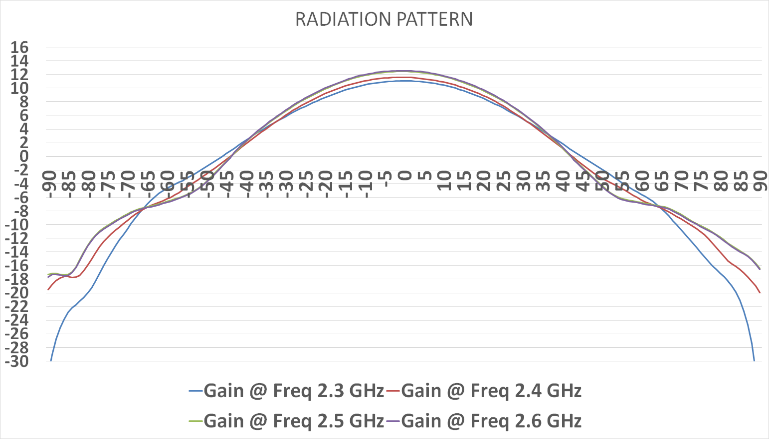 Figure 17 – Gain Measurement at ATR (Rx).
The actual gain measurement at 2.4 GHz of Tx antenna comes out to be 12.2744 dB, whereas, in simulated antenna results it can be seen that it comes out to be 12.8995 dB this is an acceptable loss that may be experienced in practical measurements. Similarly, for Rx antenna it comes out to be 11.5885 dB. Complete detailed results are mentioned in appendix.
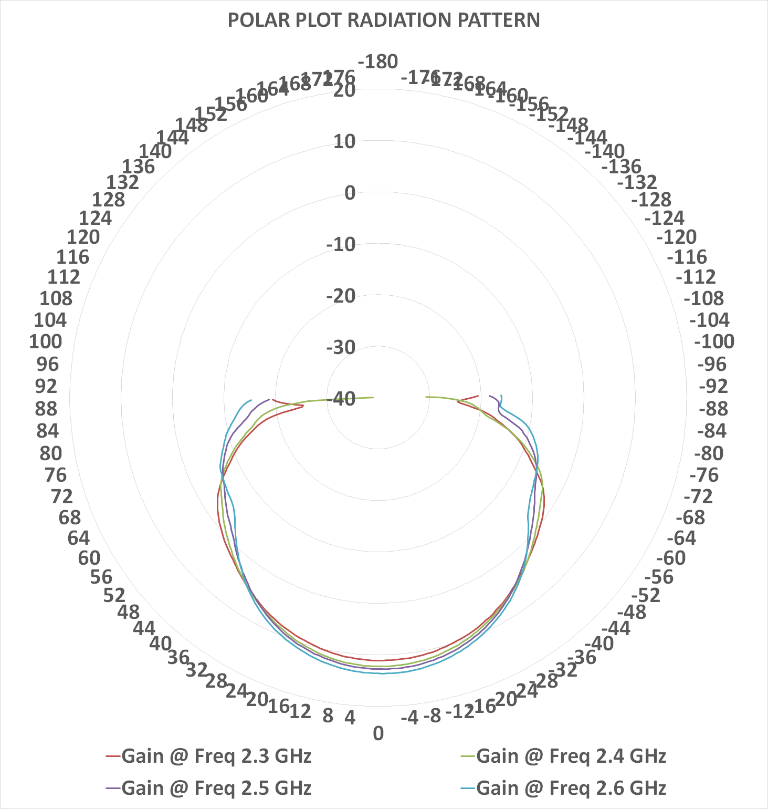 Figure 18 – Polar Radiation Pattern Plot (Tx) in ATR.
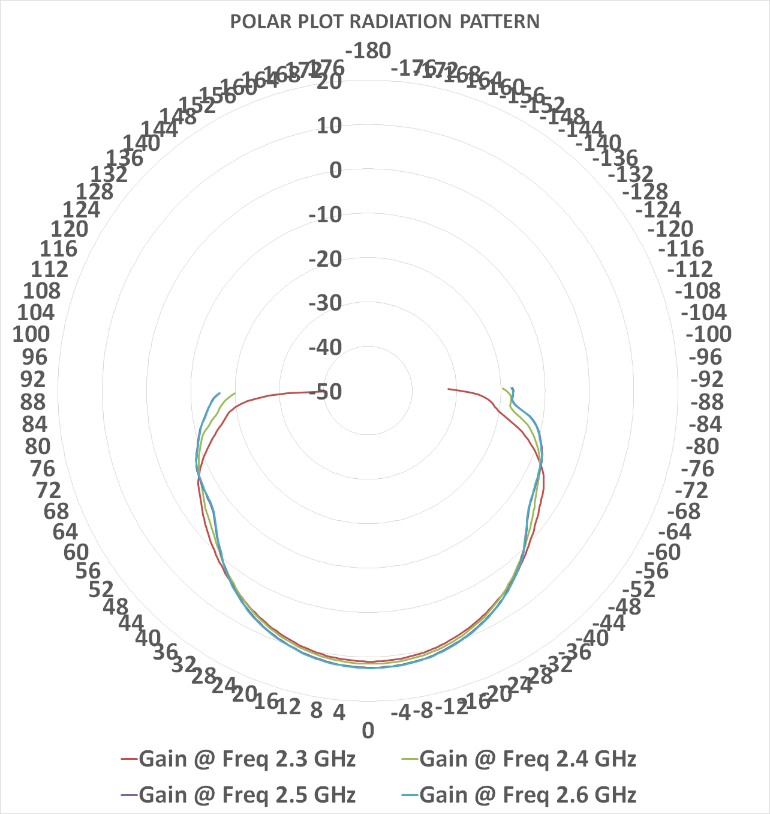 Figure 19 – Polar Radiation Pattern Plot (Rx) at ATR.
7.9. Power supply
In order to power the transceiver, a straightforward yet effective way by making use of widely available voltage regulator IC’s to power the system was employed. 12 V DC from electric batteries was employed and required voltage was regulated by the components employing 78xx linear voltage regulator IC’s. The 78xx or for certain producers L78xx, LM78xx, MC78xx and so forth are a series of linear static voltage regulators which are self-contained and have a built-in circuit. These are widely used in electric circuits demanding a regulated and managed power source because of their simplicity and inexpensive IC’s. They generate a voltage which is positive relative to ground.
Light Emitting Diode (LED) lights were also used for indication of functioning of each separate IC input voltage and used comparatively higher values for capacitance for better ripple free and fixed voltages. The complete circuit diagram of power supply is given on next page. This circuit was implemented in the design. A Printed Circuit Board (PCB) was fabricated which was used to supply power to components.
Schematics of transceiver power supply are given below:
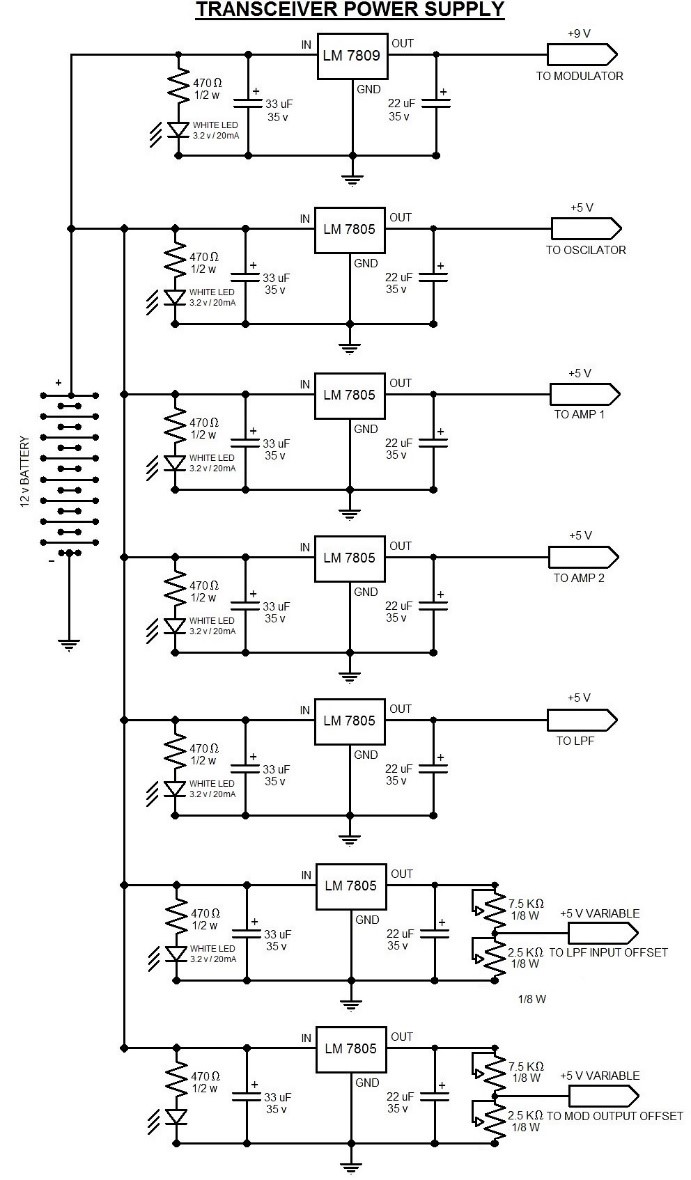 Figure 20 – Transceiver Power Supply Schematic.
8. Design implementation
8.1. Transmitter development stage
Each and every component of transmitter was connected and results were tested with spectrum analyzer.
First of all, VCO was given a constant voltage in order to generate a fixed frequency of 2.4 GHz then amplifier was connected in series and the results were visualized on spectrum analyzer. Similarly, the splitter was added to the chain and a 50 termination was applied to the other port of splitter in order to avoid reflection from it. Then a total gain of 14.65 dBm was achieved and when the cable loss was included which was calculated prior to the testing (approximately 1.5 dB calculated before testing) then the total power comes out to be 16.15 dBm. This is very close to the calculated value of 16 dBm during link budget analysis at 2.4 GHz.
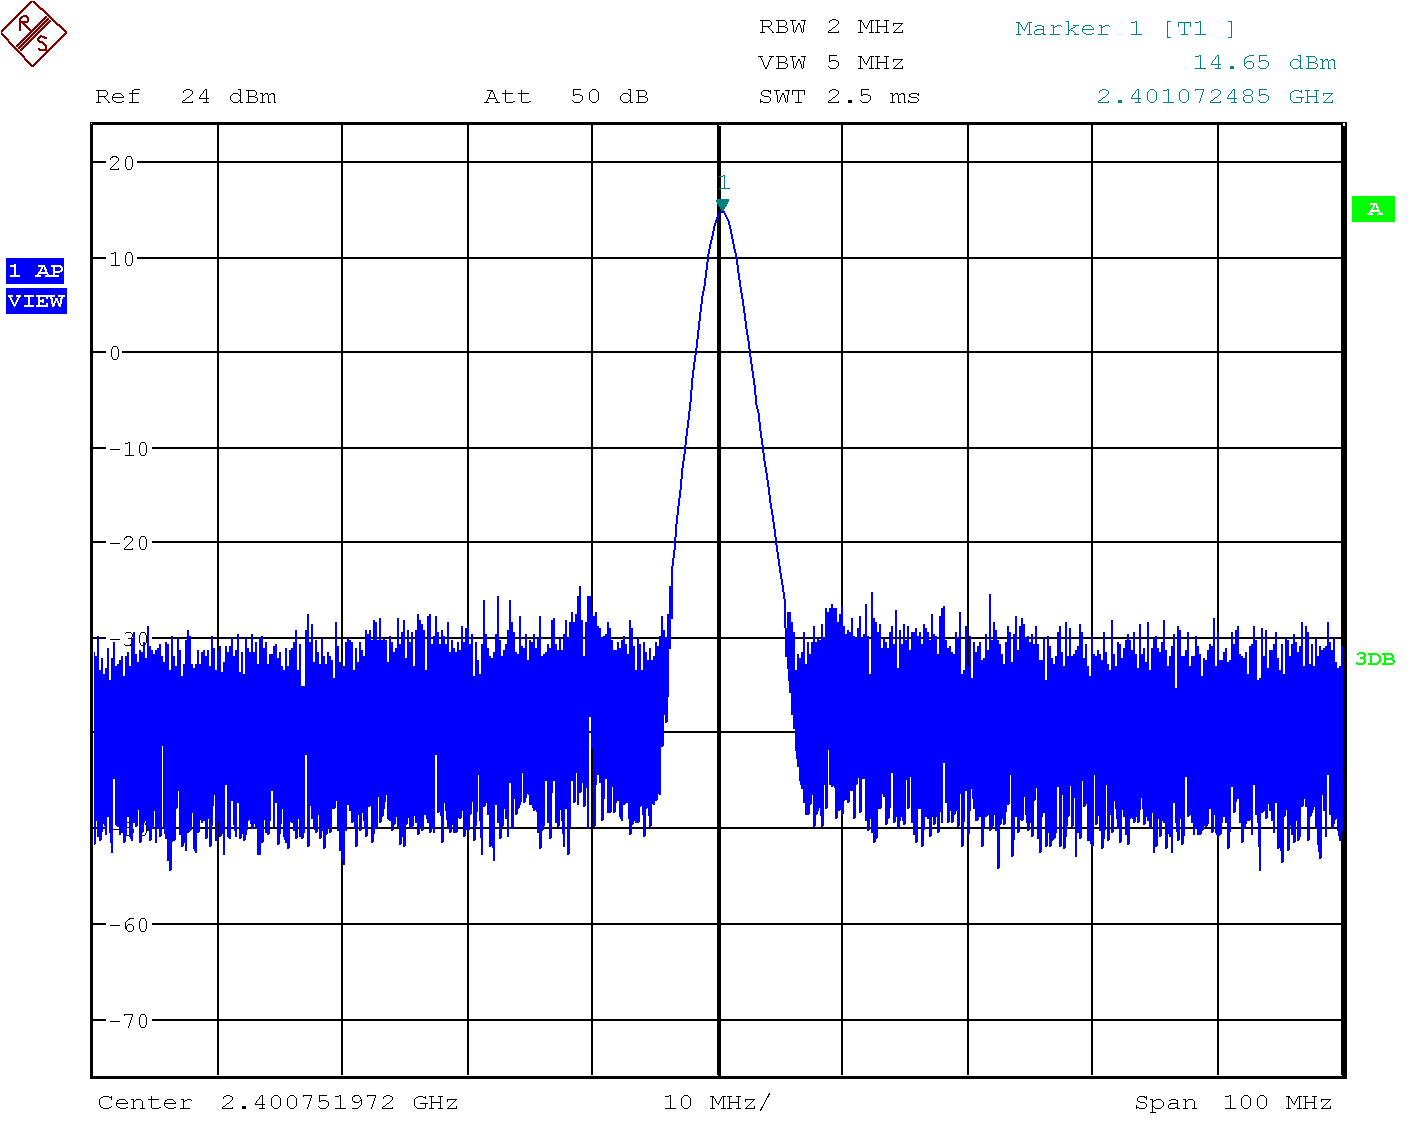 Figure 21 – VCO + PA + Splitter Output Response.
The block diagram of transmitter chain is given below this will be the total power feed into the antennas at 2.4 GHz.
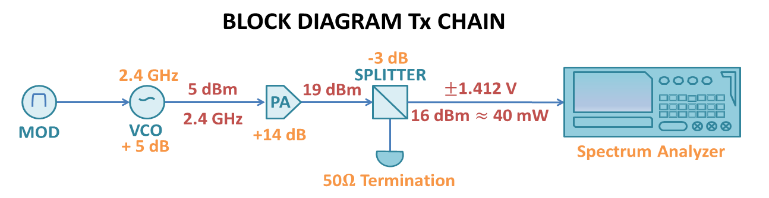 Figure 22 – Block Diagram VCO + PA + Splitter Testing.
8.2. EIRP measurement at anechoic chamber test
The gain of the antenna is measured by using the two antennas with known gain one as a transmitter and other as a receiver. Subsequently replaced the Tx antenna with the fabricated antenna and again measured the gain then with some calculations, the gain of the fabricated antenna can be found. The transmitted power fed into the antennas is measured previously although their values are given in table. The EIRP is calculated at different frequencies in order to cover the entire bandwidth.
Table 2 – EIRP Calculations Table
| SR NO. |
FREQ (FC) |
TX GAIN (GT) |
TX POWER (PT) |
EIRP (PT+ GT) |
| 1 | 2.3 GHz | 11.11 dBi | 16.75 dBm | 27.86 dBm |
| 2 | 2.4 GHz | 12.27 dBi | 16.66 dBm | 28.98 dBm |
| 3 | 2.5 GHz | 12.79 dBi | 16.68 dBm | 29.47 dBm |
| 4 | 2.6 GHz | 13.64 dBi | 16.68 dBm | 30.32 dBm |
All the values are given excluding the cable losses that were calculated prior to the testing for gain measurement which was calculated to be 1.2 dB and for transmitting power fed into the antennas the cable loss was measured to be approximately 1.5 dB.
The calculated EIRP of the transmitter was 29 dBm but it can be seen that the EIRP of the transceiver increases with the increase in frequency. There is almost 3 dB increase in EIRP when frequency is increased from 2.3 GHz to 2.6 GHz. This is mainly due to the increase in transmitter antenna gain increase, as the frequency increases the beam width of the transmitting antenna increases, which leads to the increase in overall transmitted power.
8.3. Receiver development stage
For any equipment comprising a receiver and a transmitter the loopback test [23] is a smart method to test the receiver. The essential loopback assessment for the integrated Microwave transceiver is conducted. The baseband signal visualization is conducted by oscilloscope which helps as an output analyzer while the microwave front end is in test with the help of a test attenuator. By means of this method in Transceiver (TRX) development, the microwave examination equipment can largely be evaded eventually leading to the reduced cost of test. The existing limitations and trade-offs are also discussed in the next chapter in terms of test observability controllability, and feasibility vs performance also the influence of production tolerances and the detectability threshold test was also conducted. This loopback test is conducted to provide a comprehensive picture of the transceiver functionality also in order to test Tx and Rx front ends before deploying antennas and actually start transmitting and receiving. The actual received signal of applied communication transceiver under test is also included. The receiver was tested using loop back technique where an attenuator is applied at the transmitter feed and is given to the received signal feed. The block diagram of the system under test is given below.
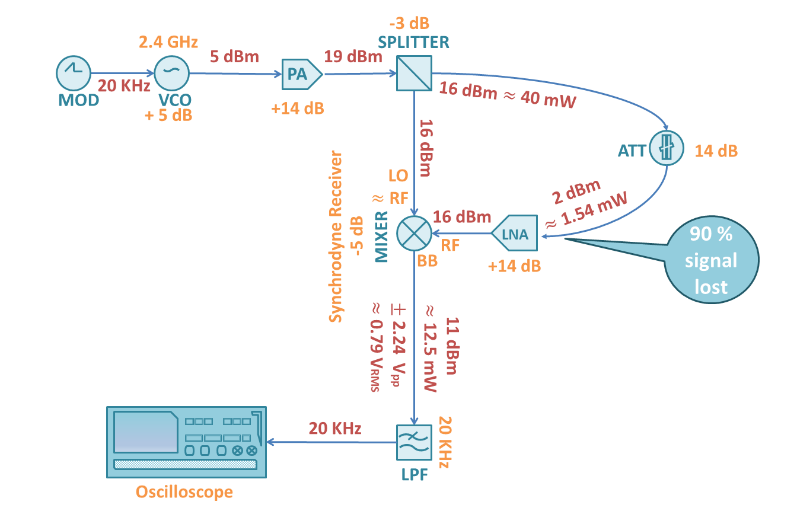 Figure 23 – Block Diagram Receiver Test (Loop Back Test).
Since the RF built-in circuits function at gigahertz frequencies and as they are growing to be more and more sophisticated, in apparatus assessment the typical testing aimed toward comprehensive requirements of the engaged RF components seems unrealistic and also expensive when it comes to the instrumentation as well as evaluation time. Direct RF measurement results on components demand additional contact elements that are likely to degrade the microchip overall performance and efficiency while using the needle probes obstruct the measurement results. The received signal result shown below tells that the receiver is functioning as desired and the frequency in use (20 KHz) would be the maximum frequency that is going to be used for the system.
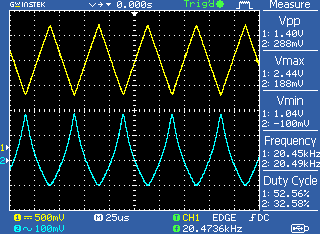 Figure 24 – Receiver Loop Back Result (20 KHz).
Using this approach as carried out in the front end test the detectability thresholds for different errors could be determined as well as various loop back results can be analyzed for the transceivers detectability. As the limitation and tolerances of the RF circuitry are likely to drive the RF components away from specifications the Design for Correction (DFC) is practically essential and also it needs to be merged with link budget analysis for an in depth approach. Through DFC the effect of variation due to tolerances on assessment is mostly alleviated, however, the demand for repeated tests is not reduced.
In spite of the problem of not having the schematics of the microwave components, a simple yet effective way was used to calculate the phase difference that will be produced at the mixer. It can be seen that there is a phase shift of approximately 180o in the transmitted and the received signals.
8.4. Data acquisition stage
A signal processing code block diagram has been given below.
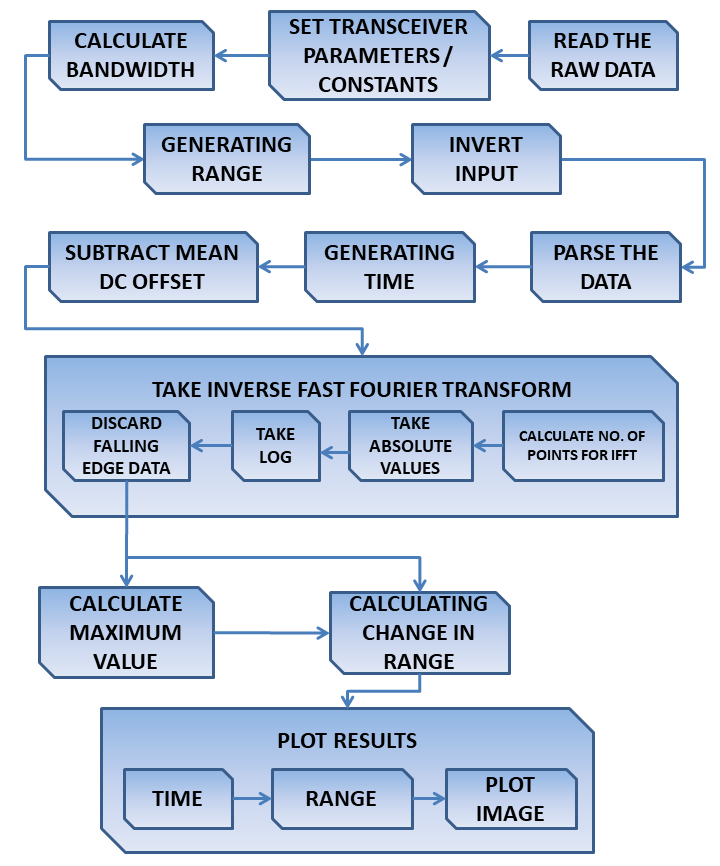 Figure 25 – Block Diagram of DSP MatLab Code.
8.5. System integration
The modules which make the core of the microwave Tx and Rx chain were assembled. The picture below shows the assembly.
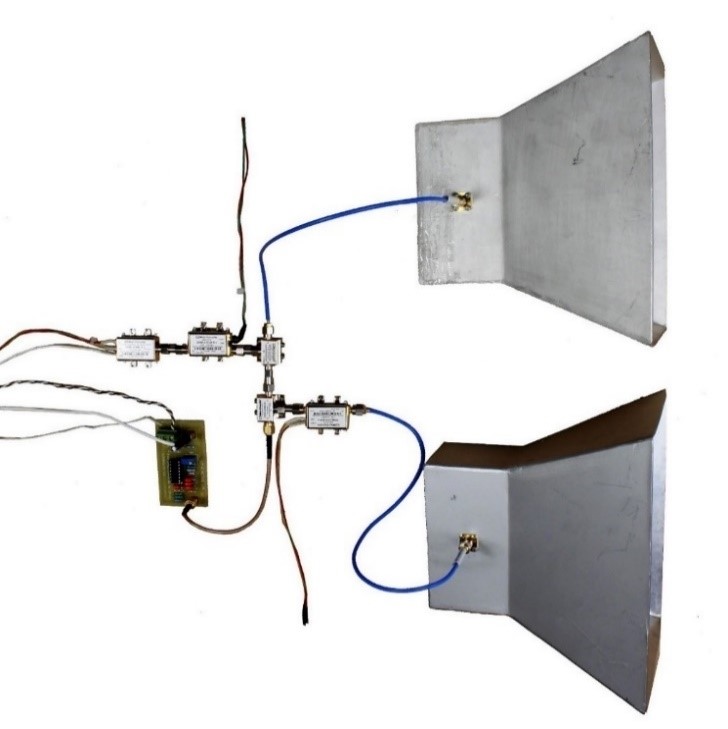 Figure 26 – Complete TRX Assembly with Antennas.
9. Evaluation
9.1. Oscilloscope Rest Results
First of all, the test results are conducted without any material in front of the body. By placing a body directly in front of the transceiver. The results are taken on oscilloscope and also a recording is made which was processed by the MatLab code in order to get a better picture. The test with a 9-inch (22.86 cm) thick wall in between the body and transceiver. The body was placed at a distance of 5 ft. from the wall. The test results in time domain are given below as visualized on oscilloscope.
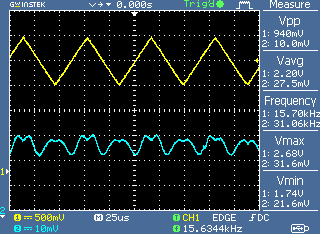 Figure 27 – Far Field (Wall) Test without Body.
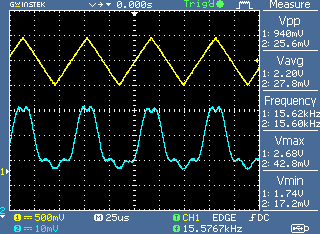 Figure 28 – Far Field (Wall) Test with Body 1 Foot (30.48 Cm) from the Wall.
9.2. Computer Audio Card Results
Audacity software was used to record the test results. First of all, the transceiver results are acquired by placing the transceiver with the wall and body was only placed once behind the wall these results are captured at multiple frequencies.
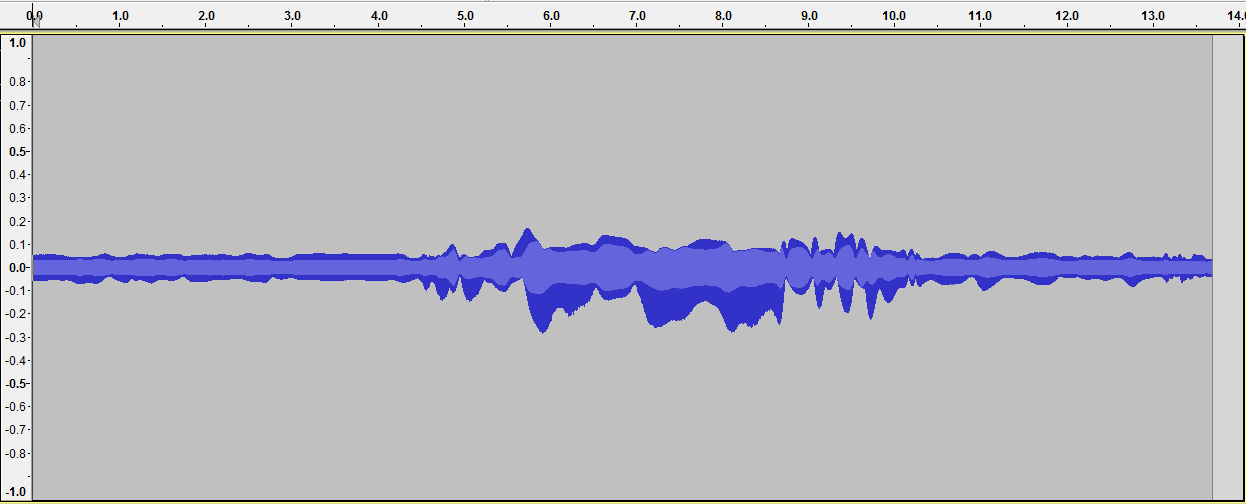 Figure 29 – Audio Pictogram at 5 KHz (Body was Placed Once).
Now the transceiver results are acquired by placing the transceiver with the wall and body was only placed multiple times behind the wall these results are captured at multiple frequencies. The multiple detection was conducted by setting threshold at the noise floor. The resulted pictograms are given below.
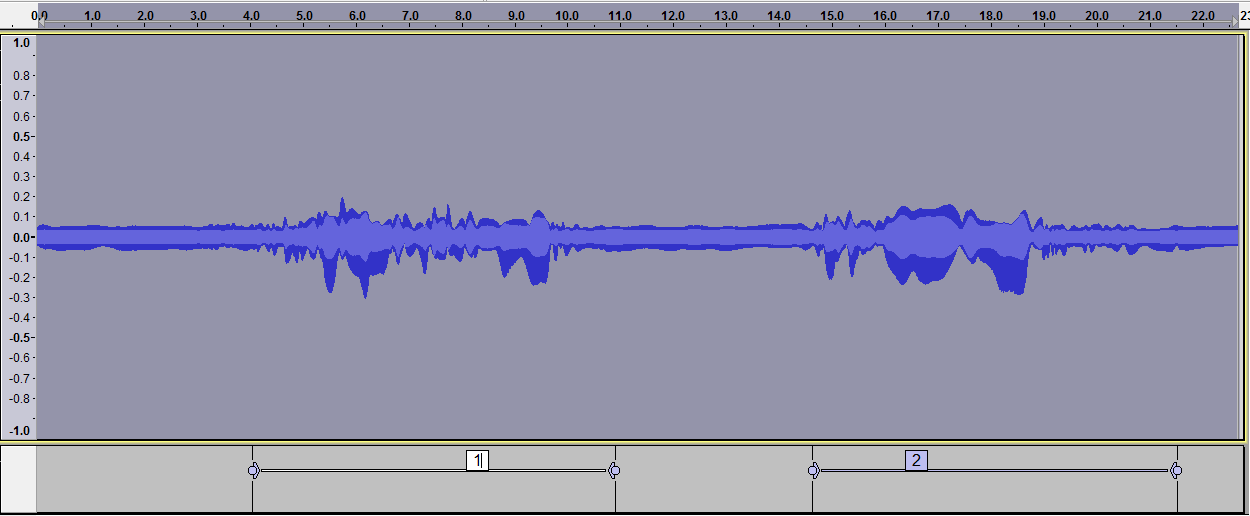 Figure 30 – Audio Pictogram at 5 KHz (Body was Placed 2 Times).
9.3. MATLAB 2D Images Results
Recordings from different frequencies is processed using MATLAB and RTI plot is developed.
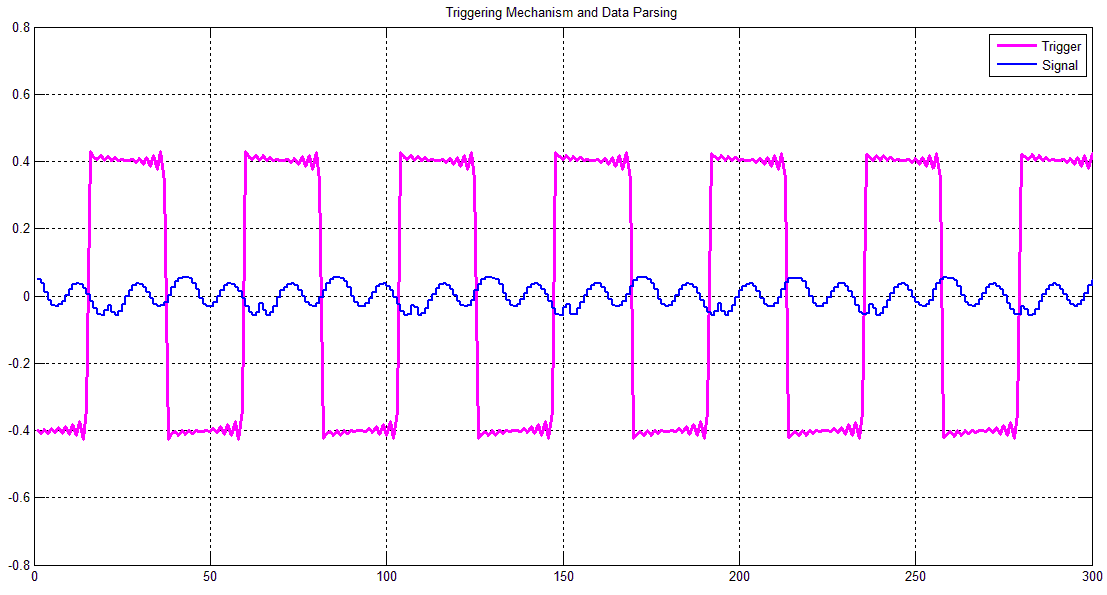 Figure 31 – MatLab Data Parsing 1 KHz.
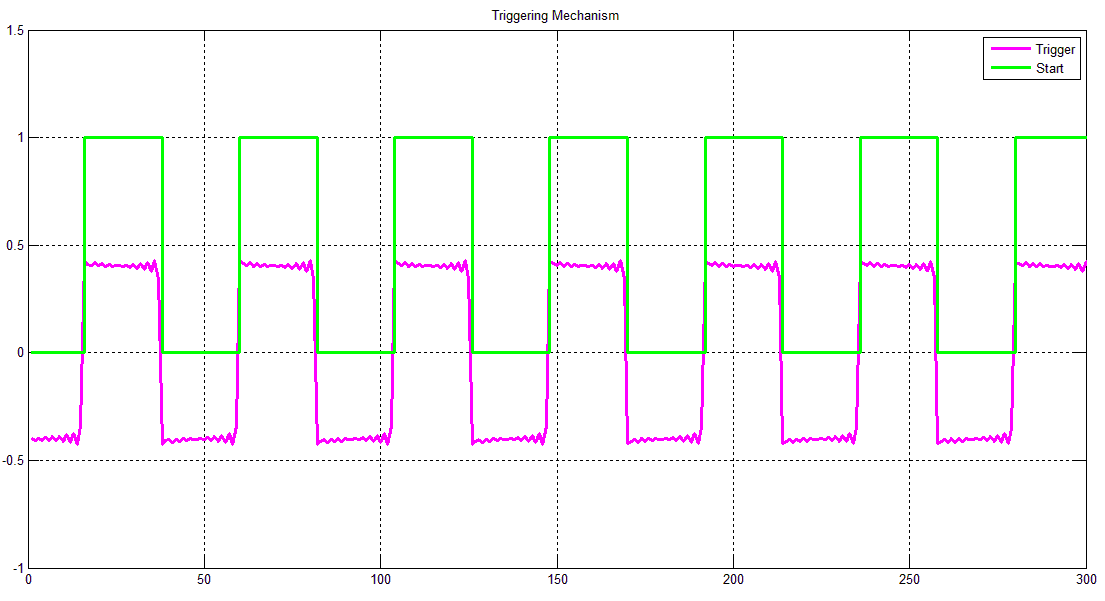 Figure 32 – MatLab Triggering Mechanism 1 KHz.
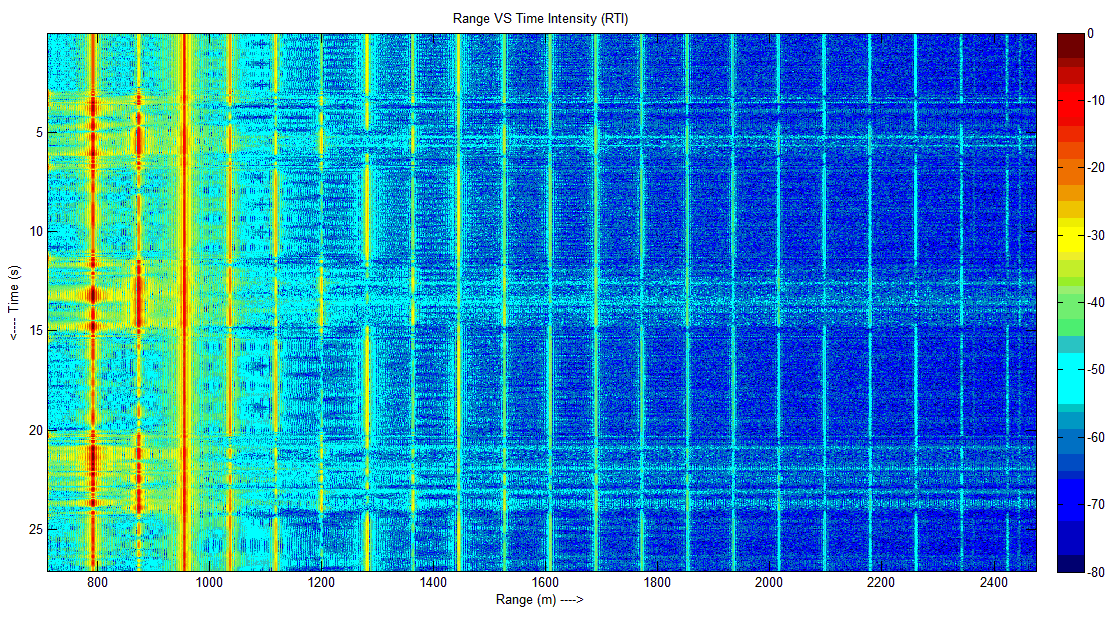 Figure 33 – MatLab Range vs Time Intensity 1 KHz (Body was Placed 3 Times).
The transceiver results are acquired by placing the transceiver with the wall and body was only placed 3 times behind the wall with specific time intervals these results are captured at 11 KHz. The multiple detections can be observed in RTI plot given above.
10. Conclusion
A completely built-in 2.4 GHz FMCW transceiver is basically designed and produced in this particular report. Employing XR 2206 IC for the purpose of function generator IC as an FMCW engine and using module based components with SMA connectors can significantly decrease the complication of the circuit as well as hardware designs. Which helped accomplish the project goals and targets realized that were set within initial project proposal. FMCW within the system was analyzed as well as simulated, using various modulation techniques. Microwave front end came to the realization in MMIC technology is exhibited as well. With baseband processors as well as high-gain antennas incorporated, this project offers an entire transceiver realization instance, which demonstrates encouraging probability of future under debris search and rescue or through wall imaging applications. After designing the transceiver and horn antennas, several experiments were conducted on human skin and other materials (concrete, wood, glass and sand), to understand and distinguish between if a living or nonliving body is present behind the material or otherwise. From the experiments that were conducted, it was observed that the body was easily detectable and materials are easily distinguishable when the body was close to the material but when the body moved away from the material it was difficult to detect the body beyond a distance of 7 ft (2.1 m).
Developing of this kind of a transceiver experiences a lot of challenging problems. Nevertheless, the energy requirements of this kind of a transceiver which is effective at detecting body of a human under rubble is dependent on operating environments. To be able to model a time domain relying microwave transceiver, antenna gain, wireless transmitter, energy consumption, highest possible input power and the highest possible voltage levels as well as form of modulation is must. Frequency generator, system dynamic range together with noise figure of Rx are the variables that depend on the attenuation along with the operating environments. Consequently, Link Budget Analysis own fundamental share when planning these kinds of transceivers. Within this report, a Simulation of Link Budget Analysis, that is in MatLab environment, is presented to be able to evaluate the functional bandwidth of the System. Moreover, these simulation outcomes are reconfirmed by actual measurements.
One of the most interesting observation was a presence of beat pulse in the form of amplitude variance of the received signal when living being is placed in front to the transceiver. Which was not received during presence of nonliving body. Similarly, there was a repeated pattern in received frequency components when living being is placed in front of the transceiver. This could be due to heart beat or breathing of a person if so then this could also be employed to detect living and nonliving beings under debris. More research is needed to look into this observation.
This range of the system is greatly increased by using high power amplifiers and employing horn antennas. During the tests performed, the antenna was directly interfaced with the transceiver that enabled us to transmit 794 mW of power or 29 dBm EIRP. That much power would greatly increase the penetrating and distinguishing ability of the antenna. Further experimentation, research and analysis will determine exactly how much power is to be used in real life scenarios.
This project provided foundation for further research and work on more complex system to be built in the future by upcoming students. This will also help students gain understanding and interest in subjects such as electromagnetic theory, antenna & radio wave propagation and radar systems.
Conflict of Interest
I certify that there are no affiliations with or involvement in any organization or entity with any financial interest, or non-financial interest in the subject matter or materials discussed in this manuscript.
Acknowledgment
First of all, I would like to thank Almighty Allah and then my parent’s, relatives & friends who kept supporting me in all the phases of my study, both economically and morally.
Here, I would explicitly like to acknowledge my teachers and professors, for their guidance and encouragement to work hard, being my mentors. I have found them enormously supportive, caring and reassuring throughout my course of studies at CIIT. Their analytical, systematic and investigative comments on my work yielded positive results by stimulating my mind and inspired me to think of novel ideas, approaches as well as procedures in the field of electrical telecommunications.
I must here acknowledge support given to me by Space & Upper Atmosphere Research Commission (SUPARCO) Pakistan in test and trials of project work at SUPARCO LABS. Without their kindness proofing of equipment would not have been possible. Staff at Satellite Research and Development Centre SUPARCO had been extremely forthcoming in providing the training and test equipment for proofing.
Once again all praises are for Allah Almighty who provides us with all the resources and knowledge, making sure that we are able to make their adequate use for the benefit of humanity.
- D. A. A. K. Syed Daniyal Ali Shah, “Microwave Transceiver Prototype for Under Debris Search and Rescue Operations,” in 19th IEEE International Multi Topic Conference (INMIC 2016), Sahiwal, 2016.
- J. E. P. Jr., G. L. Charvat, J. Goodwin and M. Tobias, “Through-Wall Imaging Radar,” Lincoln Laboratory Journal , Vols. Volume 19, , no. 1, 2012.
- M. A. Richards, Fundamentals of Radar Signal Processing, vol. Second Edition, McGraw-Hill Professional Engineering, 2014.
- M. Skolnik, Introduction to Radar Systems, vol. 3rd Ed, New York: McGraw-Hill, 2001, p. 49.
- B. Mullarkey, ” The differences between pulse radars and FMCW ones,” [Online]. Available: Navigate-us.com.
- C. R. Leutz, Notes on a Super-Heterodyne, QST, Hartford, CT: American Radio Relay League, p. 11–14.
- S. I. –. T. o. F. Allocations, CHAPTER II – Frequencies, ITU Radio Regulations, ARTICLE 5 Frequency allocations.
- I. T. Union, ARTICLE 1 – Terms and Definitions, 19 October 2009.
- G. G. W. &. W. Henry Goldberg, The Genesis of Unlicensed Wireless Policy, George Mason University, April 4, 2008.
- W. Hayward and D. Bingham, Direct Conversion – A Neglected Technique, 1968.
- “The History of the Homodyne and Synchrodyne,” Journal of the British Institution of Radio Engineers, April 1954.
- “Quad Demodulators Arm Direct-Conversion Receivers,” IEEE Microwaves & RF, 9 February 2011.
- J. Lesurf, “Improved forms of radar,” [Online]. [Accessed 24 01 2016].
- “Frequency-Modulated Continuous Wave Radar,” [Online]. Available: Radartutorial.eu. [Accessed 7 8 2016].
- J. M. Ridenour, “Radar System Engineering,” MIT Radiation Lab, vol. 1, p. 629, 1947.
- S. Erst, Receiving Systems Design, The Receiver, Dedham, Ed., Artech House Inc., 1985.
- W. Chang, L. Huan and L. Yubai, “A Practical FMCW Radar Signal Processing Method and Its System Implementation,” 6th International Conference on ITS Telecommunications Proceedings, p. 1195 – 1199, 2006.
- D. Smith, Digital Signal Processing, The ARRL Handbook for Radio Communications., 81 ed., D. Reed, Ed., 2004.
- Mahafza and B. R., “Radar system analysis and design using MATLAB”.
- M. I. Skolnik, Radar Handbook, vol. 3, New York: McGraw Hill, 2008.
- J. Eargle, Handbook of Recording Engineering, Springer. p. 4. ISBN 0-387-28470-2., 2005.
- B. Fries and M. Fries, Digital Audio Essentials, O’Reilly Media. p. 147, ISBN 0-596-00856-2.
- R. Rudersdorfer, Radio Receiver Technology: Principles, Architectures and Applications, John Wiley and Sons. pp. 1–2., 2013.
- E. H. Armstrong, A new system of short wave amplification, New York: Proceedings of the IRE – Institute of Radio Engineers, 1921, p. 3–11.
- T. K. Sarkar, R. J. Mailloux, A. A. Oliner, M. Salazar-Palma and D. L. Sengupta, History of Wireless, John Wiley and Sons, 2006, p. 110.
- J. B. Hagen, Radio-frequency electronics: circuits and applications, Cambridge University Press – Technology & Engineering, 1996, pp. 12-58.
- Improvements in or relating to superheterodyne radio receivers, GB 426802, 12 October 1933.
- F. E. Terman, Radio Engineers, McGraw-Hill, 1943.
- J. J. Carr, RF Components and Circuits, 2002.
- G. Malanowski, The Race for Wireless: How Radio Was Invented or Discovered?, 2011, p. 69.