Estimation of voltage unbalance at an AC traction substation with different train operational scenarios
Estimation of voltage unbalance at an AC traction substation with different train operational scenarios
Volume 2, Issue 3, Page No 1086-1091, 2017
Author’s Name: Thanatchai Kulworawanichponga), Nattapong Mingpruk, Tosaphol Ratniyomchai
View Affiliations
School of Electrical Engineering, Institute of Engineering, Suranaree University of Technology, Nakhon Ratchasima, 30000, Thailand
a)Author to whom correspondence should be addressed. E-mail: thanatchai@gmail.com
Adv. Sci. Technol. Eng. Syst. J. 2(3), 1086-1091 (2017); ![]() DOI: 10.25046/aj0203138
DOI: 10.25046/aj0203138
Keywords: Voltage unbalance factor, AC electric railway, Cyclic permutation of phases connection

Export Citations
This paper presents the modeling and simulation of the voltage unbalance in the power supply system of an AC electrified railway. The operating voltage at the traction substation is obtained by MATLAB/SIMULINK program and the voltage unbalance is evaluated by considering the voltage unbalance factor (VUF). Suvarnabhumi Airport Rail Link (ARL), in Bangkok, Thailand, is chosen to be a case study. The ARL is supplied by two single-phase traction transformers connected as a cyclic permutation of phases. According to the extension plan of the ARL, four service scenarios with different headways, auxiliary loads and total weights of the trains were simulated to study how the different scenarios influence the VUF at the three-phase side. It can be summarized that at the same headway, the VUF was increased when the train weight and auxiliary power load were increased. In case of different headways, the longer the headway, the more voltage unbalance. The extension plan of the ARL in the near future can be achieved with the voltage unbalance level under the maximum allowable value.
Received: 30 April 2017, Accepted: 24 June 2017, Published Online: 16 July 2017
1. Introduction
This paper is an extension of work originally presented in IEEE/SICE International Symposium on System Integration (2016) [1]. However, the additional experimental pieces proposed in this paper is that the voltage unbalance at an AC traction substation is effected by the three factors of the train operation, including train headway, number of train and additional auxiliary power. This consideration is evaluated for the extension plan of the ARL in the near future. The results would be verified and discussed as follows:
The power feeding system of the ARL is the 25 kVrms overhead catenary system receiving electric power from the three-phase AC transmission system. The traction substation transformers are connected as a cyclic permutation of phases, i.e. an alternate phase connection such as A-B, B-C, and C-A. In practical, the voltage unbalance and voltage drop are frequently occurred at the point of common coupling depending on the train operations. In additions, the State Railway of Thailand has planned to extend the service from Suvarnabhumi airport to Don Muang airport in the near future. Therefore, the energy consumption by trains at the traction substation will definitely increase. Obviously, the voltage unbalance at the three-phase side of the traction substation is likely to increase too. To assess the feasibility of the extension plan, four expected train operational scenarios have been simulated by using MATLAB/SIMULINK to evaluate the voltage unbalance and to study the effects of the headways, train weight, and auxiliary power on the voltage unbalance.There are presently various forms of ground transportation that help the passengers, particularly the international tourists, to make a decision. The mass rapid transit system is one of the most favorite ground transportation systems and currently vital to developing countries, especially regarding the fundamental economy and society. In Thailand, the tourism industry grows quickly. Therefore, the number of the international tourists at the Suvarnabhumi airport also increased. The cheapest cost and shortest time to travel from the Suvarnabhumi airport to Bangkok city center and other mass rapid transit lines is traveling by the Suvarnabhumi airport rail link (ARL).
This paper presents the study of the voltage unbalance at the traction substation of the ARL in four different scenarios. The contents are divided into six sections. Section 1 is an introduction. Section 2 describes a train movement, power consumption, and voltage unbalance factor (VUF) calculation. Section 3 describes the ARL power supply system and parameters calculation. Section 4 presents the modelling in MATAB/SIMULINK and simulation procedure. Simulation results and discussion are described in section 5. Lastly, a conclusion is in section 6.
2. Train Movement and Voltage Unbalance Calculation
A train motion is calculated by the Newton’s second law of motion taking account of gradients, speed limitation, modes of operation, etc. In order to obtain the required power, speed, and position of the train, it is indispensable to simulate a train movement. In this section, the basic modules within the train simulation are briefly reviewed [1]. In addition, the definition of the voltage unbalance factor is proposed.
2.1. Train movement calculation
|
|
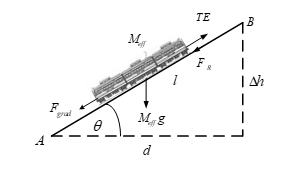
A train motion is resisted by several resistive forces, e.g. train resistance, track gradient force, etc. The free body diagram of all forces acted upon the train on an inclined plane is shown in Figure 1. By applying Newton’s second law, the train movement equation is expressed in (1):
where TE denotes the tractive effort (N), Fgrad denotes the gradient force (N), FR denotes the train resistive force (N), Meff denotes the effective mass (kg) and α denotes the train acceleration (m/s2)
- Tractive effort (TE): the force generated by a locomotive to pull a train [2].
- Gradient force (Fgrad): the weight of a train opposes the train movement when a train is on a positive slope and helps accelerate when it is on a negative slope. The gradient force is usually expressed in the form of Δh/l, where Δh is the vertical distance, l is the slope length or horizontal distance from point A to B, see Figure 1. With a small arbitrary angle θ the gradient force can be approximated by using (2), where g is the acceleration rate due to gravity of the earth.
- Train resistive force (FR): the motion of the train is opposed by a number of resistive forces. The overall resistance can be formulated as follows [3]:
where v is the vehicle speed (km/h) and the coefficients A (kN), B (kNh/km) and C (kNh2/km2) are all constants called the Davis coefficients [4].
- Effective mass (Meff): it is the sum of tare mass (mass of train without loads or passengers) and rotational inertia of the rotating components on the train which is expressed as follows [3]:
where Mt is the tare mass, λw is the rotary allowance and Ml is the freight or passenger load.
|
|
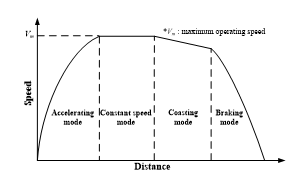
The modes of train motion considered in this study include accelerating, constant speed, coasting, and braking modes. The speed-distance curve describing each mode of motion is illustrated in Figure 2.
2.2. Train Power Consumption
The power required by a train P is given by the following expression [5]:
where η denotes the efficiency of conversion of the electrical power to the mechanical power, TE denotes the tractive effort, v denotes the instantaneous speed and Paux denotes auxiliary power.
2.3. Voltage Unbalance Factor
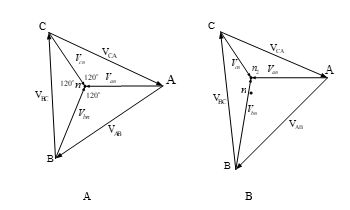
The voltages of a three-phase power supply are ideally equal in magnitudes and phase angles of 120º apart from each other. The three-phase system with those conditions are called a balanced three-phase system and its phasor diagram is shown in Figure 3-A. If the three-phase voltage unbalance occurs, both magnitudes and phases are altered, see Figure 3-B. It can be seen that the neutral point (n) will move to the position of n2. The effects of voltage unbalance, for example, are: the reduction of three-phase induction motor operating lifetime, performance or even failure, etc.
According to IEEE 1159 – 2009, unbalance in a three-phase system is defined as the ratio of the magnitude of the negative sequence component to the magnitude of the positive sequence component, expressed as a percentage. This definition can be applied for either voltage or current. Typically, the voltage unbalance of a three-phase service is less than 2%, especially when a single-phase load is presented. Mathematically, the voltage imbalance is represented as follows [7]:
where %VUF is the percentage of the voltage unbalance factor, Vpos is the positive sequence component and Vneg is the negative sequence component.
|
|
3. ARL System Description and Parameters Calculation
To obtain the voltage solutions of the three-phase power supply and the voltage unbalance factor at the point of common coupling of the ARL traction substation. The parameters calculation and structure of an AC traction power supply, a transformer connection, and an overhead contact system are briefly proposed as follows:
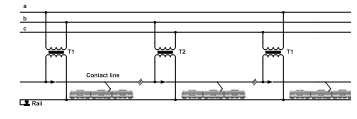
3.1. Cyclic permutation of phases connection
The connection by cyclic connection of phases as shown in Figure 4 can be considered for the advantages in disposition and easier operation of substations, whereas the three-phase short-circuit power in the primary network is remarkably high if compared with single-phase load power. In this arrangement, the single transformer is fed with two phases and the primary three-phase network can be balanced by systematically distributing the phase connection based on the traction loads [8].
|
|
3.2. Structure of the ARL Traction Power Supply
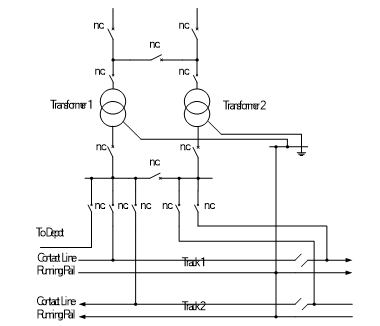
The entire line of the ARL is supplied by a traction power substation (TPS) with 2×20 MVA transformers, located at 8.078 km near Ramkham Haeng station. A minimum short circuit capacity of the utility grid is 2.7 GVA. Transformer’s characteristics data are: Ur = 69/27.5 kV, Sr = 20 MVA, Oil Natural Air Natural, Ukr.= 12 %. The single-line diagram of the substation is illustrated in Figure 5.
|
|
3.3. Overhead Contact System
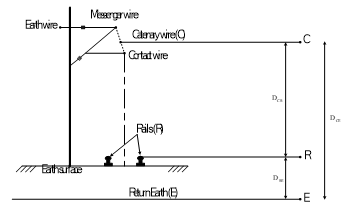
The overhead contact system in Figure 6 consists of catenary (C), rails (R), and earth (E) described as follows: the catenary (C) is formed by a contact wire and one or two messenger wires. They share the current and are always at the same potential. To reduce the system complexity, their impedances are combined all together to form a single conductor. There are two rails (R) in the same track, which are treated as a single cylindrical conductor. There is a wire called “earth wire” that is used for safety reasons and it normally carries no current. It is assumed that the leakage current from the rails flows underneath the track with a depth of DE through a virtual conductor called the return earth by (7) and an earth resistivity can be calculated by (8):
where f is an operating frequency (Hz) and is the earth resistivity ( ).
A reactance caused by electrical induction play an important role in a transmission system for an AC railway power supply. The value of conductor’s reactance in the system is dependent on the conductor arrangement and the distance between conductors, see Figure 6. Impedance per unit length of the catenary and running rail is expressed in (9) and (10).[9]:
|
|
where
ZC is catenary’s impedance per unit length ( )
ZR is rail’s impedance per unit length ( )
is catenary’s resistance per unit length
is rail’s resistance per unit length
is magnetic permeability of air
is magnetic permeability of rails
is catenary’s geometric mean radius
is rail’s geometric mean radius
is a distance between rails in the same track
DCE is a distance between catenary and earth
DRE is a distance between rail and earth
4. Modelling and Simulation Procedure
The model of the traction transformer, catenary, rails and train of the ARL are modelled by using the built-in blocks in MATLAB/SIMULINK. The configuration of the ARL power supply system is briefly mentioned. Lastly, the evaluation of the VUF at the traction substation of the ARL with different scenarios of the train operations is discussed as follows:
4.1. The model of the transformer in the traction substation
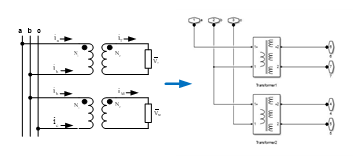
The two traction transformers in the ARL traction substation are alternately connected to different pairs of phases. To estimate the operational voltage and voltage unbalance at the traction substation, the transformer model is formed by using the multi-winding transformer built-in block in MATLAB/SIMULINK program described as follows:
This connection has the same configuration as the single-phase connection except it connects to different pairs of phases. For example, the first transformer is connected to phase AB and the second transformer is connected to phase BC as shown in Figure 7.
|
|
4.2. ARL traction power supply modelling in MATLAB/ SIMULINK
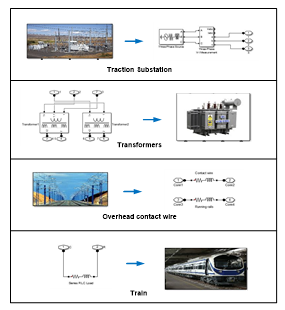
The AC traction power supply modelling is developed in the block models in MATLAB/SIMULINK. The model consists of 4 main parts: (i) AC traction substation, (ii) transformers, (iii) overhead catenary system, and (iv) electric trains as shown in Figure 8. The 69 kV three-phase AC transmission system is represented by the three-phase source built-in block. The transformers will step down the voltage from 69 kV to 27.5 kV using the multi-winding built-in block connected as a cyclic permutation of phases. The overhead catenary and running rails have the impedances obtained from the textbook [9] and BS EN 50149:2012 standard. The series RLC branch built-in block is used to model this transmission and return circuit system. Lastly, the electric trains are modelled as a series RLC load.
|
|
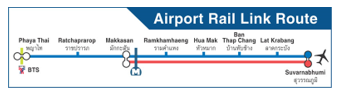
The ARL system was modelled for the simulation tests in this paper. The ARL was the first electric mass transit railway operated with overhead catenary system or overhead contact system to commence operations in Thailand. The ARL is composed of 8 passenger stations and one traction substation as shown in Figure 9. Parameters’ setting for this simulation can be found in Appendix.
|
|
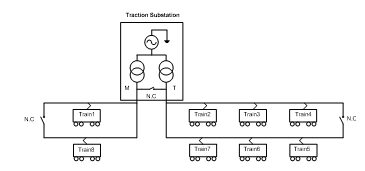
The AC traction substation of the ARL draws the electrical energy with the voltage level of 69 kV from the metropolitan electricity authority (MEA). The traction substation transformers with an alternate phase connection transform the grid voltage into the train’s nominal voltage of 27.5 kV. The total service distance is 28.298 km and the traction substation’s position is at 8.078 km. In the simulation, the trains depart from both tracks at the same time with the same headway throughout the service, e.g. the first and fifth trains start the operation at the same time, also the second and the sixth trains and so on as shown in Figure 10.
|
|
4.3. Simulator structure
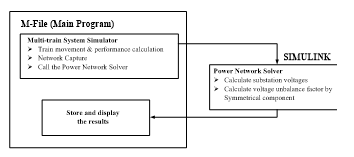
The simulator has 2 major parts: main program (script M-file) and the power network solver (SIMULINK). The main program performs the multi-train movement, performance calculation, and the network capture, i.e. sorting trains on service, setting the distances between the components in the system and the train data. Then, the trains’ positions and powers together with the distances recently mentioned are transferred into the SIMULINK block model to solve the voltage solution (primary and secondary voltages of the substation) and VUF. Finally, those values are returned to the main program to be stored and display the graphical illustration. The operating diagram is shown in Figure 11.
5. Simulation Results and Discussion
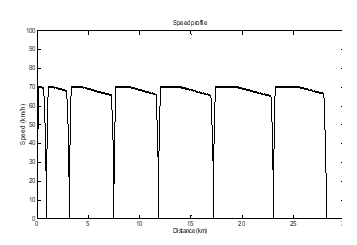
The results showed the VUFs at the point of common coupling of the ARL traction substation with four different scenarios as shown in Figure 12. The operational conditions, i.e. headways and the train configurations, are given in Table 1. Each train has the maximum speed of 70 km/h and the speed profile is shown in Figure 13.
|
|
|
|
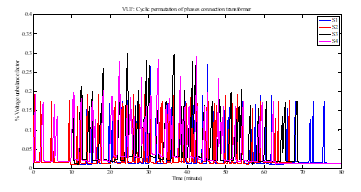
Table 1: Operational conditions of Suvarnabhumi Airport Rail Link.
| Scenario | Headway | Train configuration | Total weight | Auxiliary power |
| S1 | 15 min | 3 car train | 183.67 t | 200 kVA |
| S2 | 12 min | 3 car train | 183.67 t | 200 kVA |
| S3 | 12 min | 4+3 car train | 422.64 t | 450 kVA |
| S4 | 10 min | 4+3 car train | 422.64 t | 450 kVA |
|
|
Considering scenario S1 and S2 in Figure 12, the VUF obtained from S2 was found to be lower than that from S1 because the total weight and auxiliary power of S1 and S2 are equal to each other but the headway of S1 is longer than that of S2. It can be noted that when the headway is shorter, the number of trains appear in the system, so the total loads on the left and the right of the substation were more likely to have the same values leading to less voltage unbalance. To study the effect of different total weight and auxiliary power of the train on the voltage unbalance, scenario S2 and S3 were compared. As the total weight and auxiliary power load of S3 were greater than those of S2, more power would be consumed in S3, and there was more possibility of different amount of consumed power between the left and right side of the traction substation. Thus, the voltage unbalance of S3 was more than that of S2. In addition, the comparison between S3 and S4 gave the same result as the S1-S2 comparative result. However, due to more weight and auxiliary power load in S3 and S4 compared to S1 and S2, the voltage unbalance in S3 and S4 was more than that of S1 and S2, respectively and the voltage unbalance of S3 was more than that of S4 because the headway of S3 was longer. In the viewpoint of the maximum %VUF for each scenario as shown in Table 2, it helped confirm the above explanation since the results seen from Figure 12 were consistent with the results from Table 2.
From the results, it could be concluded that the longer the headway, the more voltage unbalance. That meant the voltage unbalance was more reduced when the trains were released more frequently. The total weight and auxiliary power also affected the voltage unbalance. According to IEEE 1159 – 2009 standard, the %VUF must not exceed 2%. Therefore, the service extension of the ARL can be carried out without any violation of voltage unbalance based on this simulation results.
Table 2: The Maximum %VUF
| Scenario | %VUF Max | Comparison with IEEE 1159 -2009 standard (2%) |
| S1 | 0.2717 | Less than 2% (passed) |
| S2 | 0.1946 | Less than 2% (passed) |
| S3 | 0.2993 | Less than 2% (passed) |
| S4 | 0.2906 | Less than 2% (passed) |
6. Conclusion
This paper presents the study of voltage unbalance caused by the AC railway power supply system using MATLAB/Simulink. The VUF was the key factor in this consideration. The test system was the ARL linking Suvarnabhumi airport to the Bangkok city center. The traction transformer connection type was the cyclic permutation of phases. The VUF was estimated in four scenarios of the train operations. The results showed that at the same headway, the VUF was increased when the train weight and auxiliary power load were increased due to the increase in energy drawn by the trains. For different headways, the longer the headway, the more voltage unbalance. However, the increased VUF was still within the limit of 2% imposed by IEEE 1159 – 2009 in every scenario. Accordingly, the extension plan of the ARL by increasing routes, service distance, and the number of trains in the future will slightly affect the voltage unbalance. However the VUF is limited within the acceptable value.
Acknowledgment
We would like to express our sincere gratitude to Suranaree University of Technology for financially supporting this research.
Appendix
Overhead catenary system for ARL:
- Contact wire: Cu 107mm² (20% abrasion)
- Messenger wire: Bz 70mm²
- Return Conductor: E-Al 120mm²
- Rails: UIC 60, 15%
Traction power substation for ARL:
- 2×20 MVA transformers (cyclic connection)
- 69/27.5 kV, 12% impedance, ONAN
- Short-circuit power of the substation is 2.7 GVA
Train resistance parameters:
| 3-car train | 4+3-car train |
| Tare weight: 131 tons | Tare weight: 299 tons |
| Rotary portion of tare weight: 6% | Rotary portion of tare weight: 6% |
| Maximum payload: 44.9 tons | Maximum payload: 105.7 tons |
| Maximum design speed: 160 km/h | Maximum design speed: 160 km/h |
| Maximum acceleration: 1 m/s2 | Maximum acceleration: 1 m/s2 |
| Maximum deceleration: 0.88 m/s2 | Maximum deceleration: 0.88 m/s2 |
| Gear/Motor/converter efficiency: 82% | Gear/Motor/converter efficiency: 82% |
| Maximum auxiliary power: 200 kVA | Maximum auxiliary power: 450 kVA |
| Maximum tractive effort: 200 kN | Maximum tractive effort: 400 kN |
|
Train resistance formula: A = 2.1222 B = 0.00618 C = 0.3197 |
Train resistance formula: A = 4.8438 B = 0.01412 C = 0.53287 |
- N. Mingpruk, U. Leetonand, T. Kulworawanichpong, “Modeling and simulation of voltage unbalance in AC electric railway systems using MATLAB/Simulink”. IEEE/SICE International Symposium on System Integration, 2016.
- Applications of Mathematics, “Tractive effort, acceleration and braking”, The Mathematical Association, 2004.
- S. Lu, “Optimising power management strategies for railway traction”. PhD Thesis, University of Birmingham, UK, October 2011.
- BP. Rochard, F. Schmid, “A review of methods to measure and calculate train resistances”. Proceedings of the Institution of Mechanical Engineers, Part F: Journal of Rail and Rapid Transit, Vol. 214, No. 4, p. 185–199, 2000.
- T. Kulworawanichpong, “Optimising AC electric railway power flows with power electronic control”. PhD Thesis, University of Birmingham, UK, November 2003.
- M. Kalantari, M. J. Sadeghi, S. Farshad, S. S. Fazel, “Modeling and Comparison of Traction Transformers Based on the Utilization Factor Definitions”, Internation Review on Modelling and Simulation (I.RE.MO.S.), Vol. 4, N. 1, pp. 342 – 351, February 2011.
- IEEE recommended practice for monitoring electric power quality, IEEE std 1159 – 2009 (Revision of IEEE std 1159 – 1995), pp. c1 – 81, June 2009.
- F. Ciccarelli, M, Fantauzzi, D. Lauria, R. Rizzo, “Special Transformers Arrangement for AC Railway Systems,” Department of Electrical Engineering – University of Naples Federico II, Naples (Italy), 2014.
- F. Kiessling, R. Puschmann, A. Schmieder, E. Schneider, Contact Lines for Electric Railways, 2nd revised and enlarged edition, pp. 664 – 666, 2009.