Optimal Plant Growth in Smart Farm Hydroponics System using the Integration of Wireless Sensor Networks into Internet of Things
Optimal Plant Growth in Smart Farm Hydroponics System using the Integration of Wireless Sensor Networks into Internet of Things
Volume 2, Issue 3, Page No 1006-1012, 2017
Author’s Name: Nathaphon Boonnam1, a), Jumras Pitakphongmetha1, Siriwan Kajornkasirat1, Teerayut Horanont2, Deeprom Somkiadcharoen2, Jiranuwat Prapakornpilai2
View Affiliations
1Department of Applied Mathematics and Informatics, Faculty of Science and Industrial Technology, Prince of Songkla University, Surat Thani Campus, 84000, Thailand
2School of Information, Communication and Computer Technologies, Sirindhorn International Institute of Technology, Thammasat University, 12120, Thailand
a)Author to whom correspondence should be addressed. E-mail: nathaphon.b@psu.ac.th
Adv. Sci. Technol. Eng. Syst. J. 2(3), 1006-1012 (2017); ![]() DOI: 10.25046/aj0203127
DOI: 10.25046/aj0203127
Keywords: Wireless Sensor Networks, Internet of Things, Hydroponics

Export Citations
Greenhouse cultivation is easy to keep up and control important factors such as light, temperature, and humidity. Using of sensors and actuators in the greenhouse to capture different values allows for the control of the equipment, it can also be optimized for growth at optimal temperature and humidity of various crops planted. We use wireless sensor networks’ system by sending results to the cloud service, monitoring values, and devices’s controlling via smart phone. The results of this study are useful for growing crops not only in technical parts, but also in physical part; it was evaluated by questionnaire using technology acceptance model.
Received: 30 April 2017, Accepted: 24 June 2017, Published Online: 10 July 2017
1 Introduction
Technology can link everything to the Internet called the Internet of Things (IoTs). This means that the human beings control any object using a wireless sensor network (WSN) which makes convenience to everyday life. Technology can be applied in many fields such as home, city, wearable, industrial, health, retail, farming, etc. IoTs refer to the network of objects, vehicles, buildings, and other electronic detectors, as well as software for connecting networks to exchange data from sensors or actuators. IoTs can also make people aware of the environment and remote control over the existing network infrastructure. We can integrate the physical world into the computer system and virtual resources available on the internet to provide both value-added data and functionality for users. The trend of 2020 IoTs usage will increase by 50 billion objects were expected to be connected in the IoT [1].
IoTs’ devices include RFID, sensors, and computer nodes. The system must have an internet connection that the devices can send data and receive results to communicate with each other. If there is no connection to the Internet but there are also some models
2 Related Work
Greenhouses can control easily the environment inside their houses and disease outbreak in plants. It can reduce energy consumption for the growth of the plant fully. The benefits of greenhouses are high, but the investment is also high. The original purpose of the greenhouse is able to grow crops that cannot normally grow in the climate of that area. If a good greenhouse system was managed, the greenhouse system can grow all kinds of crops in the right habitat.
Hydroponics is a plant that does not use soil, but that uses water with nutrients dissolved or planted in nutrient solution. This is a new way to grow crops especially growing vegetables and plants used as food. Because of saving space and non-contaminated with chemicals in the soil, we get clean and fresh vegetables. Nowadays, hydroponics has two main benefits; first, it allows for a more controlled environment for planting growth instead of using the same soil eliminating many unknown variables out of many experiments. Second, many plants produce much less time and sometimes better quality in a certain economic environment and condition. Hydroponics will bring more profit to farmers, have no disease in the soil, and it can grow crops very close together. For this reason, the plants produce more volume while using limited space. There is also very little water use because of the use of containers or closed loop water system to circulate water compared with traditional agriculture.
Hydroponics technology uses it gently such as measuring ions, pH, and temperature in water. By adopting sensors with the microcontroller, we get the bills in the greenhouse and analyze the information to control the water supply from this paper. Making WSNs work helps us saving costs in many areas, such as energy, labor costs, and chemical costs. And it can make long-term value.
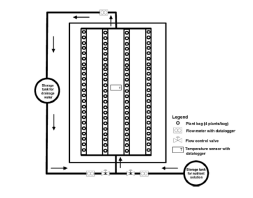 Figure 1: Schematic of the hydroponic greenhouse system used in this study [6]
From the beginning step of our research, we build a greenhouse and take the sensor to control the crops of Hydroponics freely as automation [5] which requires modeling as we want to fit the environmental management by placing the sensors in order to provide humidity control in relation to the ambient air temperature. The conditions were met by installing a color bulb to feed the plants LED representing of red (R) and blue (B) in emission either warm (4700K+2700K) or cool white in parenting [6] and managing water to save water as shown in Figure 1.
The development of today agriculture brings more and more applied technology have a reference and understanding of the environment that is important in the economic production. The yield is sometimes uncertain because of lack of environmental planting’s understanding. It creates the WSNs’ technology for environmental monitoring and theft detection; simple, cheap, and easy to use the system the detect the data of temperature and humidity in the air covered on the greenhouse properly.
Since we do not want to control by our own, we have to look for the way that technology can control itself automatically. The technology that we mentioned above called Message Queuing Telemetry Transport (MQTT). This is communication technology between sensors as M2M (machine-to-machine) connected with the lightweight protocol. MQTT is designed for the small electronics, small traffic data, and low-bandwidth networks. It can be not only linked to devices simultaneously but also changed the information together. This means that we can make your devices into the bigger network allowing it to control the device where it was needed to turn on-off the devices [5] as shown in Figure 2.
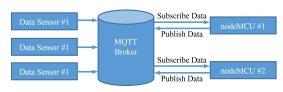 Figure 2: Flow Diagram of MQTT with nodeMCU
Nevertheless, there are many types of protocols, such as HTTP and XMPP. MQTT on IoTs will have an MQTT Broker to manage the storage that can send information to hardware. MQTT clients and servers handle complex messages for mobile applications and reduce network management costs. MQTT applications run on mobile devices, such as smartphones and tablets. MQTT was used for sensor and remote control data reception.
3 System Design and Realization
| Parameter | Value | Voltage |
| Temperature & Humidity | DHT-11 | 2.5mA |
| Ultrasonic Sensor | HC-SR04 | 15mA |
| Relay Board | 4 Channel | 10mA |
| Grow light | – | 1.7mA |
| Solenoid | Plastic 1/4 | 1.3mA |
| Architecture | Greenhouse | – |
Adaptation of agriculture is difficult. We have to invite an agency to improve agriculture and make the agricultural sector more productive. Therefore, we make one more comfortable and efficient technology provided that farmers understand for controlling the greenhouse. We can use one of the mobile application called Blynk. It can be used the control system via API from the application into the operation of various devices and also tracked the data via mobile without technology knowledge. It is easy for people who do not have the ability for using technology. Moreover, the Blynk’s user interface system is very easy to use. This following is the devices in details used in this work as shown in Table 1.
Table 1: Deployment parameters
3.1 Monitoring Interface
This work was divided into two major topics: hardware and software requirements. The first topic shows in details such sensors, actuators, and components in the system. The second topic deals with software that was used for connecting hardware controls such as turning on-and-off grow light and water pump.
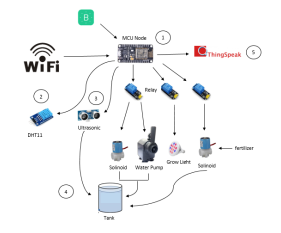 Figure 3: Phototype of system
Hardware Requirements: The main components of the prototype as shown in the Figure 3. The details of each section are as follows:
- NodeMCU is use to implement the monitoringmodules. The following sensors and other peripherals were used to collect real time data from the field.
- DHT11 is a relatively cheap sensor for measur-ing temperature and humidity values.
- Four Channel Relay Board (5V) for switchingAC/DC is used to high level trigger with AC motor (220V) to operate the electricity devices.
- Ultrasonic Sensor Module (HC-SR04) includesan ultrasonic transmitter, receiver, and circuit.
There are four pins measuring 5-700 cm. used to detect the water level in tank.
- Grow light is an artificial light source used tokeep plant growth at night by emitting an electromagnetic.
- Solenoid is the device controls the opening andclosing of the water flow.
- Water pump is water pushers move forwardfrom the tank to the pipe hydroponics.
Sensor data was connected to the ThingSpeak™as API to store all results to the cloud results to the database as shown in Figure 4. In order to analyze the future information, we retrieve the information on the smart phone device control which can be controlled by grow light and water pumps.
Software Requirements: Sending data from hardware to smart phone by using the Arduino IDE as a communication medium. Here, the smart phone application was called Blynk.
Blynk is an open-source electronics prototyping platform which is a modified version of Wiring/Arduino IDE with iOS and Android apps to control Arduino board using the Internet as shown in Figure 4.
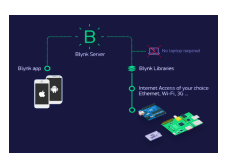 Figure 4: Blynk platform
Blynk platform with iOS and Android apps to control Arduino, Raspberry Pi, and the likes over the Internet. It is a digital dashboard where you can build a graphic user interface for your research by simply dragging and dropping widgets.
3.2 Greenhouse Specification
- Area: The greenhouse is mounted on the roof of the building with the size of 2.4 * 5.3 * 2.0 (length * width * height: m).
- Plants: The plants used in this study is Cantonese that season pale green succulent stems, petioles 25-40 cm. wide, 5-15 cm. long. Vegetable consumption grows rapidly; it can be harvested just 35-45 days. We acknowledged the seeds coming from Mae Jo University as an organic grain.
4 Results
4.1 Productivity receive
First generation’s Productivity: Due to the high temperature of the plant, 48 plants dying in the first week since maximum temperature is 44◦C measured from the sensor via the IoT. The DHT11 sensor was used to measure in the survival rate 0% as shown in Figure 5.
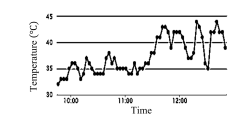 Figure 5: Temperature in the first week
Next step, we created a 50% black SLAN UV filter mesh filter under the roof. Then the heat in the greenhouse is noticeably reduced, as shown in Figure
6.
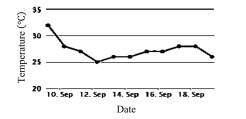 Figure 6: Temperature after installing filter UV 50%
Second generation’s productivity: After reducing temperature by UV filtration inside a greenhouse, 48 plants can be survived 22 plants. This means that the survival rate is 45.83%. It can be seen that from the lower temperatures, the plants were more survived. Hence, this is better productivity for growing as well. The ultrasonic sensor monitors the amount of water in the tank if it is lower than normal as we set up for the suitable value of water level in the tank. After instant processing, the solenoid valve was working to add water until full of water. Both devices work reliably Ultrasonic sensor sends the up-to-date data which we can desire the duration time for collecting data into ThingSpeak™. The simulation of the water level can be represented by graph plotted by the relationship between water usage and time as shown in Figure 7.
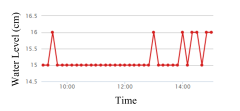 Figure 7: Water usage represented to ThingSpeak™
Electronic devices, such as the solenoid and UV light, were controlled by nodeMCU which makes the connection with the sensor and sends data to ThinkSpeak™for processing devices work of vegetables growth as well as shown in Figure 8.
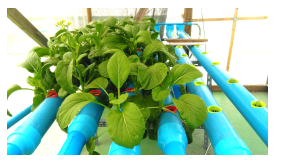 Figure 8: Vegetables growth in the greenhouse
The greenhouses can work automatically and control via the applications controlled by the mobile device. The connections were able to control by NodeMCU. Freely, no matter where we are around the world, you can control via Blynk, the top and middle part displays the current temperature and the status of the device, respectively, as shown in Figure 9. Remark that it is really simple to set up everything and start customizing. Blynk is one application instead of supports hardware of your choices whether your Arduino was linked to the Internet over Wi-Fi, Ethernet, or this new ESP8266 chip.
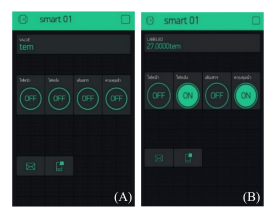 Figure 9: Blnk Applications: (A) Draft display screen (B) Display screen after processing
The sensor data including temperature and relative humidity were recorded to the ThingSpeak™every 3 minutes frequently. Not only all data from sensors were processed in a reasonable manner for the next plotted graph, but also the location of this study from Google API service of ThingSpeak was represented from all tasks can get the appropriate information of the survival plant. It can be seen that the temperature and humidity in the air inverse variation as shown in Figures 10 by analyzing with principal component analysis.
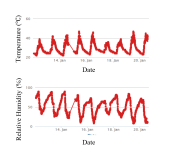 Figure 10: All data of temperature and relative humidity
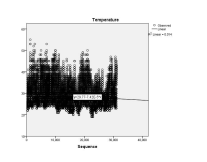 Figure 11: Relationship between temperature and time
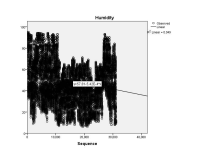 Figure 12: Relationship between relative humidity and time
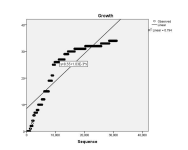 Figure 13: Relationship between plant growth and time
We brought all the data to create the chart for finding the appropriate value through the SPSS program. We plotted the graph for finding the correlation between temperature, humidity, growth with time as shown in Figures 11-13, respectively. We can arrange the correlations observation by linear regression represented by
n
X
x; ∇y = yi,
i=1
where yi,i = 1,2,3 denotes temperature, humidity, and growth variables, respectively.
Since we analyze from principal component analysis, we can consider the communalities and total variance explained as initial eigenvalues as shown in Tables 2-3.
| Component | Initial Extraction | Time |
| Time | 1.000 | 0.730 |
| Temperature | 1.000 | 0.858 |
| Humidity | 1.000 | 0.857 |
| Growth | 1.000 | 0.971 |
Table 2: Factors Processed by Principal component analysis
| Component | Total | Variance % | Cumulative % |
| Time | 2.301 | 57.531 | 57.531 |
| Temperature | 1.115 | 27.871 | 85.402 |
| Humidity | 0.404 | 10.089 | 95.491 |
| Growth | 0.180 | 4.509 | 100.000 |
Table 3: Total variance explained with initial eigenvalues
Notice that the temperature reverse variation with humidity. From the total variance explained the acceptance of correlation’s observation with 70%, we can see the humidity was adapted growth extremely as well. However, the temperature is one of factor reacted with growth as necessary condition.
4.2 Control Testing
In our evaluation, we tested 10 times for checking the efficiency of delay controlling. The Statistical tool is mean or average (AVG). Hence, the result is not significant as shown in Tables 4-5. This means that both testing control inside and outside the LAN Delay were equated.
| NO. | Inside the LAN Delay(s) | |||
| LED | Solenoid | |||
| Turn on | Turn off | Turn on | Turn off | |
| 1 | 5.0 | 5.0 | 4.0 | 0* |
| 2 | 5.0 | 5.0 | 6.0 | 0* |
| 3 | 4.0 | 7.0 | 4.0 | 0* |
| 4 | 5.0 | 6.0 | 5.0 | 0* |
| 5 | 6.0 | 7.0 | 5.0 | 0* |
| 6 | 6.0 | 8.0 | 3.0 | 0* |
| 7 | 7.0 | 10.0 | 6.0 | 0* |
| 8 | 8.0 | 14.0 | 4.0 | 0* |
| 9 | 10.0 | 12.0 | 8.0 | 0* |
| 10 | 14.0 | 13.0 | 3.0 | 0* |
| AVG | 7.0 | 8.7 | 4.8 | 0 |
Table 4: Moblie Control Testing via Blynk in case of inside the LAN delay
| NO. | Outside the LAN Delay(s) | |||
| LED | Solenoid | |||
| Turn on | Turn off | Turn on | Turn off | |
| 1 | 6.0 | 10.0 | 8.0 | 0* |
| 2 | 5.0 | 9.0 | 6.0 | 0* |
| 3 | 6.0 | 10.0 | 7.0 | 0* |
| 4 | 4.0 | 10.0 | 7.0 | 0* |
| 5 | 5.0 | 8.0 | 8.0 | 0* |
| 6 | 6.0 | 7.0 | 9.0 | 0* |
| 7 | 7.0 | 9.0 | 10.0 | 0* |
| 8 | 8.0 | 6.0 | 14.0 | 0* |
| 9 | 9.0 | 7.0 | 19.0 | 0* |
| 10 | 10.0 | 9.0 | 14.0 | 0* |
| AVG | 6.6 | 8.5 | 10.2 | 0 |
Table 5: Moblie Control Testing via Blynk in case of outside the LAN delay
Remark the 0* that the sensor stops the water to overflow the tank makes Solenoid stop working.
4.3 Evaluation Method
Technology Acceptance Model (TAM) was a recognized and well-known theory as a measure of success. Using TRA technology to develop a TAM model and use it to study in the context of the adoption of information systems. Without adopting the norms of the surrounding people. Behavioral display it was used as a factor in forecasting actual usage behavior.
Evaluation methods in how we will test our prototype show control over let the enthusiasts play mobile apps users will need more time 5-10 minutes per person. The rating 5 points 4 scale questionnaires based in TAM provides the theory by being one, there are external variables, how the influence Attitude and willingness to use in the research, the model was designed as follows:
- Study on the use of TAM as the principle to cre-ate a 4-D combination of forms 4 main factors of TAM 16 articles,
- Satisfaction and meaning 5 agree that Stronglyagree 4 means Agree , 3 means ’Neutral,2 means ’Disagree’, and 1 means to ’ Strongly disagree’,
- Those interested in the quiz after our presenta-tion Android application,
- Collect results Assessment, and
- Analysis of Cronbach (performance by processing using the SPSS program standard the achievement of Cronbach) must be 0.7 or higher.
We consider four factor of TAM as follows:
- Perceived Usefulness (PU) is a perception of thetechnology use. The technology will make the job better. Make more revenue.
- Perceived Ease of Use (PEU) is a perception thatthe technology is easy to use. Users are more comfortable than ever.
- Online Cognitions (OC) is a perception data onthe Internet through online for helping people recognize information through social media, and viable online communities.
- Behavior Intention (BI) is behavior in technol-ogy that influences the intended and actual use of technology.
Our questionnaire used all factors of TAM such as Perceived Usefulness, Perceived Ease of Use, Online Cognitions and Behavioral Intention to Use in Figure 14.
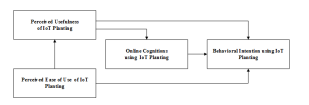 Figure 14: TAM for system Smart Farm Hydopronics Style
4.4 Sample Storage
The sample size for this study was 30, totaling 30 Thai persons in the age range of 20-40 years living in Suratthani as shown in Table 7.
| Attrinute | Value | N | Percentage |
| Gender | Male | 11 | 36.3% |
| Female | 19 | 63.6% | |
| Age (years) | 20-24 | 10 | 33.3% |
| 25-29 | 10 | 33.3% | |
| 30-34 | 7 | 23.3% | |
| 35-39 | 3 | 33.5% | |
| IT usage ability | Nothing | 0 | 0.0% |
| Moderate | 18 | 60.0% | |
| High | 12 | 40.0% |
Table 6: Details of Samples
4.5 User Satisfaction
Analyzing the data using SPSS22. The Cronbach’s alpha Coefficient and Pearson Correlation of evaluation as shown in Tables 8-11.
| Factors | Cronbach’s α Coeffi | cient |
| PU | 0.744 | |
| PEU | 0.763 | |
| OC | 0.816 | |
| BI | 0.721 |
Table 7: Reliability Coefficient of Constructs
From the result in Table 8, the value of all factors is greater than 0.7, which was considered reliable and accepted average satisfaction of each factor the result
and analyze the average of evaluation satisfaction of each factor as shown in Table 9.
| Factors | Average | S.D. |
| PU | 3.6754 | 0.51003 |
| PEU | 3.8653 | 0.57487 |
| OC | 3.8667 | 0.54756 |
| BI | 3.5671 | 0.63521 |
Table 8: Average Satisfaction of Each Factor
After that, we find the relationship between two weighted variables in the level measurement section as Independent or dependent factors. Correlation coefficient is a measure of dependence between two factors to interpret the TAM by using Pearson Correlation as shown in Table 10.
| Factors Relationship | P.C. | R2(%) | |
| Independence | Dependence | ||
| PEU | PU | 0.731 | 0.559 |
| PEU | BI | 0.724 | 0.603 |
| PU | OC | 0.873 | 0.758 |
| PU | BI | 0.746 | 0.724 |
| OC | BI | 0.623 | 0.454 |
Table 9: Factors Correlation
Suggest that the correlation of PEU and OC is the most related together. For another correlation, almost factors have relation closer as shown in Figure 15.
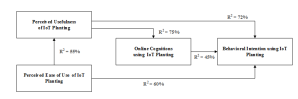 Figure 15: Relational Model of Factors Relationship
5 Conclusion and Future Work
Sensor technology was intended for the automatic control devices via mobile accurate correctly. This technology will save time to look for vegetables which people can eat healthily. Farmers need some helps in the different stages of crop growth and the guidance should be given at the right time. Farmers are suffering a lot of problem; economy, social, and politics. Various challenges in the agricultural domain were identified. The architecture of the challenges mentioned above, knowledge-based structure have various details about agriculture, flow, various input such as market availability, geospatial information and weather prediction. Monitoring system contains modules like remainder, monitoring plant growth in various stages, irrigation planner, and the water need of a plant per day with devised algorithms help
The future work of this study will be developed the sensor for using in public actually. We will study the process of using machinery or machinery to determine the growth of crops and harvest the crops in order to save time and labor. Each vegetable was calculated to get the right temperature for the vegetable.
Acknowledgment This research was financially supported by Prince of Songkla University, Surat Thani Campus, 2015. Furthermore, the present author would like to deeply express thanks to Intelligence and Intelligent Informatics (AI3) Laboratory, Sirindhorn International Institute of Technology, Thammasat University for making the experiment and giving him various comments.
- G. L. Atzori, A. Iera, G. Morabito, The Internet of Things: a survey Comput. Network, Computer Network, 54,27872805, 2010.
- H. Sundmaeker, P. Guillemin, P. Friess, S. Woelf (Eds.) Publications Office of the European Union, Luxembourg, 88, 299309.,2016.
- Sjaak Wolfert, Lan Gea, Cor Verdouw, Marc-Jeroen Bogaardt Big Data in Smart Farming , Agricultural Systems,153,6980, 2017.
- Harsharn S. Grewala, Basant Maheshwaria, Sophie E. Parksb,Water and nutrient use effciency of a low-cost hydroponic greenhouse for a cucumber crop: An Australian case study, Agricultural Water Management,98, 841846,2011.
- J.delSagrado, J.A.Snchez, F.Rodrguez, M.Berenguel, networks for greenhouse temperature control Journal of Applied Logic, 17, 2535,2016.
- Olga Dugosz-Grochowska, Anna Koton, Renata Wojciechowska, Modifying folate and polyphenol concentrations in Lambs lettuce by the use of LED supplemental lighting during cultivation in greenhouses, Journal of Functional Foods,.26 ,228237, 2016.
- A.W. Al-Kayssi, Spatial variability of soil temperature under Greenhouse conditions,, Renewable Energy,27, 453462,2002.
- I. Mohanraj, Field, Monitoring and Automation Using IoT in Agriculture Domain, Procedia Computer Science,93, 931939, 2016.
- M. Azaza , C.Tanougast , E.Fabrizio , A.Mami, Smart greenhouse fuzzy logic based control system enhanced with wireless data monitoring, 61, 297307, 2016.
- L. Atzori, A. Iera, G. Morabito, M. Nitti, The social internet of things (siot) when social networks meet the internet of things: concept, architecture and network characterization, Comput. Netw. 56 ,35943608,2012.