Template-like Tensor Domain Operations to Enhancing Diffusion Datasets Quality
Template-like Tensor Domain Operations to Enhancing Diffusion Datasets Quality
Volume 2, Issue 3, Page No 987-995, 2017
Author’s Name: Fernando Yepes-Calderon1, a), Flor M. Medina2
View Affiliations
1Children’s Hospital Los Angeles, Neurosurgery Division, 90027, USA
2Fundación Valle del Lili, Imágenes Diagnósticas, Colombia
a)Author to whom correspondence should be addressed. E-mail: fyepes@chla.usc.edu
Adv. Sci. Technol. Eng. Syst. J. 2(3), 987-995 (2017); ![]() DOI: 10.25046/aj0203125
DOI: 10.25046/aj0203125
Keywords: Tractography, Image enhancement, Tensor averaging, Tensor rotation, DTI

Export Citations
Diffusion MRI-based tractography, which is built by connecting the principal components of the estimated water diffusion pattern, is used to elucidate neuronal connectivity. However, the anatomical accuracy of the method is affected by factors such as noise and imaging misalignments. In this manuscript, we present a method to clean diffusion datasets by rotating the diffusion patterns according to a transformation matrix, that is in turn obtained in the fractional anisotropy domain. We demonstrated the accuracy and feasibility of our method by improving brain images of a mouse and also by creating a diffusion template in a neonates framework.
Received: 05 April 2017, Accepted: 05 June 2017, Published Online: 10 July 2017
1 Introduction
thoroughly tested on programmatically created diffusion phantoms and translated to both, the small animals and the clinics.
The diffusion-based methods of magnetic resonance imaging (dMRI) are capable of elucidating microstructural insights by estimating the water patterns of displacement into the tissue under study [1, 2]. Briefly, if there are not boundaries hindering the free movement caused by Brownian motion, the water diffuses isotropically. On the contrary, when there are restrictions, the water displacement occurs along the open spaces tracing a preference proper of the anisotropic diffusion. Thus, the images produced with dMRI are particularly useful for lighting neuronal state and trending, which has been vastly explored [3, 4, 5] and to study the integrity of muscle fiber [6, 7]. In the brain, dMRI is an outstanding tool that allows the follow up in horizontal research; this property together with the non-intrusiveness nature of magnetic resonance imaging (MRI), have lead to several studies of neurodegenerative assessments including Parkinson [8, 9], Multiple sclerosis [10, 11], Schizophrenia [12, 13] among others. However, dMRI is a time-consuming technique and image quality as any other MRI procedure deteriorates rapidly if the scanning time is reduced. The timing issue has restricted the dMRI to be fully implemented in the clinics, and currently, it is only used to diagnose stroke in ultra rapid sequences where the whole head volume is scanned three times to covering the orthogonal axes and once more to produce the reference signal (B0) needed to compute diffusion [14, 15]. Despite this clinical acquisition scheme yields images with a bad Signal-to-Noise ratio, it is enough to localize the swelling processes depictive of stroke. As for other applications in the clinics regarding dMRI, it is mandatory to use a higher angular resolution like in diffusion tensor imaging (DTI) [1, 16] or high angular resolution diffusion imaging (HARDI) [17, 18]. The required time to implement these high angular resolution techniques renders it use prohibited in the clinics. Researchers in their side, have the flexibility to plan the scans and recruit the patients. They can also apply standard methods to all samples and care for repeatability. Thanks to this flexibility humanity has faced in detail, important aspects and the core of neurodegenerative diseases. However, a full understanding requires close monitoring of the dynamic apoptotic events which calls the attention over the small animal modeling field. Here, scaning time is a concern only for ethical reasons but, spatial resolution is so exigent that the quality gained by the wider scanning periods is lost in the little spin recruitment induced when reducing the voxels’ size. Additionally, at grids of cents of micrometers as used in the small animal MRI field, a slight movement in the physical setup is traduced in huge displacements or rotations in the image. In this document, we present a method that enhances the quality of dMRI datasets. Here, we turn deteriorated diffusion images into meaningful ones. More importantly, the quality is improved with every new session which is of utmost relevance in horizontal studies. The method was developed and
2 Materials and Methods
The Fig. 1 depicts the common dMRI pipeline under the DTI modeling.
Our driving hypothesis focuses on DTI and states that a diffusion study is more cost and time effective if an averaging is done in the tensor space rather than in the Diffusion Weighted Imaging (DWI) domain. Often, quality enhancement in dMRI is achieved by incrementing the number of machine averages which increments the acquisition time. We instead propose to use several images acquired in the low SNR regime and perform the average-enhancing strategy in the tensor domain. The averaging proposed here is not an obvious one. Recall that tensors are 3 by 3 matrices representing a diffusion geometry –all forms ellipsoids including the sphere– and consequently, a corrective action is not as simple as performing a linear operation over the axes of the images. To elaborate on this aspect, we summarize a theoretical framework that illustrates our rationale on a toy example using numerical phantoms.
2.1 Creating synthetic diffusion phantoms
Synthetic DWI signals can be created and manipulated to reproduce rotational structural misalignments in noise-free situations and with added Rician noise using the framework mentioned above. For demonstrative purposes, a synthetic-diffusion phantom is created from which, one diffusion voxel or a group of them (V) are selected. The V contains several diffusion patterns as shown in Fig. 2. Each of them is restricted to a cylinder of ρ = 5µ and length L = 5mm, where the particles diffuse at 1/1500 mm2/s as in [19]. This cylindrical model for diffusion mimics the preferential direction of water motion in the free space between cells, voxel by voxel. We define an initial reference signal resting along the x-axis (Dref ), see Fig. 2-AI, which is a compendium of diffusion patterns in each voxel that together create a preferred global diffusion as it would do a brain tract under dMRI. Then, using this model, we create other synthetic diffusion patterns that are rotated creating the desired misalignments, as in frames AII and AIII of Fig. 2.
Assume then that each diffusion pattern comes from a single fiber, like in fiber tracking [20]. Each fiber orientation is then governed by Equation. 1.
pi pi
f ibi = cos(α ∗ ),sin(α ∗ ),0 . (1)
180 180
Where the parameter α will be zero in the synthetic Dref signal, and will receive any value in the range [0,90] whenever non-overlapping diffusion signals are simulated among acquisitions. Here, f ibi represents the i simulated pattern. Fig. 2-Panel A illustrates this procedure.
The diffusion coefficents in the V are derived by taking the log on both sides of the Sketjal-Tanner equation as in [21]:
log(Sˆi) = log(So)−bgi0Dgi (2)
Where So is the non-sensitized signal, b is the bvalue, gi is the gradient direction, D is the diffusion factor, and Sˆi is the DWI signal for the gi direction. The Sˆi factor can be decomposed into the ideal signal Si and a Rician noise component, represented as two independent Gaussians N1 and N2 with a variance σ:
| Sˆi = p[Si +N1(0,σ)+N2(0,σ) | (3) |
The diffusion tensors Dt are estimated in the Logeuclidean (LE) domain (where they are represented by the parameter L) using the D contributions from all gradient directions:
L = log(D) ↔ Dˇ = exp(Lˇ) (4)
The operations in the LE domain are computationally inexpensive when compared with other manifoldbased methods such as [22, 23, 24]. To see details of how the LE outperforms other common tensor estimation strategies; please refer to the document [21]. Tensors in the LE domain can be moved back to the original tensor space through Equation 4.
For the framework described in this section, rotations are forced to be in the x-y plane (about the zaxis). Hence, rotational corrections under ideal conditions are generated using Trot = RT R0, where R can
| be represented as: | ||
| α∗pi | − α∗pi | |
cos 180 sin 180 0
|
sin 180 0 |
cos 180 0 |
0 1 |
R = α∗pi α∗pi (5)
In the presence of noise, the diffusion pattern rotates randomly in any direction; thus, the correction matrices may have rotational components along the Z axis as well. Conveniently, R in Equation 5 is dynamically created through registration in the Fractional Anistropy (FA) domain; hence, projections in Z-axis, in the case they are present, are also accounted.
The Fig. 2 illustrates the synthetic data that we generated to test our method.
Diffusion Anisotropy Indexes (DAIs)
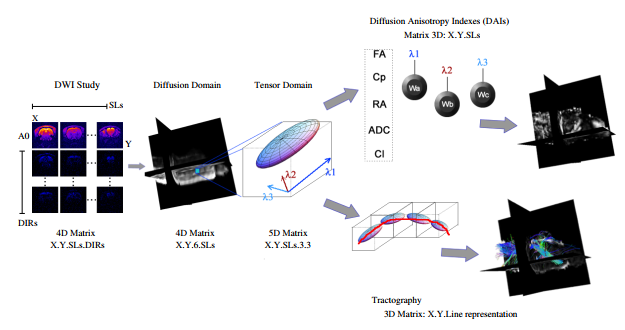 Figure 1: Standard DTI pipeline. In the dimensions of the data, SLs stands for slices and DIRs for gradient directions. Note how the data produces complex matrix formats along the whole path and only in the DAIs the outputs are scalars. From here the convinience to using a registration on the FA index fro correction purposes.
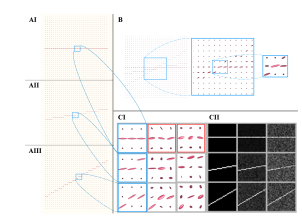 Figure 2: Proof of concept synthetic data
The panel A of Fig. 2 shows ideal-synthetic-tensor fields: AI is the reference, AII and AIII are tensor fields simulating acquisition rotated 10 and 30 degrees with respect to the reference (AI). Panel B shows the tensor field that is generated when the three acquisitions (AI,AII, and AIII) are averaged in the DWIdomain. Panel C shows the same information in the tensor and FA domains. Some tensors of Panel A are zoomed-in and shown in the first column of CI. In Panel C, the columns simulate acquisitions with different levels of noise. In CI, the parameters of the tensors are as follows: rows 1, 2, and 3 represent tensors with 0, 10, and 30 degree rotations, respectively; columns 1, 2, and 3 represent tensors with 0, 0.1, and 0.2 sigma noise, respectively, with the exception of the tensors in the red boxes, in which the noise levels are
0.05 and 0.15 (left and right, respectively). Each panel of CI is the tensor field from which the FA is generated in the corresponding panel in CII.
In this proof of concept, a field of 32×32 pixels with a horizontal diffusion pattern is used as a reference. Its tensor field is extracted as shown in Panel AI. A set of rotations is induced in the tensor fields (see Panels AII and AIII) and Rician noise with different levels is added (as displayed in Panel CI). For our theoretical experiment, we generated six different datasets using a combination of angular rotations respect to the x-axis as well as various noise levels. The details of these datasets are shown in Table 1. The variance in the Rician noise of the noisy reference signals (Panel C, row 1, columns 2,3) is decreased by 0.5 to simulate the model acquisitions. The tensor fields are also used to generate FA maps for registration purposes, which generates the transformation matrices used to correct the misalignments in the tensor field. Hence, in summary, with this procedure, synthetic signals in the DWI domain, tensor fields, and FA maps are generated. The outcomes of these set of experiments will serve to demonstrate how the proposed method not only de-noises the images, but also correct structural misalignments at the tensor stage, enhancing general quality with each acquisition and, therefore, improving the results in every subsequent step.
2.2 Tensor averaging on small animal data
Small animals are often used to recreate pathogenic models. The idea of monitoring these models in time
Table 1: Angles of rotation and noise levels of 5 different datasets of synthesized signals. Sets 0 and 3 represent the ideal sets with no noise. Abbreviations: AoR (angles of rotation), σ (variance of Rician noise).
| Set | Reference | 1st additional acquistion | 2nd additional Acquisition |
| Set 0 | AoR = 0° , σ = 0.00 | AoR = 10° , σ = 0.00 | AoR = 30° , σ = 0.00 |
| Set 1 | AoR = 0° , σ = 0.05 | AoR = 10° , σ = 0.10 | AoR = 30° , σ = 0.10 |
| Set 2 | AoR = 0° , σ = 0.15 | AoR = 10° , σ = 0.20 | AoR = 30° , σ = 0.20 |
| Set 3 | AoR = 0° , σ = 0.00 | AoR = 0° , σ = 0.00 | AoR = 0° , σ = 0.00 |
| Set 4 | AoR = 0° , σ = 0.05 | AoR = 0° , σ = 0.10 | AoR = 0° , σ = 0.10 |
| Set 5 | AoR = 0° , σ = 0.15 | AoR = 0° , σ = 0.20 | AoR = 0° , σ = 0.20 |
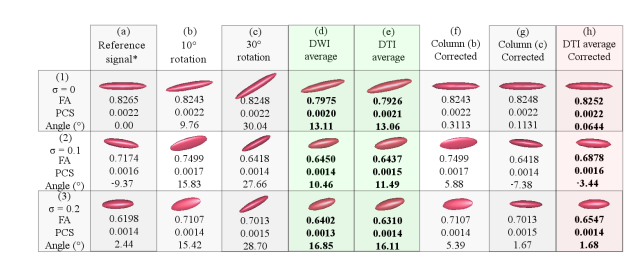 Figure 3: Results of the theoretical experiment using the new pipeline on synthetic data with rotation induction.
using non-intrusive means such as the MRI vanish in spite of the quality of images. Here we present a case of quality enhancement on the diffusion data of an animal model.
A mouse imaged with a 9.4 Tesla Bruker BioSpin MRI GmbH using the diffusion EPI sequence. The acquisition produced a matrix size of 106x160x88 where each voxel has isometric side lengths of 0.08 mm, yielding a field of view of 8.5x12.8x7.0mm3. The diffusion parameters were set in 6 gradient directions with sensitizer b-value of 3000s/mm2 and one reference image without sensitizer (B0).
The mouse was scanned twice using the same protocol and once more using the DWI averaging strategy that comes built-in with scanners set in two. The added acquisition time of the two initial experiments equals the one utilized in the two DWI averaging acquisition creating a fair comparison scheme.
2.3 Templates on human neonates data
Templates are vastly used in human frameworks as references for structural assessments. Either T1 or T2 images are aligned and averaged to produce smooth models [25, 26, 27]. Recall that T1 and T2 images are 3D stacks while diffusion images are 4D stacks, from here the difficulty to apply the same aligning and averaging techniques in this kind of data. For this proof of concept, five brain DTI scans of term neonates with regular -not pathological- MRI scans images were acquired with a 1.5T GE scanner. The images are captured in a matrix of 256x256x22 where each voxel represents a space of 0.70x0.70x4.99mm3; therefore, the field of view is of 180x180x110mm3. The diffusion parameters were set in 25 gradient directions with sensitizer b-value of 700s/mm2 and one reference image without sensitizer (B0). The images were acquired without DWI averaging.
2.4 Tracts extraction in Neonates
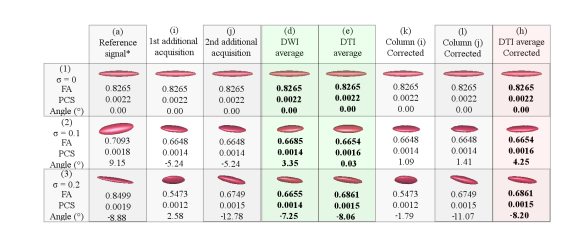 Figure 4: Results of the theoretical experiment using the proposed pipeline on synthetic data with no rotation Figure 4: Results of the theoretical experiment using the proposed pipeline on synthetic data with no rotation |
As a proof of implementation, in this section, we use the previously created template to map a limbic, some association and commissural fiber tracts in a neonate of 42 weeks conceptional age. Recall that these structures are undergoing the process of myelination at this induction.
age according to [28, 29, 30, 31]. In this conditions, structural visualization under diffusion MRI methods is not only hardened by factors such as size and neuronal hyper-connectivity, but also by the lack of natural barriers that restrict the water displacement which is provided by the myelin sheets in adult brains. The structures shown in Fig. 7 correspond to one of the subjects utilized to create the template.
3 Results
3.1 Synthetic data
With the synthetic material generated in Section 2, the analysis focuses on the behaviour of the center pixel, in which all the created signals converge (see Panel B in Figure2). The eigenvalues and eigenvectors that describe the diffusion geometry are dependent on the accuracy of the overlays of concomitant diffusion patterns. The results of these experiments are shown in Figures 3 and 4. Recall that the transformations induced in the central voxel are also applied to the other voxels in the field of view; therefore, the outcomes of this exercise should be extrapolated to the whole image space.
All the references to columns in this paragraph belong to the Fig. 3. Column (a) contains the tensor of the reference DWI signal. Columns (b) and (c) hold tensors of the DWI signals that have been rotated 10°and 30°respectively, respect to the x-axis. Column (d) represents the tensor of the DWI signal that has been averaged using (a),(b) and (c) in the DWI domain without any prior rotation correction. Column (e) shows the same information as in (d), but all done in the tensor field. Column (f) and (g) contain the corrected tensors of Columns (b) and (c), respectively. Column (h) displays the result of averaging the tensors in Columns (a), (f) and (g).
All the references to columns in this paragraph belong to the Fig. 4. Column (a) contains the tensor of the reference DWI signal. Column (i) and (j) hold tensors of the two additional DWI signals that have been randomly generated. Column (d) represents the tensor of the DWI signal that has been averaged using (a),(i) and (j) in the DWI domain without any prior rotation correction. Column (e) is the same as (d) but all done in the tensor field. Column (k) and (l) hold the corrected tensors of Columns (i) and (j), respectively. Column (h) displays the tensor that has been averaged from the tensors in Columns (a),(k) and (l).
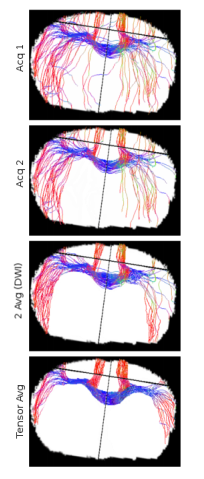 Figure 5: Diffusion image enhancement in small animal data.
Tractography of the corpus callosum (CC) using a single region of interest that fully covers the structure in coronal view.
For both Figures 3 and 4: Row (1) displays the dataset with ideal conditions (no noise), row (2) the one with σ = 0.1, and row (3) that with σ = 0.2. The provided Angle (°) is the nearest angle (in degrees) of the principle eigenvector with respect to the x-axis. Abbreviations: FA (fractional anisotropy); PCS (principal component); σ (variance of Rician noise). Also note that in sets marked with * the σ is 0.5 lower in the reference signals of the noisy datasets (row (2) and (3)). The columns with bold entries correspond to definitive results and should be use to focus the comparisons.
In the experiments with synthetic data, the proposed method always aligned the additional acquisitions to the model dataset, thus improving the overlap between structures and consequently cleaning the images while retaining the essential information. This statement remains true even in the data affected by noise. Note also how all the factors that affect the tractography are favorably adjusted.
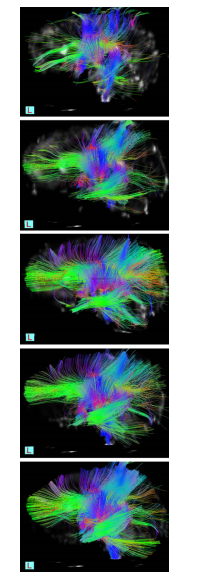 Figure 6: Dynamic diffusion template for neonates The tractography of the commissural and associating tracts. Using a single subject -on top- and adding one subject each time to end in a template of 5 subject at the bottom
3.2 Small animal data
The dMRI studies depicted in Fig. 5 corresponds to only one animal scanned several times, replicating what it would happen in horizontal research.
The averaging is performed using the Acq 1 and Acq2. Note how the corpus callosum (CC) fiber are shown in blue, this is due to the position of the animal in the scanner. Recall that in humans, the coordinates are rotated 180° in the YZ plane; thus, fibers in the CC that connect the two brain hemisphere are usually shown in red.
3.3 Neonatal data
The infant data has been processed with the tensor averaging method after a rigorous re-sampling process to enable the standard space and the registration as well. The Fig. 6 shows the progressive improvement with each newly added subject.
3.4 Tractography in neonatal datasets
With a clean template such as the one shown in Fig. 6, it is possible to map the tracts of a subject with highly compromised quality, as it is often the case in clinics and hospitals where the medical necessity and the comfort of the patient is prioritized over image clarity. Through non-linear registration in the factional anisotropy domain and by applying the obtained deformation fields to the tracts in the template, the tracts in the subject appear respecting the anatomy, see Fig. 7.
4 Dicussion
The Diffusion methods in the brain are meaningful if the extracted structures follow the neuronal trending that has been estimated through histology in postmorten samples. The tractography is an unbeatable mechanism to elucidate the structures created by neuron connectivity and thus, a visualizing method of utmost relevance for our purposes and those of any study based in dMRI. Once, the tractography is found consistent with the previous knowledge of the structure, one can start analyzing the DAIs under the tracts or out of them to enlight contrast. The results section is presented with evidence of tractography and improvement in this domain due to the relevance of this visualization mechanism in dMRI.
The proof of concept of Section 2.1 consists of two stages. The first one is intended to demonstrate that set-up associated rotations can be dynamically corrected. In a second run, the same pipeline is used in a testing-set where no rotations are added; thus working solely with the random and unavoidable geometry modifiers introduced by noise. In both groups of experiments, ideal situations and two levels of noise are evaluated. With our method, the tractography, FA, principal components and angles are all kept within acceptable ranges of the ground truth. Tensor patterns are also closest to the original in (a), as it is evidenced if comparing columns (e),(f) and (h). Refer to Figures 3 and 4. Note also how the rotations do not greatly affect the diffusion geometry; the major contribution of our new pipeline consists in correcting the angle of the main principal components, therefore enabling the tractography in these datasets [32]. Also, note in Figure 2 – Panel B, how the averaging of tensor fields that are rotated about each other results in shrunk tensors. In contrast, our method obtains acceptable orientations and tensor sizes in spite of noise in the signal. When these specifications are moved to real data, the tractography is better defined with each new intake.
Regading the small animal data, rats and mice are preferably used for tracking pathologies associated with motor deficiencies. One big field of study is the ictus, which researchers induce in these animals. Cell swelling and apoptosis happen in the first 24 hours and diffusion normalizing processes happen along the week after the inducement. Also, consider that an adult rodent is used for these sort of experiments; thus, growing factors are not crucial. Neuron state and neuron connectivity changes, those are the ones that we need to capture. If the structures are aligned, as we proposed within our method, we do not only clean the images while averaging. Recall that as noise, any non-correlated data will be diminished. Analogously, all correlated data will be sustained. In this way neurodegenerative processes will become non-correlated information through acquisitions and thus will be manifested as disappearing structures while averaging. In a similar manner, proliferation processes will be non-correlated data along scannings, but this time, it will be displayed as appearing structures while averaging.
The above is a hypothesis and despite its veracity can be inferred from the simulations in Section 2-A, has not been demonstrated in the current work, overall because we do not have real data to support such as statements. What we have shown is that our method is more time-efficient that the machine averaging often used to produce better image quality. The message that we would like to transmit is stated as follows:
Using our tensor FA-based rotation strategy in n separated acquisitions that spend m minutes would yield better image quality than doing one acquisition lasting the same m minutes. This is very convenient also regarding scanning setup, recall that the animals should not be anesthetized more than 2 hours for ethical reasons. Our strategy presents a way out to this limitation which is a major drawback when working with alive subjects at such as exigent spatial resolution. This claim remains true also for the neonates field where the patient is priority and the scanning times are fastened to avoid displacement artifacts.
The procedure that we are performing does not modify the diffusion pattern (the lamdas are the same), it just re-accommodate the orientation and displacement in case present. As the diffusion anisotropy indexes (such as FA, Aparent Diffusion Coeficiente, Mean Diffusivity and so on) are rotationally independent, and we keep the lamdas unmodified, our procedure does not modify these values. Additionally, we would like to emphasize the importance of the tractography because all our efforts are focused on generating a good one. Once the structure of interest is well located and even when the rotations do not affect the DAIs – because of the facts given above –, you can always run the DAIs analysis on the voxels overlapped by the extracted tractography in the original data.
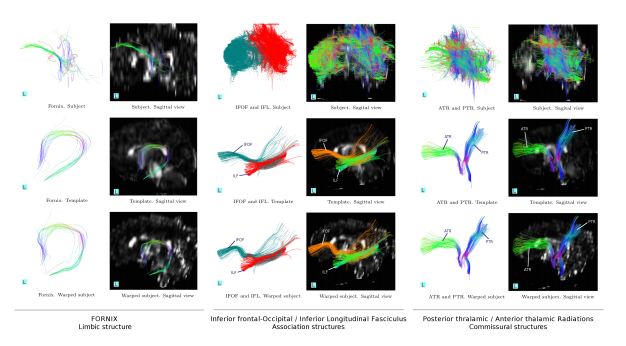 Figure 7: Tractography in clinical datasets. Limbic, association and commissural structures (left,center and right respectively) by standard methods (top row), in the template (center row) and in the studied clinical subject (bottom row). Each structure is presented in stand alone fashion and overlapped with its respective FA map of the brain. Top and bottom rows show, graphically, the significance of the proposed method. Figure 7: Tractography in clinical datasets. Limbic, association and commissural structures (left,center and right respectively) by standard methods (top row), in the template (center row) and in the studied clinical subject (bottom row). Each structure is presented in stand alone fashion and overlapped with its respective FA map of the brain. Top and bottom rows show, graphically, the significance of the proposed method. |
The method exposed in this manuscript has been successfully tested in a controlled environment before being tested on the animal and also on clinical data. The biological variability that authors try to diminish by increasing the sample size is not an issue here because the noise and the misalignments are not produced by any metabolic or physiological reason. We are dealing with setup-related factors that are difficult to overcome due to the high resolution used in the case of the animals and also to procedimental disparities in the clinics. On the noise side, recall that making smaller voxels reduces the rate of spin recruitment while Brownian motion keeps the noise in constant levels. On the displacement side, note that we are trying to sharply locate the animal in our macro world when the scanning system is capturing the changes between 200 and 400 micrometers. As for the neonates, the diversity in the acqusition protocols and spatial resolutions is the reason for the lack of structural coherence among subjects.
In both sets of real data, the enhancement consists in better definition of structures and elimination of doubtful fibers. The better definition of paths is achieved when the diffusion information is highly correlated among acquisitions or subjects, not only reinforcing the correlated information but also weakening non-correlated one like noise. Another important aspect demonstrated in the procedure with synthetic data is the angle recovering of the tensor averaging method. The angle in which principal components of diffusion –the longest axis– coexists in neighboring voxels can create or eliminate fibers depending if this angle is smaller or bigger than 10°. The last statement applies if the fiber tracking is performed with the TensorLine algorithm [33] which is the case of the current implementation.
5 Conclusions
Diffusion MRI is a powerful tool that has not yet been implemented in full extend at the clinics due to the long lasting sessions required to achieve a good image quality. Regarding the small animal field, dMRI opens a myriad of possibilities but the spatial resolution is too exigent, and the quality of the images ends by discouraging the realization. If carefully observed, in both fields of application the quality is a concern and in MRI, quality is a matter of time. Here, we have introduced a post-scanning method that makes the inter-acquisition time to become a valued asset for image enhancing purposes. The method has been thoroughly tested in synthetic toys and successfully translated to real case scenarios. With all compelling evidence exposed in this document, we confirm that time in dMRI can be more efficiently utilized in the tensor space than in the DWI domain.
- P. J. Basser, J. Mattiello, and D. LeBihan, “Mr diffusion tensor spectroscopy and imaging,” Biophys. J., vol. 66, no. 1, pp. 259–267, 1994.
- D. L. Bihan, J.-F. Mangin, C. Poupon, C. A. Clark, S. Pap-pata, N. Molko, and H. Chabriat, “Diffusion tensor imaging: Concepts and applications,” JOURNAL OF MAGNETIC RES-ONANCE IMAGING, no. 13, pp. 534–546, 2001.
- P. W. Schaefer, P. E. Grant, and R. G. Gonzalez, “Diffusion-weighted mr imaging of the brain.,” RSNA Radiology, vol. 217, Nov 1999.
- M. Puligheddu, I. Laccu, G. Gioi, P. Congiu, M. Figorilli, and M. Peltz, “Diffusion tensor imaging tractography and mri perfusion in post traumatic brain injury hypersomnia,” Sleep Medicine, 2017.
- J. Z. Dan Wu, “In vivo mapping of macroscopic neuronal pro-jections in the mouse hippocampus using high-resolution diffusion mri,” NeuroImage, vol. 125, pp. 84–93, 2016.
- A. Heemskerk, T. Sinha, K. Wilson, Z. Ding, and B. Damon, “Quantitative assessment of dti-based muscle fiber tracking and optimal tracking parameters.,” Magn Reson Med., vol. 2, pp. 467–72, Feb 2009.
- M. Froeling, J. Oudeman, G. Strijkers, M. Maas, M. Drost, K. Nicolay, and A. Nederveen, “Muscle changes detected with diffusion-tensor imaging after long-distance running.,” Radiology, vol. 2, pp. 548–62, Feb 2015.
- S. Jiao, V. Gurevich, and J. A. Wolf, “Long-term correction of rat model of parkinson’s disease by gene therapy,” Letters to Nature, vol. 362, no. 1, pp. 450 – 453, 1993.
- J. M. Hall, K. A. E. Martens, C. C. Walton, C. O’Callaghan, P. E. Keller, S. J. Lewis, and A. A. Moustafa, “Diffusion alterations associated with parkinson’s disease symptomatology: A review of the literature,” Parkinson and related disorders, 2016.
- M. Ghareghani, A. Ghanbari, S. Dokoohaki, N. Farhadi, S. M. Hosseini, R. Mohammadi, and H. Sadeghi, “Methylpred-nisolone improves lactate metabolism through reduction of elevated serum lactate in rat model of multiple sclerosis,” Biomedicine & Pharmacotherapy, vol. 84, pp. 1504–9, 2016.
- S. W. N. W. G. K. H. R.-S. T. H. T. K. N. B. Andreas Weishaupt, Daniela Paulsen, “The t cell-selective il-2 mutant aic284 mediates protection in a rat model of multiple sclerosis,” Journal of Neuroimmunology, vol. 282, pp. 63–72, 2015.
- L. de Oliveira, D. Fraga, R. D. Luca, L. Canever, F. V. Ghedim, M. Matos, E. Streck, J. Quevedo, and A. Zugno, “Behavioral changes and mitochondrial dysfunction in a rat model of schizophrenia induced by ketamine,” Metabolic Brain Disease, vol. 26, no. 1, pp. 69 – 77, 2010.
- C. Meehan, L. Harms, J. D. Frost, R. Barreto, J. Todd, U. Schall, C. S. Weickert, K. Zavitsanou, P. T. Michie, and D. M. Hodgson, “Effects of immune activation during early or late gestation on schizophrenia-related behaviour in adult rat offspring,” Brain, Behavior, and Immunity, vol. 63, pp. 8–20, 2017.
- A. Kunimatsu, S. Aoki, Y. Masutani, O. Abe, H. Mori, and K. Ohtomo, “Three-dimensional white matter tractography by diffusion tensor imaging in ischaemic stroke involving the corticospinal tract,” Neuroradiology, vol. 45, no. 8, pp. 532 – 535, 2003.
- Y. Yao, S. Zhang, X. Tang, S. Zhang, J. Shi, W. Zhu, and W. Zhu, “Intravoxel incoherent motion diffusion-weighted imaging in stroke patients: initial clinical experience,” Clinical Radiology, vol. 71, p. 938.e11e938.e16, 2016.
- S. Sharma, J. Bekelman, A. Lin, J. N. Lukens, B. R. Roman, N. Mitra, and S. Swisher-McClure, “Clinical impact of prolonged diagnosis to treatment interval (dti) among patients with oropharyngeal squamous cell carcinoma,” Oral Oncology, vol. 56, pp. 17–24, 2016.
- I. Jeffrey, R. Matthew, L. Blaskey, J. Christopher, and P. Timothy, “High angular resolution diffusion imaging (hardi) probabilistic tractography of the auditory radiation,” AJNR Am J Neuroradiol., vol. 34, pp. 1573–78, Aug 2013.
- J. P. D. J. E. K. C. T. R. J. F. M. J. L. Xiaopeng Zhou, Ken E. Sakaie, “Quantitative quality assurance in a multicenter hardi clinical trial at 3t,” Magnetic Resonance Imaging, vol. 35, pp. 81–90, 2017.
- A. Barmpoutis and B. Vemuri, “A unified framework for estimating diffusion tensors of any order with symmetric positive-definite constraints,” Proceedings of ISBI.
- F.-C. Yeh, D. Timothy, Y. Wang, J. Fernndez-Miranda, and W.-Y. Tseng, “Deterministic diffusion fiber tracking improved by quantitative anisotropy,” PLOS-one, vol. 34, Nov 2013.
- P. Fillard, X. Pennec, V. Arsigny, and N. Ayache, “Clinical dt-mri estimation, smoothing and fiber tracking with log-euclidean metrics,” IEEE Transactions on Medical Imaging, vol. 26, no. 11, pp. 1472 – 1482, 2007.
- X. Pennec, P. Fillard, and N. Ayache, “A riemannian frame-work for tensor computing,” J. Comput. Vision, vol. 66, pp. 41– 66, Jan 2006.
- C. Lenglet, M. Rousson, and R. Deriche, “Statistics on the manifold of multivariate normal distributions: Theory and application to diffusion tensor mri processing,” J. Math. Im-age. Vis., vol. 25, pp. 423–444, Oct 2006.
- P. Batchelor, M. Moakher, D. Atkinson, F. Calamante, and A. Connelly, “A rigorous framework for diffusion tensor calculus,” Magn. Reson. Med., vol. 53, p. 221225, 2005.
- J. Talairach and P. Tournoux, “Co-planar stereotaxic atlas of the human brain: 3-dimensional proportional system – an approach to cerebral imaging,” Thieme Medical Publishers, 1988.
- J. C. Mazziotta, A. W. Toga, A. Evans, P. Fox, and J. Lancaster, “A probablistic atlas of the human brain: Theory and rationale for its development,” NeuroImage, pp. 89–101, 1995.
- L. Xie, J. B. Pluta, S. R. Das, L. E. Wisse, H. Wang, L. Mancuso, D. Kliot, B. B. Avants, S.-L. Ding, J. V. Manjn, D. A. Wolk, and P. A. Yushkevich, “Multi-template analysis of human perirhi-nal cortex in brain mri explicitly accounting for anatomical variability,” NeuroImage, vol. 144, pp. 183–202, 2017.
- R. W. Oppenheim, “The neurotrophic theory and naturally occurring motoneuron death,” ViewPoint, vol. 12, no. 7, 1989.
- B. Popko, “Myelin maintenance: Axonal support required,” Nature Neuroscience, vol. 13, pp. 275 – 277, 2010.
- S. C. L. Deoni, E. Mercure, A. Blasi, D. Gasston, A. Thomson, M. Johnson, S. C. R. Williams, and D. G. M. Murphy, “Mapping Infant Brain Myelination with Magnetic Resonance Imaging,” J. Neurosci., vol. 31, no. 2, pp. 784 – 791, 2011.
- P. Yakovlev and I. Lecours, The myelogenetic cycles of regional maturation of the brain. Blackwell, 2011.
- D. M. Weinstein, G. L. Kindlmann, and E. C. Lundberg, “Tensorlines: Advection-diffusion based propagation through diffusion tensor fields,” in Proceedings of the 10th IEEE Visualization 1999 Conference (VIS ’99), VISUALIZATION ’99, (Washington, DC, USA), pp. –, IEEE Computer Society, 1999.
- D. weinstein, G. Kindlmann, and E. Lundber, “Tensorlines: advection-diffusion based propagation through diffusion tensor fields,” Proceedings in Conference of Visualization, 1999.