Deterministic Approach to Detect Heart Sound Irregularities
Deterministic Approach to Detect Heart Sound Irregularities
Volume 2, Issue 3, Page No 974-980, 2017
Author’s Name: Richard Mengkoa), Amy Hamidah, Ricky Saputra
View Affiliations
Electronics Lab, School of Electrical Engineering and Informatics, Institut Teknologi Bandung, 40132, Indonesia
a)Author to whom correspondence should be addressed. E-mail: richard@mengko.com
Adv. Sci. Technol. Eng. Syst. J. 2(3), 974-980 (2017); ![]() DOI: 10.25046/aj0203123
DOI: 10.25046/aj0203123
Keywords: Heart sounds, Detection, S-transform

Export Citations
A new method to detect heart sound that does not require machine learning is proposed. The heart sound is a time series event which is generated by the heart mechanical system. From the analysis of heart sound S-transform and the understanding of how heart works, it can be deducted that each heart sound component has unique properties in terms of timing, frequency, and amplitude. Based on these facts, a deterministic method can be designed to identify each heart sound components. The recorded heart sound then can be printed with each component correctly labeled. This greatly help the physician to diagnose the heart problem. The result shows that most known heart sounds were successfully detected. There are some murmur cases where the detection failed. This can be improved by adding more heuristics including setting some initial parameters such as noise threshold accurately, taking into account the recording equipment and also the environmental condition. It is expected that this method can be integrated into an electronic stethoscope biomedical system.
Received: 05 April 2017, Accepted: 06 June 2017, Published Online: 10 July 2017
1. Introduction
Auscultation is an act of medical diagnosis by listen-ing to sounds from the heart, lungs or other organs with a stethoscope. Stethoscope has been a popular tool to early diagnose a patient since its development on 1800’s [1], due to its simplicity and wide availabil-ity. The outcome from a diagnose using this stetho-scope could vary according to physician’s hearing sen-sitivity and experiences [2]. The introduction of dig-ital stethoscopes reduce the hearing sensitivity prob-lem because the heart sound can be amplified to suit the examiner’s need and furthermore noise can also be reduced. However, the digital stethoscopes still have not solved the skill and experience required to be able to diagnose heart problems accurately.
Our research group is working to develop an easy to use digital stethoscope that has some capabilities to detect various type of heart sound.To do this, we need to design a device that can detect components of heart sound such as primary heart sound; S1, S2, S3, S4, as well as murmurs and clicks. The intention is to de-velop a tool that can provide some suggestion to help medical practitioners in performing a quick diagnose of patient’s problem. This tools should be small and simple enough so that it will be easily accepted be-cause it is not very different than the ordinary stethoscope.
The first challenge towards this goal is to design a simple and yet effective heart sound detection tech-nique. Most of heart sound classification techniques are based on machine learning methods such as clus-tering and artificial neural networks [3, 4], SVM and MCSearch [5]. They need a large amount of data to learn from and also they require a lot of computation. To overcome those problems, this study investigated a simple detection method without machine learning or statistical approach using only the time series features of heart sound.
The next section takes a deeper look at heart sound signals to discover the deterministic features of each component. These features will be used in the core of the proposed detection method described in section
- Section IV presents the result and discussion of our experiment. The conclusion of this paper is writ-ten in section V.
2 Heart Sound as Time Series
Heart sound is acoustic signal produced by the me-chanical activities of the heart as a result of the vi-bration of the valves, heart muscle tissues, and great
Figure 1: (a) Illustration of heart sound signal with S1, S2, S3 and S4 component, (b) S-transform diagram.
vessels . The closure of mitral tricuspid valves pro-duce S1, and the second heart sound (S2) caused by the sudden closure of aortic and pulmonary valves. S1 has lower frequency with longer duration and higher intensity, while S2 has higher frequency with shorter duration. Under pathological conditions and abnor-malities, additional components of the third heart sound (S3) and/or the fourth heart sound (S4) may be present. S3 occurs in the rapid filling period of early diastole after S2 due to the vibration of blood inside the ventricles, which may indicate the systolic dysfunction. S4 appears before S1 and it is caused by altered physical properties of ventricle or increase in the rate and volume of blood flow in the late diastolic interval, which may indicate the presence of acute my-ocardial infarction or ischemia diseases [6] . S3 and S4 are usually low amplitude and low frequency that make them difficult to be detected. These four heart sound components lie in the frequency range of 20-200 Hz [7].
A normal cardiac cycle comprises of four main segments which are S1, systolic period, S2 and dias-tolic period, as shown in 1. Single cardiac cycle can also be defined by the interval between the beginning of S1 and the beginning of the next S1. Systolic pe-riod is the interval between the end of S1 and the be-ginning of S2, while diastolic period is defined as the interval between the end of S2 and the beginning of S1 in the next cycle. The systolic period is usually shorter than the diastolic period. Figure 1 illustrates two cycles of quadruple gallop heart sound consist-ing of S1, S2, S3, and S4 components (each sound has been labeled by red text). By analyzing the pattern of heart sound features, the heart malfunction symp-toms leading to CVD can be identified. The first and most important step towards automatic heart sound diagnosis and analysis is segmentation and detection.
According to the process how a heart sound is gen-erated, it can be considered as a time-series events which generate a series of amplitudes values that fol-low a certain pattern. Hence methods commonly used in time series analysis such as Fourier Transform (FFT, DFT, STFT), wavelet, and S-transform can also be used to analyze heart sound. To further understand the heart sound behavior, S-transform analysis is applied on denoised heart sound signal to examine its time and frequency characteristics.
S-transform is introduced by Stockwell et.al and defined as:
| S(t; f ) = Z | a | pjf j | t | 2f 2 | ||||
| s(t) | e | e i2 f d | (1) | |||||
| 2 | ||||||||
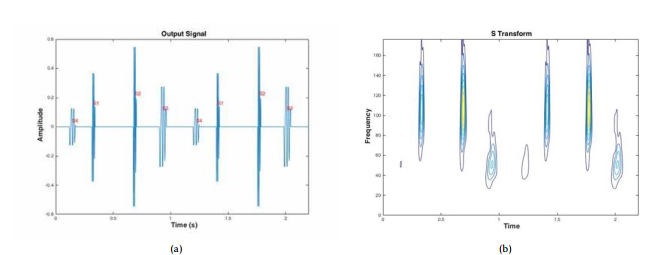 Figure 1(a) depicts a heart sound signal in time do-main, while Figure 1(b) shows its S-transform representation.
From these two figures it can be deducted that each component of heart sound occupies separate area in time domain. Since there is no overlapping re-gion we can use time as the main feature to determin-istically distinguish each component (S1, S2, S3, and S4).
-
Detection Method
The steps of the proposed method are depicted in Fig-ure 2. Description of each step is as follows:
3.1 Preprocessing
These are processes that should be done before heart sound detection can be performed:
3.1.1 Down Sampling
Normally a phonocardiogram or a heart sound record duration is at least 15 seconds. The recording can be performed using digital stethoscope. With sample rate at 44.1 kHz the amount of data generated is too large for our purpose, so this signal should be down-sampled to 2000 Hz. The reason to choose this down-sampling frequency is to make sure that all the heart sound which occurred in this frequency is properly represented [8].
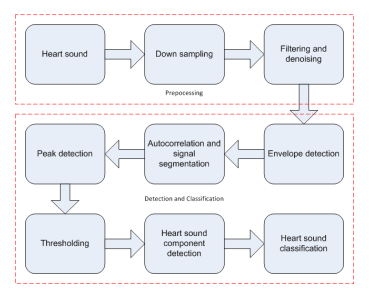 Figure 2: Heart sounds detection’s steps.
3.1.2 Filtering and Denoising
To reduce high-frequency noise, the down-sampled signal x(n) is filtered using low passed filter with 400 Hz cut-off frequency. To extract the remaining artifacts, signal x(n) was pass through denoising pro-cess using Empirical Mode Decomposition (EMD) [9] method which produced signal xd (n). This method is chosen because it gave better results compared to other denoising technique [10].
3.2 Detection and classification
3.2.1 Envelope Extraction and Smoothing
Shannon Energy theorem was used in the envelope ex-traction process of denoised signal [11, 12]. Based on these envelopes heart sound components will be de-termined.
| x | env | (n) = x2 | (n)logx2 | (n) | (2) |
| d | d |
Our experiment shows that the produced enve-lope was not smooth. It has some ripples that might falsely be detected as peaks during peak detection process. To overcome this problem, the Finite Impulse Response (FIR) filter was used to remove the ripples. The cut-off frequency of this filter is 25 HZ.
3.2.2 Autocorrelation and Signal Segmentation
To compute cardiac cycle and cardiac number, au-tocorrelation method was applied to the envelopes. Cardiac cycle period was determined by calculating the average distance between highest peaks and its neighboring peaks. To calculate the number of car-diac cycle, sum of the number of highest peaks and one was divided by two. Based on our experiment, to calculate more accurate a cardiac cycle time, it was needed at least three cycles. Therefore it needs at least three seconds recording time. In order to shorten the calculation process, the calculation process, envelope signal that has been smoothed was divided into four cardiac cycle segment.
3.2.3 Peak Detection and Threshold Calculation
A peak is defined as the highest point (local maxima) between two local valley points. The formula for local maxima is:
| d(xenv (n)) | d(xenv (n + 1)) | ||||
| > 0 and | < 0 | (3) | |||
| dn | dn | ||||
while valley point (minima) defines as
| d(xenv (n)) | d(xenv (n + 1)) | ||||
| < 0 and | > 0 | (4) | |||
| dn | dn | ||||
Some extra peaks might be detected by the pro-gram due to left over noise and artifacts. For example, a normal heart sound must have two peaks per car-diac cycle. Due to the noise, the program might detect some small peaks as shown by red dot in Figure 3a. To overcome this problem the Heron’s formula was ap-plied to calculate the threshold of the peak. With this formula the area of triangle formed by a local max-imum and its two neighbor local minima was calcu-lated. The area that is less than average of all triangles will be ignored. The results of implemented this for-mula is shown in Figure 3b. This procedure will not ignore the peak caused by a split.
It shows that after applying this formula, the pro-gram detects three peaks instead of two. After cal-culating peak’s threshold, the adjustment of peak is needed. In this adjustment the difference between the peak’s two minima amplitudes were checked. If the difference is greater than 0.01 mv the adjustment will ignore (not remove) the peak and its second minima. Then the new peak is produced from a combination of first peak’s minima, second peak, and second peak’s minima. The results of the adjustment is shown in
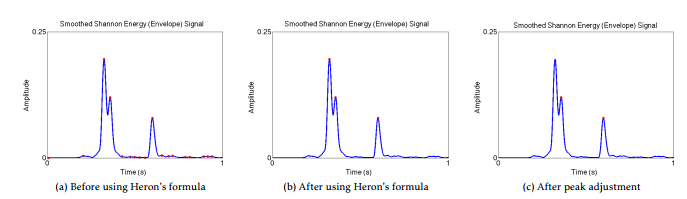 Figure 3: Graphical outcome for peak detection method.
Figure 3c.
3.2.4 Heart Sound Component Detection
to distinguish primary heart sound, extra heart sound, murmur, and other abnormalities, five features were extracted from the signal; peak frequency, peak inter-val, peak duration, total power, and amplitude. On the peak adjustment process, peak frequency is used to calculate each peak frequency that was detected.
The distance between two heart sound compo-nents (peaks) is determined by peak interval. The peak interval is measured from the first peak’s sec-ond minima to the second peak’s first minima, while the peak duration is measured from the first minima to the second minima of the peak. To calculate the power on systolic and diastolic region we use to the total power formula. Finally, the amplitude is used to differentiate heart sound abnormalities in systolic and diastolic region.
The following are the detection steps starting with wide split detection, followed by heart sound com-ponent detection, split detection, and murmur, click, and ejection click detection. Figure 4 shows the whole detection process, while the descriptions of each step is as follows:
Firstly, Wide Split Detection. Wide split is occured if S1 or S2 has more than one peaks. Wide split detec-tion is used to distinguish whether the second peak of the closest is extra heart sound (S3 or S4) or the split sound. In this process, peak frequency feature is used. If the frequency peaks are similar, thus the peaks must be considered as a wide split sound and the number of peaks in the cycle will be reduced by one. If the frequency of peaks are quite different, it means the second peak is either S3 or S4.
Secondly, Heart Sounds Component Detection. The number of peak per cycle and the heart sounds’ characteristics (TABLE 1 [13, 14, 15]) are used in this detection process as the bases to detect the heart sounds components. There are four possible number of peaks per cycle as explained below.
| No | Sounds | Duration (ms) | Frequency (Hz) | |
| 1 | S1 | 100 | – 160 | 10 – 140 |
| 2 | S2 | 80 – 140 | 10 – 400 | |
| 3 | S3 | 40 | – 80 | 15–60 |
| 4 | S4 | 30 | – 60 | 15–45 |
Table 1: Heart sounds characteristics
- Case 1: Only one peak in a cardiac cycle is de-tected. It means that the peak is S1, and S2 is covered by murmur, either its continuous mur-mur or to-and-fro murmur.
- Case 2: There are two peaks in a cycle. It means that those peaks are S1 and S2. To determine which peak corresponds to S1 or S2, peak inter-val features is used. If the distance of second minima of first peak to first minima of second peak is less than the distance of second minima of second peak to first minima of first peak, it means that the first peak is S1 and the second peak is S2, vice versa.
- Case 3: There are three peaks in a cycle. It means there is an extra sound component which either S3 or S4. Before determining S3 or S4, S1 and S2 need to be decided. To distinguish ex-tra sound from primary sound, the distinctive feature of heart sound, peak duration, is used. S3 or S4 has shorter duration than S1 or S2. Therefore, S1 and S2 can be decided by using the same method that explain before. If the dis-tance between the third peak and S1 is shorter than the distance between this peak and S2, thus this peak is S4, otherwise this peak is S3.
- Case 4: There are four peaks in a cycle. It means that S1, S2, S4, and S4 are present in the cy-cle. The same procedure using peak duration and peak interval will be applied to determine each peak to corresponding heart sound.
Thirdly, Split Detection. Split only occurs on ei-ther S1 or S2. Split can be heard when the separation exceeds 20 ms [16]. It means that if there is more than one peak in either S1 or S2 and they are more than 20 ms apart, then it is considered a split Example of S1
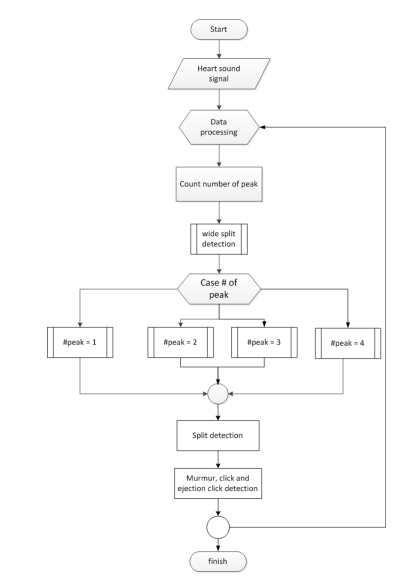 Figure 4: Flowchart of detection process.
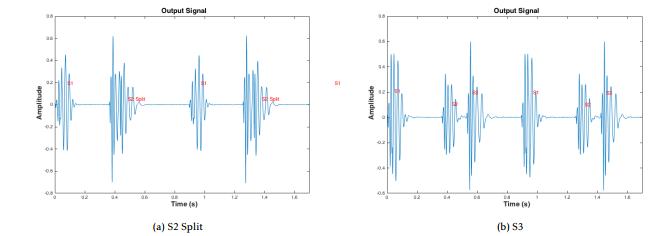 Figure 5: Graphical outcome for peak detection method.
split can be seen in Figure 3, which shows envelope signal of split S1.
Finally, Murmur, Click, and Ejection Click Detection. The avarge power feature is used to indicate whether there is murmur or click in either systolic or diastolic area. If the average power in systolic or diastloic area greater than the average power in that area for a normal heart sound it indicates there is ab-normal sound such as murmur, click or ejection click in the area [17]. In this case, the envelope signals in systolic or diastolic area are examined further to de-termine which abnormal sound these signals belong to. If there are several peaks that are higher than the threshold then these can be an indication of murmur. Based on our experience, the threshold for murmur should be set to half of the average amplitude of the known signal. The type of murmur is classified based on the location where the murmur occurs and its am-plitude. If the peak is greater than four times of mur-mur’s threshold then it is a Click. These threshold are obtained purely heuristically form our observations. If there is a click that followed by murmur then it is an Ejection Click.
It is expected that the above process will be able to produce information related to following heart prob-lems [18], such as:
- The presence of systolic murmur can indicate AV valve regurgitation, while diastolic is mur-mur related with the problem on semilunar valves
- To-and-fro murmur indicates the problem with all valves
- Wide split of S1 and/or S2 is a symptom of right brand bundle block (RBBB)
- Fixed split on S2 indicate an atrial septal defect
- Paradoxical splitting on S2 means LBBB prob-lem
- Ejection click is a symptom of aortic or pul-monary stenosis
- Mid systolic click indicates mitral or tricuspid prolapse
- Opening snap shows the presence of artificial valve or rheumatic mitral stenosis
- The presence of S3 or S4 indicates ventricle stiff-ness, the summation gallop indicates the heart failure
However the decision regarding the real heart prob-lems of a patient is entirely left to the physician.
-
Results and Discussion
The heart sounds samples were taken form the ones that available in the internet [19, 20, 21], which sig-nals were noiseless. To make them imitate the real sound, an artificial noise was added to the signal. In our experiment, the input signals were designed to have a 13.98 dB signal-to-noise ratio. This noise addi-tion is intended to demonstrate the effect of filtering and denoising process.
The simulation is run on OS X El Capitan with processor 2.5 GHz intel core i5 and 8 GB RAM using MATLAB 2014a software.
There are more than 20 heart sounds recording that are used to test the detection program. The list of distinctive sounds that are successfully detected and classified are shown in Table 2. The goal of the program is to identify and produced a label on the printed heart sound signal to mark which type of sounds occur. Figure 5 shows two of the simulation results, which are Figure 5a S2 Split and Figure 5b S3
There are cases where the program does not give correct results. This is happen if and only if murmur or the abnormal sounds amplitude and frequency are similar with the heart sounds’. If this happen, the whole heart sounds will be covered by the abnormal sounds or murmur. The example of this case is con-tinuous murmur, where S2 is covered by murmur.
Tabel 2 shows the different signals that can be identified
| Name | Source | ||
| Single S1 S2 | E-general Medical, Michi- | ||
| gan, Thinklabs | |||
| Split S1 | Littmann, Michigan | ||
| Mid-systolic Click | Michigan | ||
| Early Systolic Murmur | Michigan | ||
| Mid-Systolic Murmur | Michigan | ||
| Late Systolic Mumur | Michigan | ||
| Holo Systolic Murmur | Michigan | ||
| S4 | Gallop | Littmann, Michigan, Thin- | |
| klabs | |||
| S3 | Gallop | Littmann, Michigan | |
| Quadruple Gallop | E-General medical | ||
| Ejection Click | E-general medical , Michi- | ||
| gan | |||
| S4 | and | Mid-Systolic | Michigan |
| Murmur | |||
| S3 | and | Holosystolic | Michigan |
| Murmur | |||
| Normal Split S2 | Littmann, Thinklabs | ||
| S2 | Wide Split | E-general medical | |
Table 2: Heart sounds recording
5 Conclusion
This study proposes a deterministic approach to de-tect heart sound and its regularity. The preprocess-ing apply EMD denoising and low pass filter to cancel noise and remove unwanted artifact. To extract sig-nal’s envelope Shannon Energy method is used, and follow by using FIR filter to smoothen the jagged en-velope. Our main source to classify heart sound is the signal’s envelope. To detect the number of peak per cardiac cycle, Heron’s formula and peak adjustment were then applied. These peaks and their extracted features were the keys to detect and classify the heart sounds.
The experiment shows that quite a few of distinc-tive heart sounds can be successfully detected by this proposed method. Still, some more heuristics can be added to improve accuracy. This method will be fur-ther improved so that it can be embedded as part of a digital stethoscope.
Conflict of Interest We have read and understood the policy on declaration of interests and declare that we have no competing interests.
Acknowledgment We would like to thank Electron-ics Department of Instiut Teknologi Bandung for the funding of our research, Mr Setiadi for helping us proof read the journal, and all others who directly or indirectly helped us to finish the project
- “History of the stethoscope.” [Online]. Available: http://www.adctoday.com/learning-center/ about-stethoscopes/history-stethoscope
- H. Liang, S. Lukkarinen, and I. Hartimo, “Heart sound segmentation algorithm based on heart sound envelogram,” Computers in Cardiology 1997.
- I. N. Amit G., Gavriely N., “Cluster analysis and classification of heart sounds,” Biomedical Signal Processing and Control 4 (2009) 2636.
- T. Dokur Z., lmez, “Heart sound classification using wavelet transform and incremental self-organizing map,” Digital Signal Processing 18: 951959.
- P. A. Redlarski G., Gradolewski D., “A system for heart sounds classification,” PloS one, vol. 9, no. 11, p. e112673, 2014.
- J. F. Tseng Y, Ko P, “Detection of the third and fourth heart sounds using hilbert-huang transform,” Biomedical engineering online, vol. 11, no. 1, pp. 113, 2012.
- S. Choi and Z. Jiang, “Comparison of envelope extraction algorithms for cardiac sound signal segmentation,” Expert Systems with Applications, vol. 34, no. 2, pp. 10561069, 2008.
- Z. CHOI, SJIANG, “Comparison of envelope extraction algorithms for cardiac sound signal segmentation,” Expert Systems with Applications, vol. 34, no. 2, pp. 1056–1069, 2008.
- N. E. Huang, Z. Shen, S. R. Long, M. C. Wu, H. H. Shih, Q. Zheng, N.-C. Yen, C. C. Tung, and H. H. Liu, “The empirical mode decomposition and the hilbert spectrum for nonlinear and non-stationary time series analysis,” Proceedings of the Royal Society A: Mathematical, Physical and Engi-neering Sciences, vol. 454, no. 1971, pp. 903–995, 1998.
- A. H. Salman, N. Ahmadi, R. Mengko, A. Z. R. Langi, and T. L. R. Mengko, “Performance comparison of denoising methods for heart sound signal,” 2015 International Symposium on Intelligent Signal Processing and Communication Systems (ISPACS), 2015.
- M. Saini, International Journal of Electronics and Communication Technology, pp. 15–19, 2016.
- A. H. Salman, N. Ahmadi, R. Mengko, A. Z. R. Langi, and T. L. R. Mengko, “Automatic segmentation and detection of heart sound components s1, s2, s3 and s4,” 2015 4th International Conference on Instrumentation, Communications, In-formation Technology, and Biomedical Engineering (ICICI-BME), 2015.
- L. James, “Heart sounds,” 2011. [On-line]. Available: http://www.slideshare.net/ LawrenceJames/heart-sounds
- A. Hamidah, “Integrated biosignal processing for early detection of heart abnormality: Auscultation and visualization,” 2015.
- G. Amit, “Heart sound analysis: Theory, technique and applications,” 2004.
- N. Ranganathan, V. Sivaciyan, and F. B. Saksena, The art and science of cardiac physical examination. Humana Press, 2006.
- M. Singh and A. Cheema, “Heart sounds classification using feature extraction of phonocardiography signal,” International Journal of Computer Applications, vol. 77, no. 4, pp. 13–17, 2013.
- L. S. Jung H., “The cardiac cycle: Mechanisms of heart sounds and murmurs,” The physiology of Heart Disease, A Collaboration Project of Medical Students and Faculty, 5th ed.
- R. Judge and R. Mangrulkar, “Heart sound and murmur library,” 2015. [Online]. Avail-able: http://open.umich.edu/education/med/ resources/heart-sound-murmur-library/2015/ materials.html
- “Basic heart sounds course.” [Online]. Available: http://www.littmann.ca/wps/portal/ 3M/en CA/3M-Littmann-CA/stethoscope/ littmann-learning-institute/heart-lung-sounds/ heart-sounds/
- T. Bauch, “Thinklabs one – digital stethoscope.” [Online]. Available: http://www.thinklabs.com/ #!heart-sounds-old/c1dqs