Graphics on demand: the automatic data visualization on the WEB
Graphics on demand: the automatic data visualization on the WEB
Volume 2, Issue 3, Page No 951-957, 2017
Author’s Name: Ramzi Guetaria), Maha Mallek
View Affiliations
LIMTIC laboratory – Higher Institute of Computer Science, University of Tunis El Manar, Tunisia
a)Author to whom correspondence should be addressed. E-mail: ramzi.guetari@isi.utm.tn
Adv. Sci. Technol. Eng. Syst. J. 2(3), 951-957 (2017); ![]() DOI: 10.25046/aj0203120
DOI: 10.25046/aj0203120
Keywords: Structured / Unstructured data, Data visualization, Variable data extraction, Natural Language Processing

Export Citations
Data visualization is an effective tool for communicating the results of opinion surveys, epidemiological studies, statistics on consumer habits, etc. The graphical representation of data usually assists human information processing by reducing demands on attention, working memory, and long-term memory. It allows, among other things, a faster reading of the information (by acting on the forms, directions, colors…), the independence of the language (or culture), a better capture the attention of the audience, etc.
Data that could be graphically represented may be structured or unstructured. The unstructured data, whose volume grows exponentially, often hide important and even vital information for society and companies. It, therefore, takes a lot of work to extract valuable information from unstructured data. If it is easier to understand a message through structured data, such as a table, than through a long narrative text, it is even easier to convey a message through a graphic than a table. In our opinion, it is often very useful to synthesize the unstructured data in the form of graphical representations.
In this paper, we present an approach for processing unstructured data containing statistics in order to represent them graphically. This approach allows transforming the unstructured data into structured one which globally conveys the same countable information. The graphical representation of such a structured data is then obvious. This approach deals with both quantitative and qualitative data. It is based on Natural Language Processing Techniques and Text Mining. An application that implements this process is also presented in this paper.
Received: 04 May 2017, Accepted: 11 June 2017, Published Online: 30 June 2017
1. Introduction
The English idiom “A picture is worth a thousand words” expresses an idea implicitly admitted by the human mind and indicates that it is easier to understand a complex idea through an image; But also that an image of a subject conveys its meaning or essence more effectively than a long speech or a textual description does. Data and information visualization is one of the most primitive forms of communication known to man. It meets a very basic need: telling a story. This communication way originated in the drawings found in the prehistoric caves dating back to 30,000 B.C., even before the writing that dates only 3000 B.C.
In our modern world, the visualization of information has evolved and is used to communicate information of all kinds: economic, social, military, health, etc. Graphical representations are the best way to make decisions by facilitating to grasp difficult concepts or to identify new patterns. They help to better process information by reducing the requirements on attention, working memory and long-term memory. In a business environment, visualizations can have two broad goals, which sometimes overlap: Explanatory and Exploratory. Data explanation allows solving specific problems and the exploration of large data sets allows understanding it better. Generally speaking, graphical representations are used to gain better insight of the problem we are studying.
When unstructured data contain statistics, they may be accompanied by graphical illustrations in the form of static images (GIF, PNG, etc.). These charts and graphics are no longer up-to-date as the data content changes. The graphs should then be reproduced in accordance with the new data.Since the early 1990s, the emergence of the World Wide Web (WWW) [1] has facilitated the access to the information to individuals and companies. It has become the most important vehicle of a tremendous amount of data, allowing the people to share the information from the largest database repositories globally. Almost 80% of the data published on the WWW are unstructured and, despite the computer assistance for data processing, it remains very difficult to extract valuable knowledge from this large volume of data, when it’s about countable data, especially without graphical illustrations.
In our opinion, it would be more appropriate to produce graphical illustrations that correspond exactly to the data processed. This can be made possible by updating the graphical representations, each time the data evolves. However, some data change instantly and reproducing the graphics that are faithful to it makes the process of analyzing it and representing it graphically too complex. The analysis and the graphical representation should, therefore, be on-demand.
The objective of this work is to propose an approach for analyzing data, especially from the WWW in order to extract the relevant countable information, organize it in a way it can be graphically represented and annotate it using the means of the Semantic Web techniques [2]. This allows users to request a graphical representation of this information whenever they want. Indeed, the “on demand graphics” allows taking into account the effective state of the information when such representation is requested.
2. The Graphical Representation of Data
William Playfair (22 September 1759 – 11 February 1823) was the first to devise and publish different types of statistical chart (most notably the time-series line graph, the bar chart, the pie chart, and the circle chart). Modern statistical graphs are almost identical to those published by Playfair and count four basic types of graphs used as well as the graphical representation of stochastic variables: Line graphs/Polygraphs, Bar graphs, Pie graphs and Flow Charts.
Not all data could be graphically represented, and not all graphic representations are of paramount importance. Only data that may vary for effects-related causes can be graphically represented. The objective of these graphical representations is to analyze the causes and predict the effects in order to make the appropriate decisions.
It is usual in the computer science domain to classify data into two well-known categories: structured and unstructured data [3].
Structured data are usually associated with a model or a schema and resides in a fixed field within a record or file such as Relational databases and Spreadsheets. The schema defines the structure of data with data types (string, integers, date, etc.) as well as the way data are stored, accessed and processed. The structured data are easily maintainable and manageable since they are based on Schema-on-write method and managed with most known Structured Query Language (SQL).
Unstructured data do not reside in a field or record, do not have a standard model and do not follow a schema. There’s no specific definition of storing, accessing, and processing this kind of data. The unstructured data might follow an internal structure; however, there’s no schema, tags, or markers describing the fields of data. Although the unstructured data are difficult to process using traditional computer software modules, their processing is nonetheless very important because of its important volume compared to the structured data. They have remained unidentified or ignored for a long time knowing that important business prospects are hidden in these data as well as social and political trends.
3. Processing the Data
Processing data means processing both structured and unstructured data. In the first case, when data are structured, the variable data are explicitly specified and their different values are well known. The graphical representation of such a data is an easy and very well mastered process. In the second case, when it comes to unstructured data, the amount of text is simply too large to read and analyze efficiently even with assistance of computers. The work is, therefore, more tedious. On the one hand, we must analyze the text to determine the context. On the other hand, it is necessary to extract the statistical data, when it exists, to process it and to carry out calculations in order to transform unstructured data into structured one such as a table.
3.1. Processing Structured Data
The processing of structured data does not pose any significant difficulties. The data are represented in tables, generally easy to understand and interpret. Tables are easy to read, however a visual can communicate more information than a table in a much smaller space and is, therefore more effective than tables for presenting data. For example, notice the Table 1 below, related to the French presidential elections of 2017, and try to spot the candidate with the highest estimated voting rate.
| Date | Sample size | Mélenchon | Macron | Fillon | Le Pen |
| 28 Mar 2017 | 2,231 | 14% | 25.5% | 17.5% | 25% |
| 24 Mar 2017 | 2,225 | 13% | 26% | 18% | 25% |
| 20 Mar 2017 | 2,245 | 12.5% | 26% | 18% | 25% |
| 18 Mar 2017 | 935 | 11.5% | 25% | 18% | 26% |
Table 1. Polls finished since the publication of the official list of candidates
When the data contained in this table are represented graphically (Fig. 1), the information is obtained very quickly. The graphical representation of a structured data set represented in the form of a table presents no particular difficulties. All data processing tools, modern spreadsheets and statistical applications do it very well. The only small problem to be solved in this case is to determine which variable will be represented in the y-axis and which will occupy the x-axis. This problem is solved from the context of the document that is determined in the same way that the data are structured or not. We will discuss the context of the document and the extraction of variables when processing unstructured data.
The unstructured data that we take into account are texts expressed in natural language. To represent graphically the unstructured data it is necessary that this data contain countable information. These countable data have to be extracted from the text and processed to be transformed into structured data.
Transforming unstructured data into structured data containing the same information requires the specification of a model or a schema for the target structured data. The structure of the countable data in relation to this work is simple and can be specified as a simple association (variable, value). This association represents what we call the “Main Variable”; e.g. (candidate, voting_rate). The Main Variable is the one whose values are represented on the y-axis. The value associated with a variable may itself depend on other variable criteria. For example, the voting_rate may depend on the date, the region, the age of the voter, etc. A second association necessary is in this case: (value, criterion).
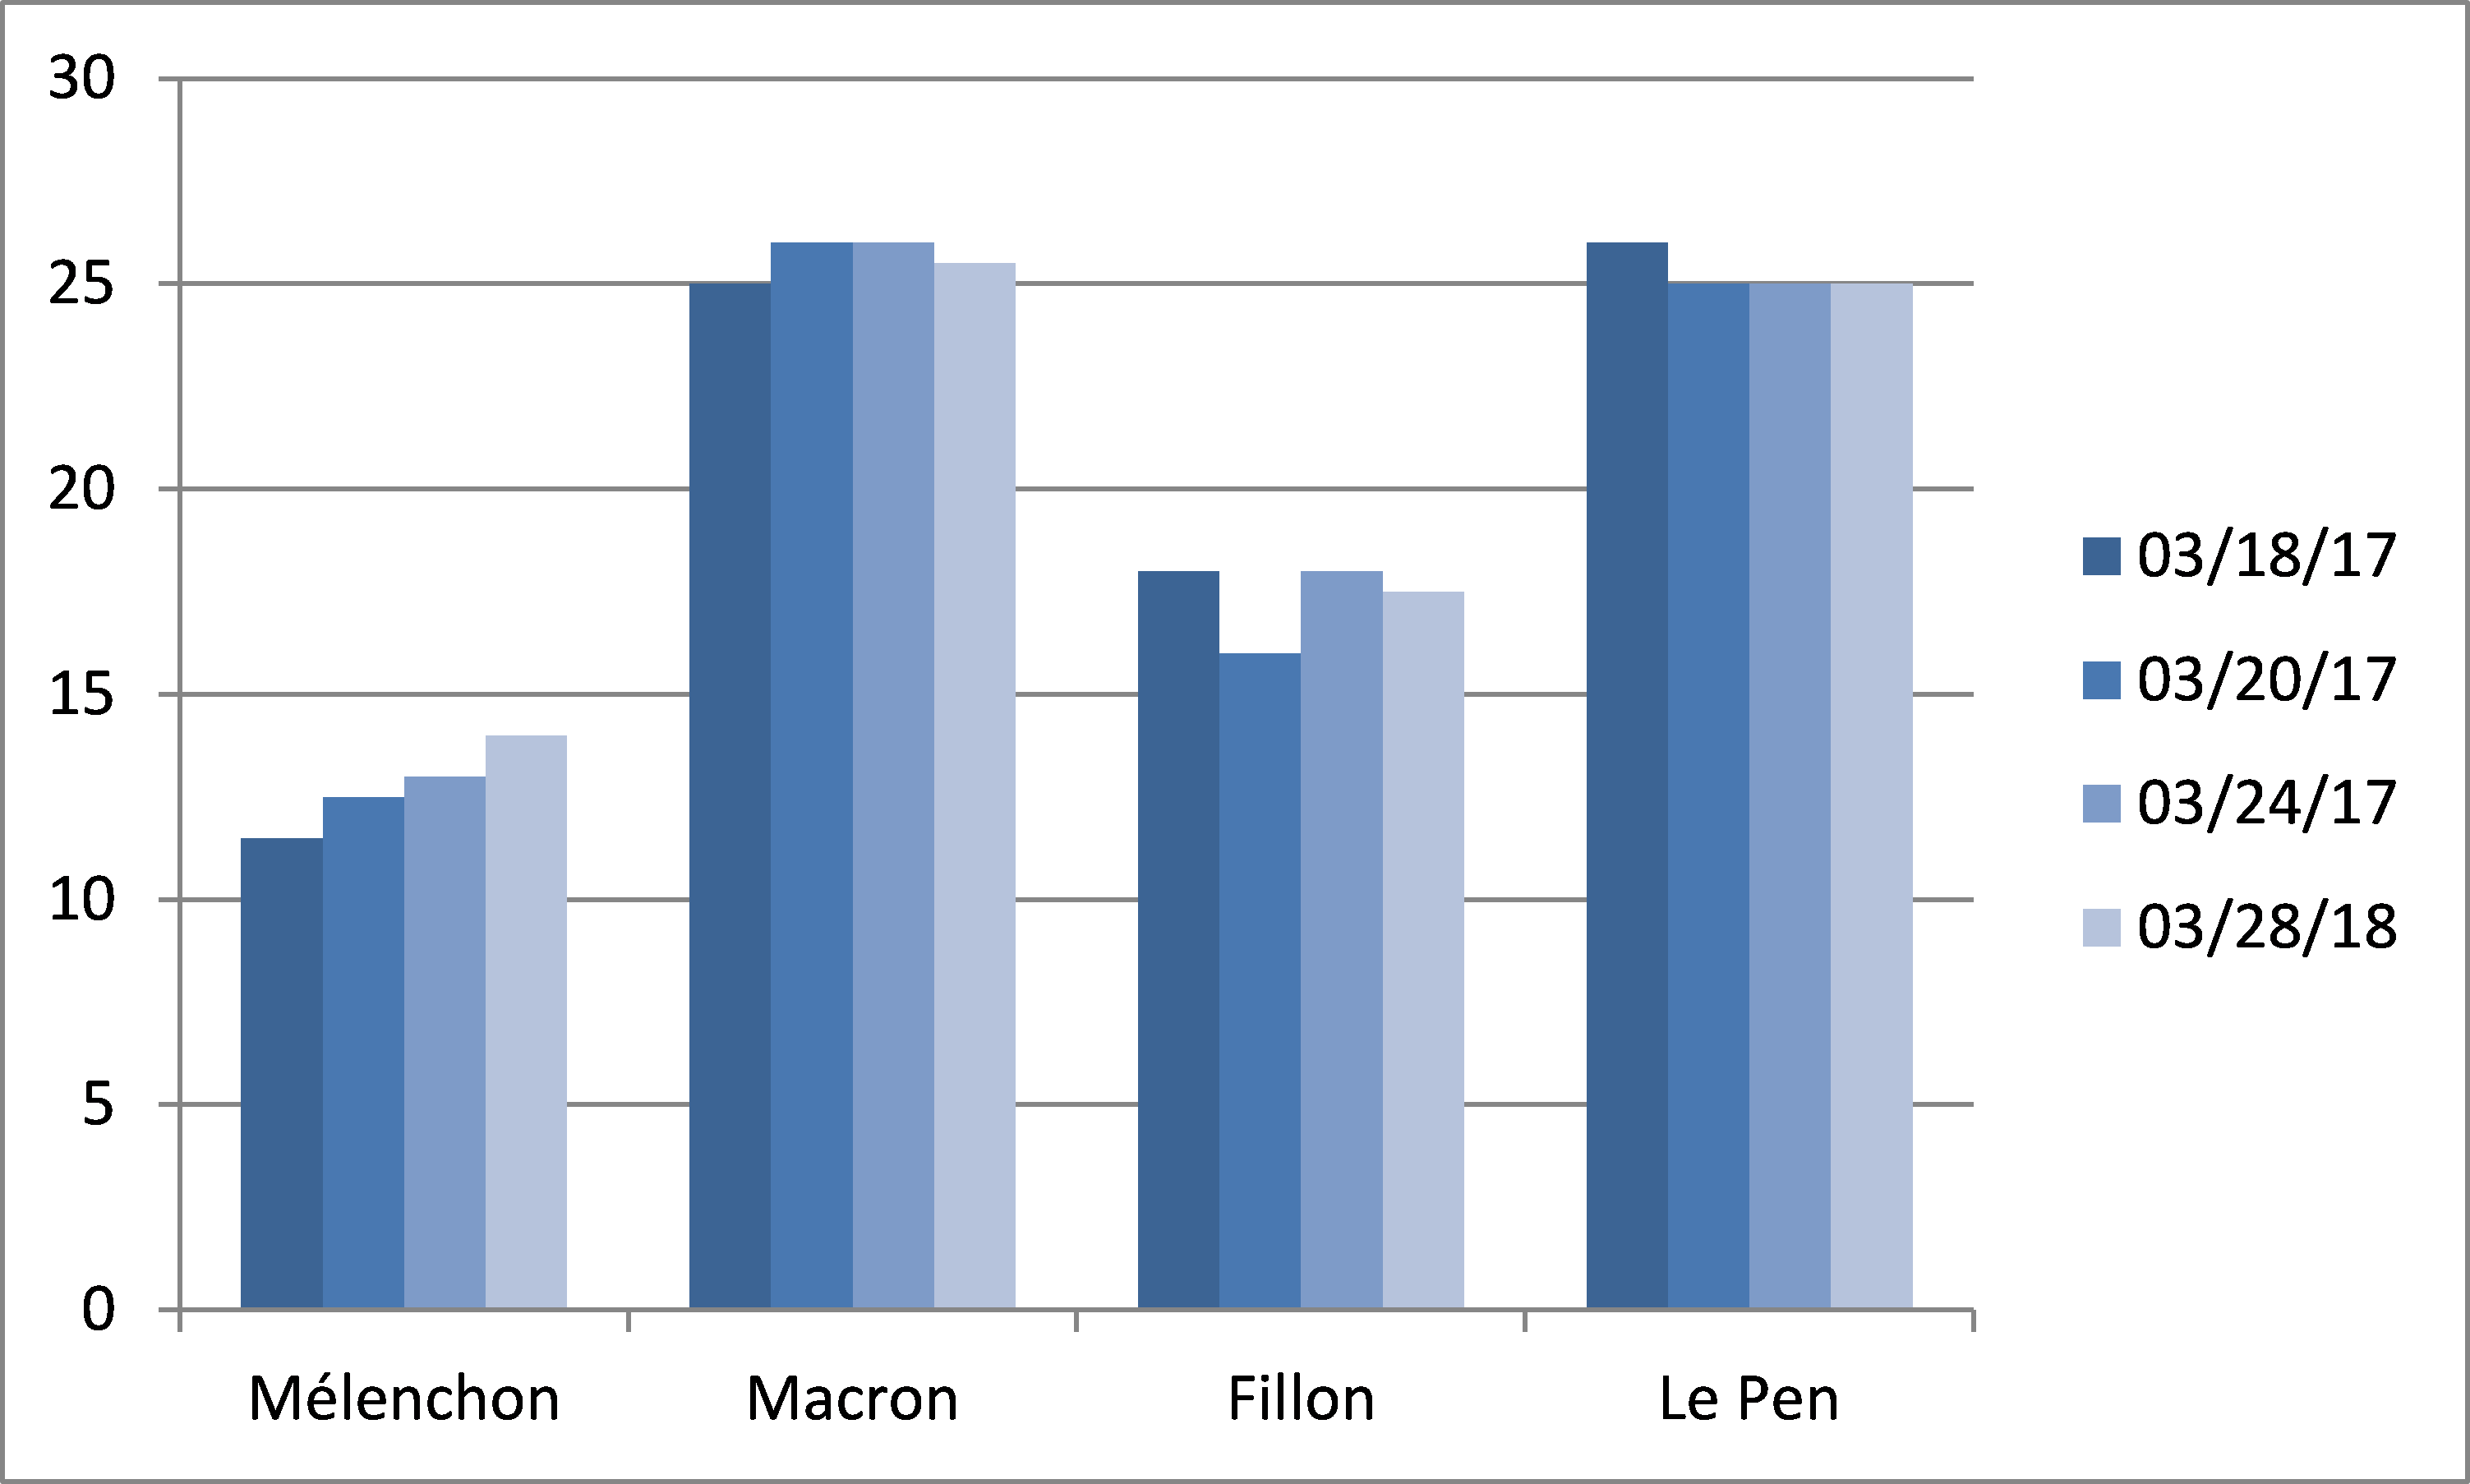 Fig.1: Data visualization obtained from the Table 1.
3.2. Processing Unstructured Data
The schema of the targeted structured data is modeled as an Ontology that we call “Ontology of the Context”. Indeed, the different associations specified in this ontology depend on the context. Fig. 2 shows the “Ontology of the Context” related to the French Presidential elections of 2017.
 Fig.2: Ontology of the context
At the present time, the different Ontologies of the Context are modeled manually. The ideal would be that these ontologies be created and updated automatically; this is one of the perspectives of our research works.
The processing of the data is based on two main steps: (i) the identification of variable data and the building of the corresponding structured entity; and (ii) the semantic annotation that avoids reprocessing a set of unstructured data that have already been processed.
4. Transforming unstructured into structured data
Unstructured data that can be subject to statistical calculations may appear in two ways: qualitative data which is when descriptive statements can be made about a subject based on observations, interviews or evaluations, e.g. a political forum (Fig. 3) or numerical values as in the example (§1) hereafter:
“The French Presidential Election of 2017: if you are a French citizen, at least 18 years old, you can participate in the French presidential elections of 2017 and express your opinion. As for most elections in France, presidential elections are conducted in two stages. The first round, which takes place on 23rd April 2017, is open to any candidate who meets the requirements. Assuming, as is virtually certain to happen, that no single candidate acquires no absolute majority of votes in the first round, there is then a second round, a fortnight later, which is a runoff between the two candidates with the highest votes in the first round . The next French President will be whoever gets a simple majority of the votes in the second round.”
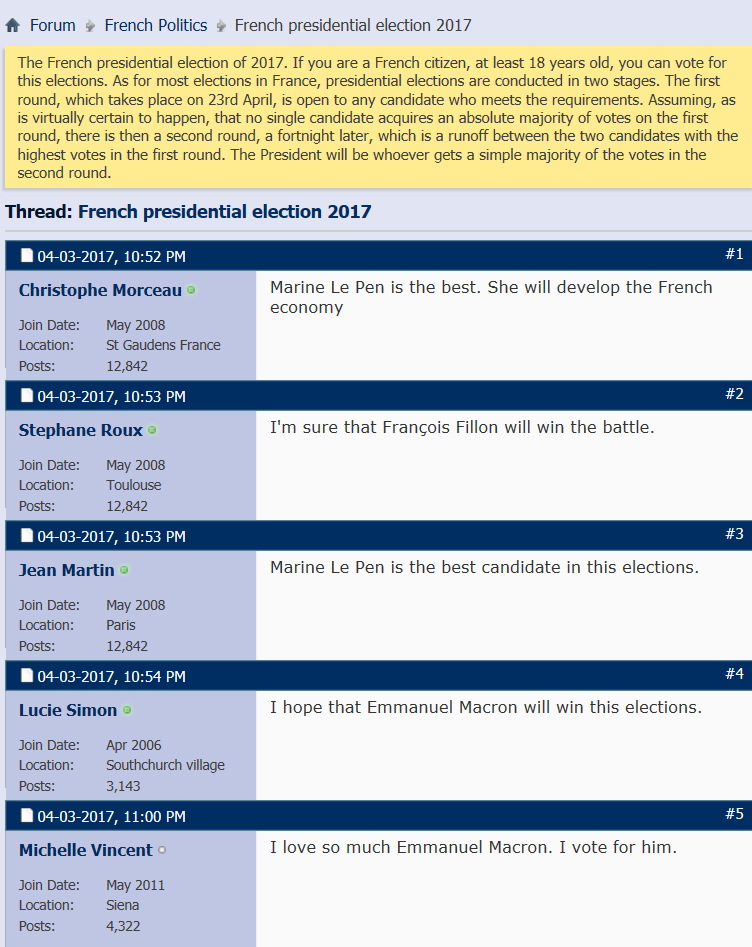 Fig.3: “French Politics” forum
The processing of unstructured data for the extraction of statistics is a tedious work. On the one hand, we must analyze the text to determine the context. On the other hand, it is necessary to extract the statistical data, when it exists, to process it and to carry out calculations in order to transform unstructured data into structured one such as a table. The overall context in which the data are used allows to build or to update the “Ontology of the Context” [4].
4.1. Identification of the context
The identification of the context requires five main steps as described in [5]:
- The tagging [6] which consists in dividing the text into a sequence of tokens, which roughly correspond to a words and associating to each one of them a label providing certain information (syntactic category, number, verb tense…). This step also allows identifying the different noun phrases and complex nominal groups found in a document. A noun phrase is a word or group of words in a sentence that acts like a noun. A complex nominal group is a simple noun phrase modified by one or two prepositional phrases (preposition followed by a nominal group).
- Named Entity Recognition [7] step which purpose is to label sequences of words in a text (tagged in the first step) which are the names of persons, organizations, locations, monetary values, etc. The annotation of the different named entities allows identifying variables.
- The coreference resolution [8] occurs when multiple noun phrases refer to the same entity or object in a document. It is an important step in our process, allowing the information extraction, such as the overall context of the document and the significant variable data.
- The Identification of the main topics [9] of a document helps us to identify the most important textual units of a document. These units are formed by key-words that we refer to in this document as “key-terms candidates and are the different noun phrases in a document. The identification of the main topics is basically made thanks to the Text Rank algorithm [10] and the Word Sense Disambiguation process [5].
- The identification of the context is the last step. Once the different main topics are identified, we need to determine only one of them that will be the one representing and defining the context of the document. To do this, first, a similarity rate [11] is computed between each couple of words from the main topics set. The word that has the highest similarity rate with all the other words, is defined as the most important topic of the document. Additional information may be necessary to refine the context. Thus, in a second step, the identification of the different complex nominal groups found in the document is required in order to have a more accurate context. An algorithm allowing the identification of the context has been implemented and experimented [9].
When applying the Context Identification Process on the following paragraph (§1), the text raking allows selecting the different main topics found in the data: “French presidential election”, “round”, “president”, “votes”, “candidates”, etc. The similarity between all pairs of main topics is calculated and given in Table 2.
| Round | Votes | Candidates | France | President | |
| French Presidential Elections | 0,0635 | 18,7456 | 0,0616 | 0,0592 | 0,0715 |
| Round | ´ | 0,0575 | 0,0625 | 0,0585 | 0,046 |
| Votes | ´ | ´ | 0,0618 | 0,0592 | 0,0715 |
| Candidates | ´ | ´ | ´ | 0,0629 | 0,0487 |
| France | ´ | ´ | ´ | ´ | 0,0471 |
Table 2. Measurement of similarity rates between all pairs of main topics
The topic that has the highest similarity rate with all the others is: “French presidential election”. However important information is missing: the date. The algorithm presented in [9] determines the different complex nominal groups and identifies the final context: “The French presidential election of 2017”.
The similarity rate between the topics “French presidential election” and “votes” is very high. This represents a very good indication of the variable data to be extracted from the text. Referring to the “Ontology of the Context”, we see that the vote is associated with a candidate. The pair (Variable, Value) of the “Main Variable” is thus identified. Other information is easily identified in this paragraph which is the relationship between the vote and the city which represents the pair (value, criterion).
4.2. Identification of the countable information
The identification and retrieval of countable data depend on the nature of the data sources. The processing of such a data differs according to the variable data being represented by numerical values or qualitative data.
Case 1: Data containing numeric values
The extraction of the variables consists first of all in identifying the key words characterizing each of the identified countable data. This work is still in progress and is mainly based on the Natural Language Processing (NLP) [12] and the Text Mining [13, 14]. At the present time, it uses a controlled vocabulary and is not completely automated. The purpose of this process is to determine the identifiers of each countable data. An identifier of a variable datum is a token obtained from unstructured text and standardized according to the well-known methods used in NLP and indexing, namely stemming and lemmatization [15]. This process occurs simultaneously with the identification of the context. It uses the different named entities extracted in the data processing stage in order to group the ones that belong to the same category (the names of persons, organizations, etc.) in a “class of category”. The identifier of the Main Variable is obtained from the keyword which has the highest similarity rate with the identified context, after resolving the coreferences.
The process of identification of significant variable data takes place in three main steps [9]: (i.) the grouping of the named entities in classes of categories, (ii.) the Classification of named entities of the same class of category, and (iii.) the variables’ identification. We take the following example (§2) to illustrate this three-step process:
(§2) “The French presidential election will be held on April 2017. The election will occur in different French cities to allow the winning candidate to access the presidency. Until now, the candidate with the estimated highest scores of votes is Marine Le Pen. She is credited with 35% of voting intentions in Paris. Polls give her 32% of voting intentions in Toulouse. However, she is ranked third in other cities such as Marseille with 18% of voting intentions and Lyon with 16.5% of voting intentions according to the most recent surveys. We asked the question “who would you vote for?” for the two childhood friends Fabien Martin and Marcel Laurent. Although they lived in the same neighborhood and in the same conditions of life, the two friends vote for two different candidates. Fabien says he will vote for François Fillon while Marcel is in favor of Marine Le Pen”
- i. Processing the named entities, this consists in grouping the named entities belonging to the same “Class of Category” such as the names of persons, organizations, etc. In the (2), a Class of Category “PERSON” gathers four names (Fig.4)
- ii. Processing the named entities of the same class of category. Named entities within a same category may belong to different concepts. A concept is a general idea about some distinct entities or classes of entities. Let’s consider a class of category that contains different names of candidates and voters (Fig. 4), the process must be able to differentiate between both concepts “candidate” and “voter”. The named entities that belong to the same class of category are classified according to their concept. The Class of Categories PERSON includes candidates for the presidential election (François Fillon and Marine Le Pen) and other names that can be considered as voters (Fabien Martin and Marcel Laurent) (Fig. 4). Two classes of concepts have been identified: “CANDIDATE” and “UNKNOWN” (Fig. 5)
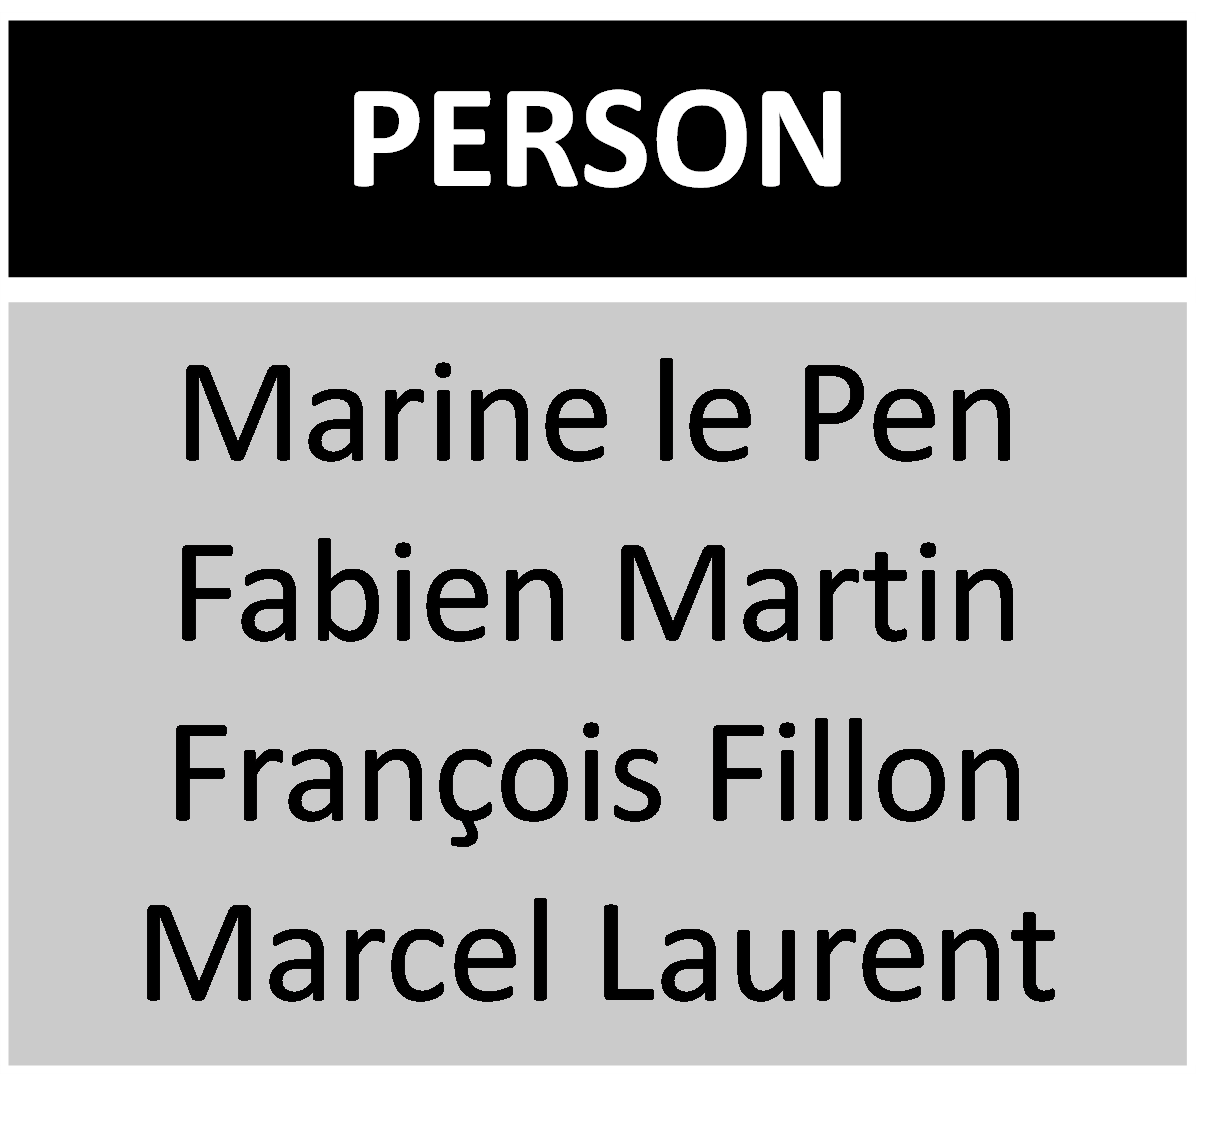 Fig.4: Building the Classes of Categories
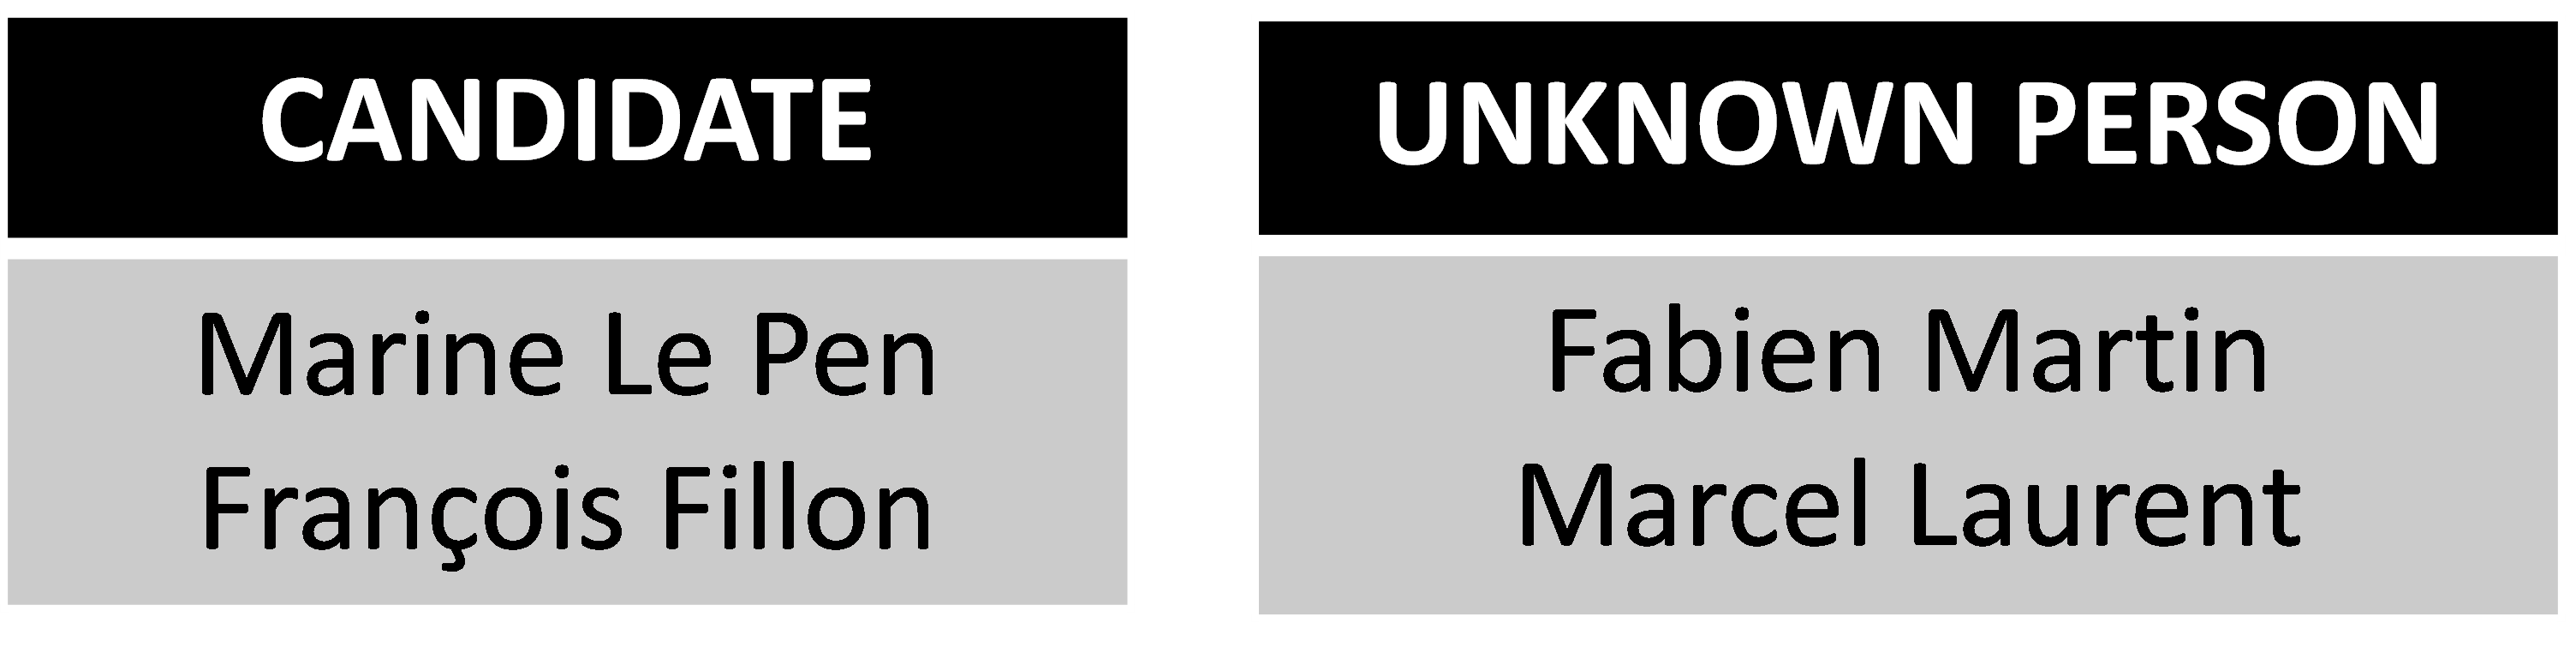 Fig.5: Building the classes of concepts
iii. Identification of countable data. The last step consists in identifying the variable data: the “Main Variable” that depends on the context and the others according to which the Main Variable varies. We have developed an algorithm [9] allowing to extract the different variables and to “format” them in a structure such as a table. The algorithm builds a matrix M with n rows (n is the number of sentences in the document) and three columns containing respectively nouns, verbs and complements, which are obtained from each sentence. The algorithm splits up the matrix M into several sub-matrices (Mk). The cutting of the matrix is based on the verbs. Each row of each sub-matrix contains the triplets (name, verb, complement) extracted from each sentence. The rows of each sub-matrix are formed of all triplets containing the same verb or one of its synonyms.
The processing of (§2) using the algorithm [9] results in the following sub-matrices:
M1 =
M2 =
M3 =
Among all the sub-matrices obtained from the splitting up of the matrix M, we keep only those with the noun and complement columns corresponding to the parameters of the main variable. In the considered example, only the sub-matrix M1 contains the name of a candidate in the noun column or complement column. While processing the nouns or the complements one can identifies voting rates (numerical values) as well as the names of some French cities. The pair (voting_rate, city) is therefore identified. Table 3 is the result of this process:
| Candidate | Votes | City |
| Marine Le Pen | 35% | Paris |
| Marine Le Pen | 32% | Toulouse |
| Marine Le Pen | 18% | Marseille |
| Marine Le Pen | 16,5% | Lyon |
Table 3. Identification of countable data
Case 2: Qualitative data
The political forum contains only expressions of voting intentions and no numerical data (Fig. 3). Each row of it is an expression of opinion in which the “speaker” supports the candidate he has chosen.
In an unstructured text where people express their opinions, it is important to determine the author of the text of an opinion as well as the content of that opinion. The Opinion generally expresses a positive or negative feeling towards a particular context or situation. The recognition of the “speaker” prevents counting the same opinion several times.
Several works have been carried out for the recognition of the “speaker” in a text. K. Glass and S. Bangay [16] propose “a naïve, salience-based method for speaker identification in fiction books”. They have shown that it is possible to identify different speakers from a text without using a complex machine learning or logic-based techniques. D. K. Elson et al. [17] proposed a method for extracting social networks from literary fiction. This method allows identifying all the characters in a story and determining which characters have relationships with each other. The method also allows determining whether the sentiment in each relationship is positive or negative. Other research works [18, 19] have addressed the same subject and demonstrated the feasibility of recognizing the speaker in the texts. Some of the “speaker recognition” methods have been implemented.
The sentiment analysis [20, 21], also known as opinion mining, seeks to recognize and characterize aspects of an author’s opinion or appreciation on a topic from information in natural language written texts. An opinion can be expressed by a person or an organization about a product, a service, a topic, an event, etc. We use the word “entity” to qualify the topic that is evaluated by an expression of feeling. For example, the entity in a political forum is a candidate.
The sentiment analysis focuses today on attributing of a polarity to subjective expressions (words and phrases that express opinions, emotions, feelings, etc.) in order to decide the orientation of an opinion [22] or the positive / negative / neutral value of it in a document [23][24][25]. Most of the techniques used for the classification of sentiment in texts in natural languages are based on supervised learning, e.g. naive Bayesian classification, support vector machines (SVM), or any other supervised learning method.
In our experiments, we have used the implementation of the speaker recognition as well as the sentiment analysis in the Stanford CoreNLP framework [26].
The object that is evaluated by a sentiment in a text depends on the context. At the present time, it is determined as the Main Variable by the Ontology of the Context. The value associated with the Main Variable is calculated by summing the positive opinions expressed. Negative or neutral opinions are not taken into account. For example, in political forum (Fig. 3), voting intentions are calculated by adding together the speakers who express an opinion favorable to a given candidate. When a speaker changes his mind, only his last expression is taken into account.
5. Application
The results of our research works have been implemented as an application allowing transforming unstructured data into structured data that could be represented graphically. The architecture of the application is presented in Fig. 6.
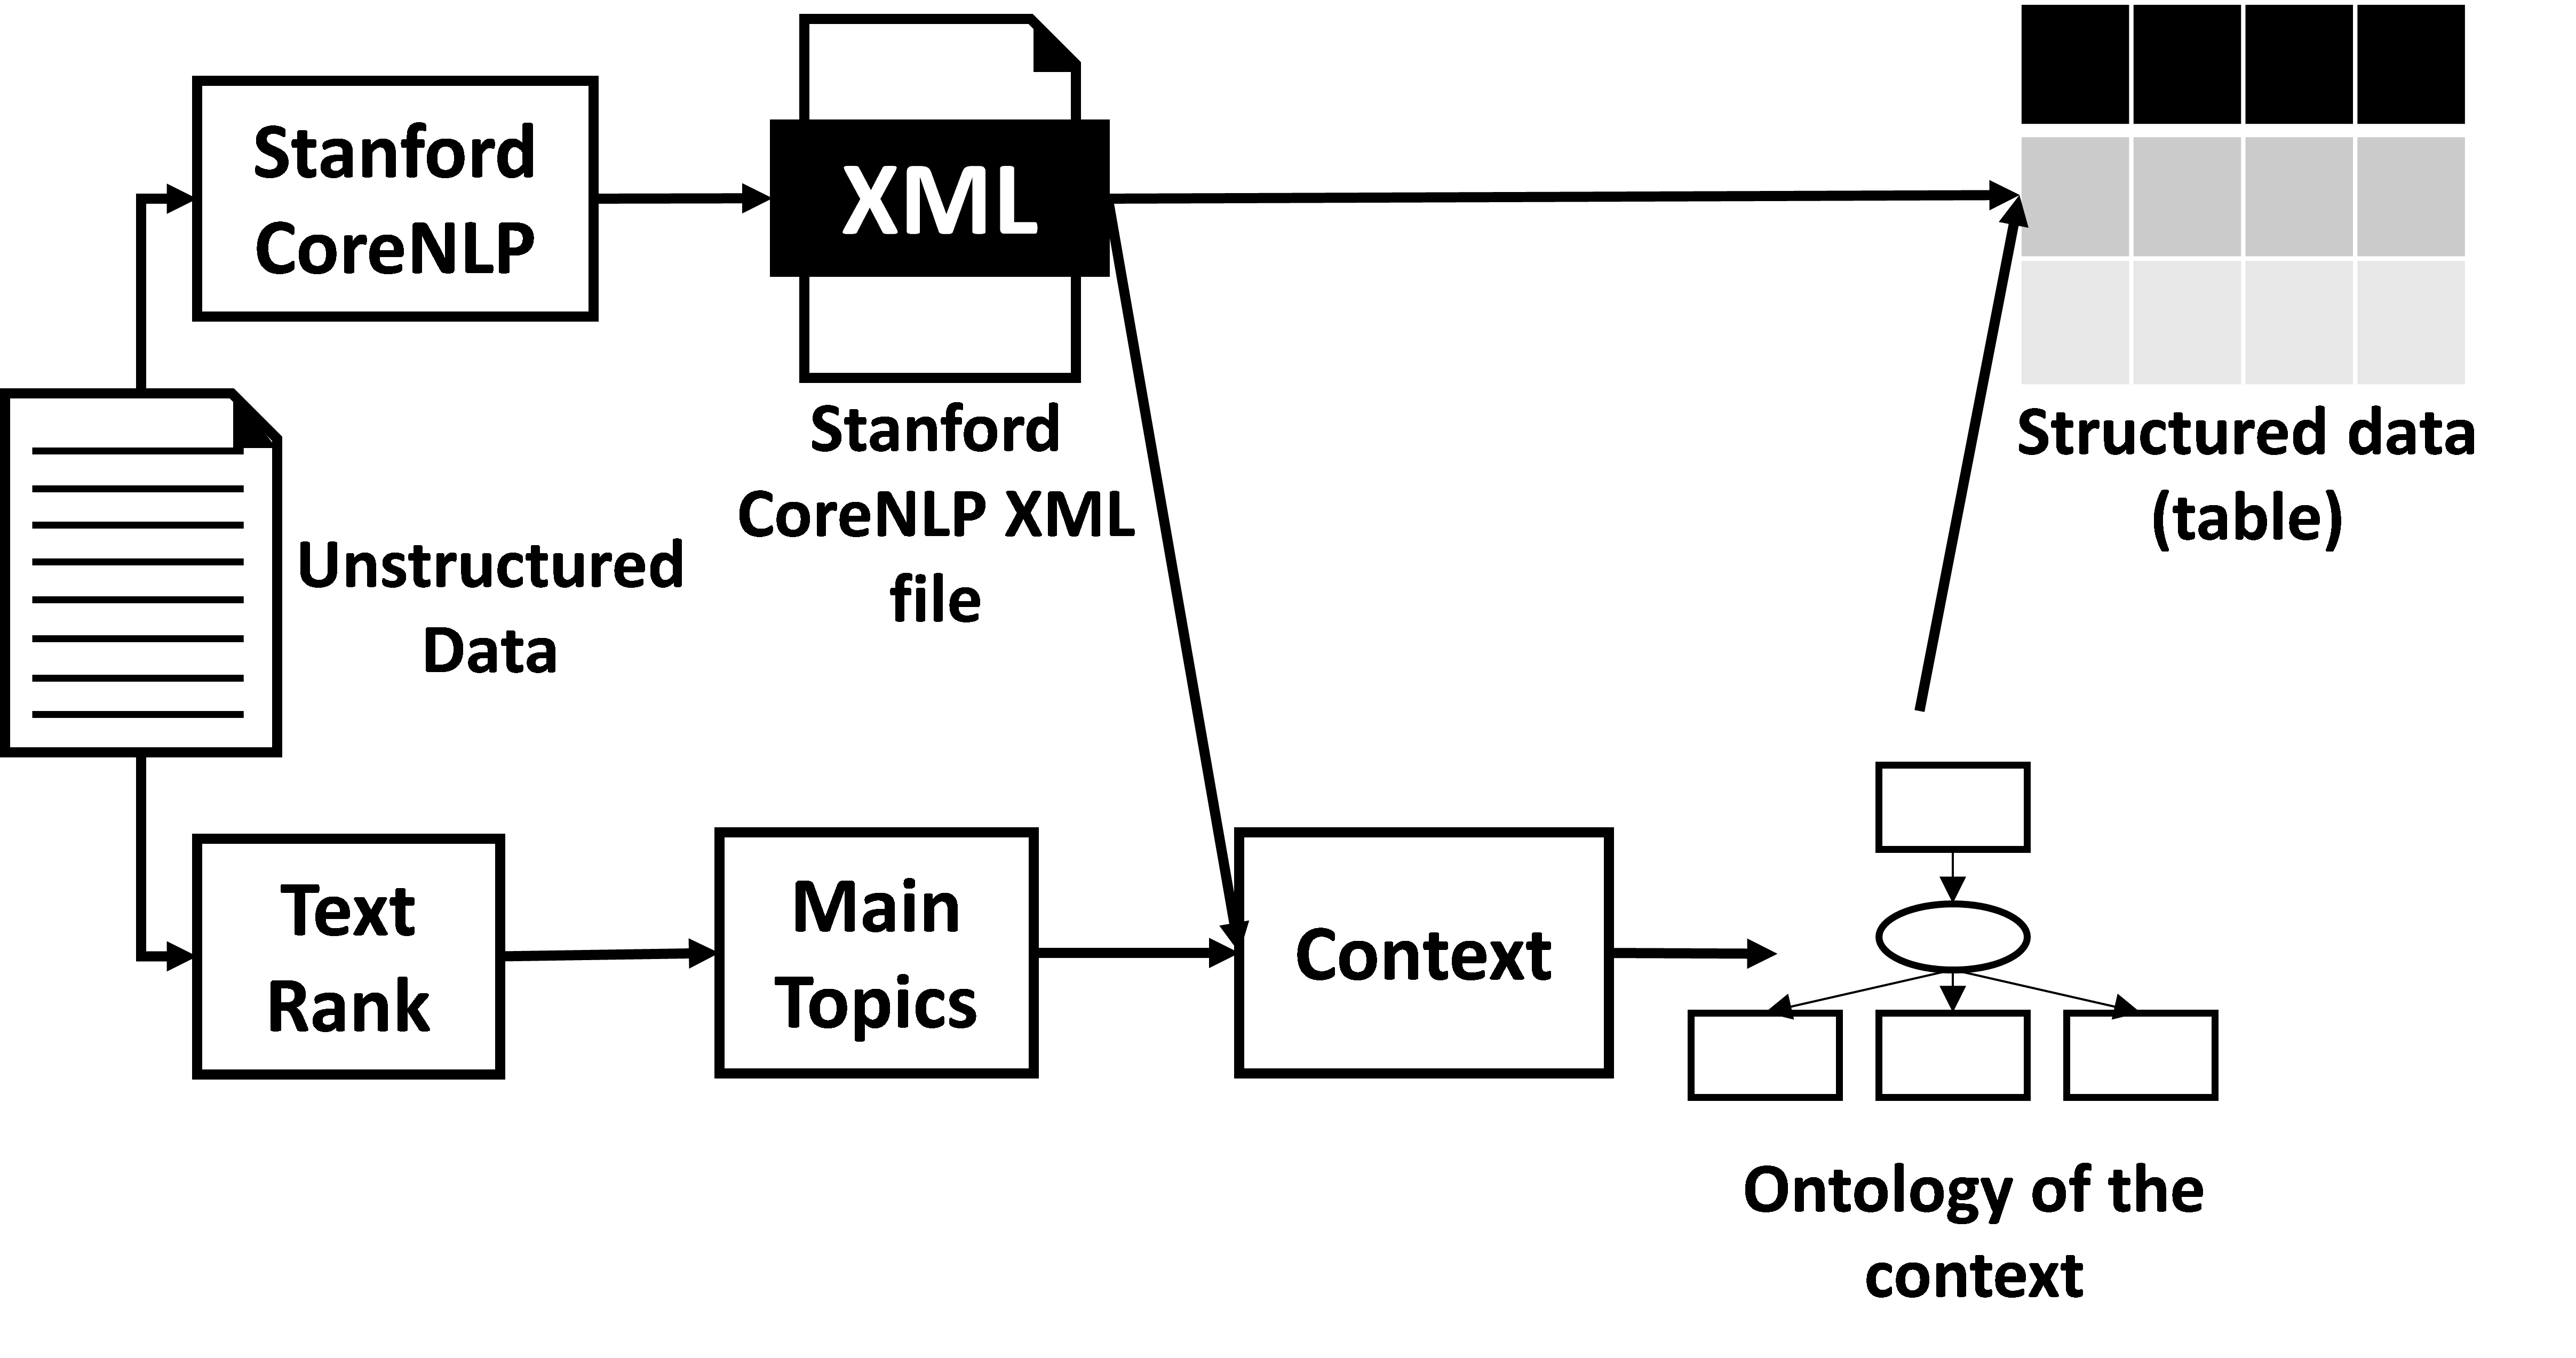 Fig.6: Architecture of the application
The application has been developed with the help of the following open source frameworks:
- Stanford CoreNLP [26], a Java open source framework created by Stanford University, that implements most of the common core natural language processing (NLP) steps needed in our approach, from tokenization through to coreference resolution.
- TextRank [27]: a Java implementation of the TextRank algorithm allowing the identification of the most important keywords in a document.
- WordNet Similarity for Java (WS4J) [28]: a module that implements a variety of semantic similarity and relatedness measures based on information found in the lexical database WordNet.
The application has been tested on several types of data. In this paper, we present the case of the French presidential elections of 2017. The recognition of the context is precise however, we had some problems for the recognition of the “speaker”. We have modified the source code, but we have not yet got the expected precision and a research work is underway to address this issue.
The forum contains only expressions of voting intentions and no numerical data (Fig. 3). Each row of it is an expression of opinion in which the “speaker” supports the candidate he has chosen. Fig. 7, Fig. 8, Fig. 9 and Fig. 10 represent the output of the application:
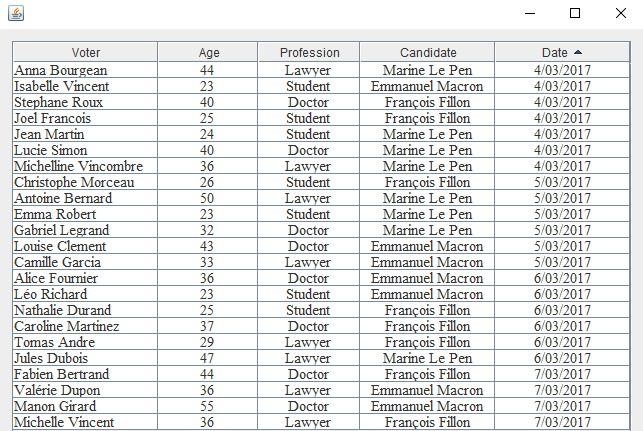 Fig.7: Countable data recognition
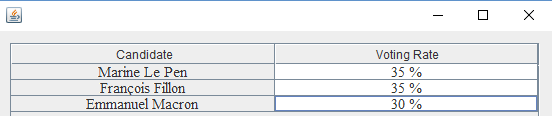 Fig.8: Voting rate per candidate
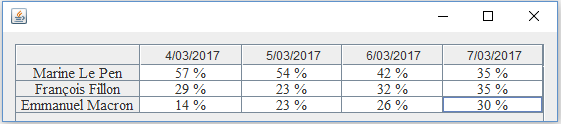 Fig.9: Voting rate vs. Date
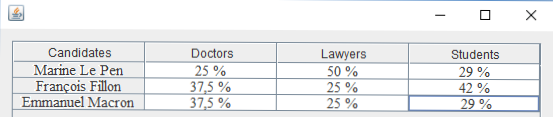 Fig.10: Voting rates vs. Socio-professional category
The following graphs can be obtained on request from the various calculation results performed by the application: the voting rate per candidate (Fig. 11), the voting rates vs. date (Fig. 12) and the voting rates vs. socio-professional category (Fig. 13)
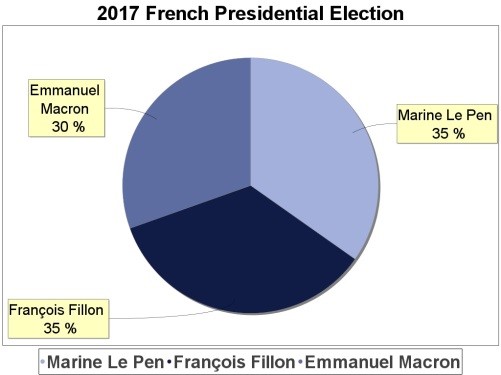 Fig.11: Pie chart of the voting rate per candidate
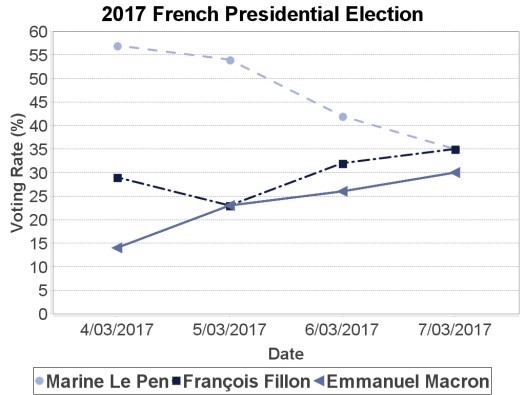 Fig.12: Polygraph of the voting rates vs. date
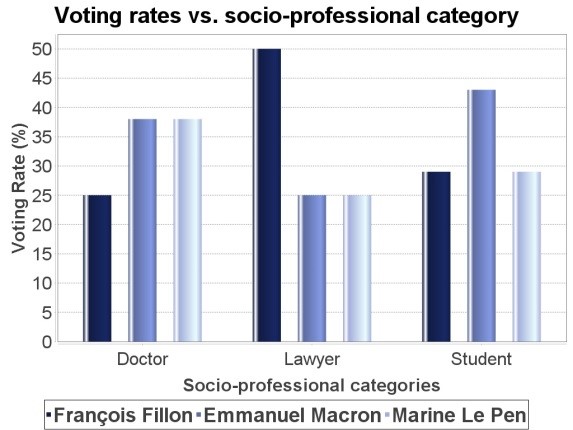 Fig.13: Polygraph of the voting rates vs. date
6. Conclusion
Visualization provides a simple, easy-to-interpret idea of a data volume that may be too large. The graphically representable data generally contain relationships between causes and effects that may change according to different criteria (date, region, climate, etc.). Data linked by cause-and-effect relationships can be either quantitative or qualitative and may also be in the form of structured or unstructured data. When it comes to unstructured data, it is easy for a human mind to extract relationships and make the graphical representation if the volume of data provided is reasonable. Since this is a very large volume of data, computer assistance is essential. For structured data, this is hardly a problem, but when it comes to unstructured data, the work is more tedious.
In this paper, we present a method allowing the graphical representation of statistical data presented in the form of unstructured data. The first consists of transforming the unstructured data into structured data and then graphically represent this latter, which is an obvious task. We also present a framework developed from the results obtained from our research. The method is based on NLP and text mining for the analysis and identification of statistical data. An algorithm has been developed for the transformation of unstructured statistical data into structured data easily represented graphically.
The work presented in this paper is only the first step. Currently, it leaves an important number of research perspectives. Indeed, this work concerns only a single document. In our future work, we will exploit the results of a Web search query to make a graphical representation of common significant variable data. Similarly, we will intend to improve our process using the Text mining. This technique concerns the classification of multiple documents in order to enrich the “Ontology of the Context”. Besides, it will allow the analyses of the documents in order to extract the variable data.
- T.J. Berners-Lee et al., “World Wide Web: the information universe”, Electronic Networking: Research, Applications and Policy, 2(1), 52–58, 1992.
- Antoniou G. and Van Harmelen F. “A Semantic Web Primer”, The MIT Press, Cambridge MA. 2008.
- Cardoso, J., “The Syntactic and the Semantic Web. Semantic Web services: theory, tools, and application”, J. Cardoso (Ed), Information Science Reference, 2007.
- N. Ben Chaabene, and R. Guetari, “Semantic Annotation for the “on demand graphical representation” of variable data in Web,” IEEE International conference en system, Man, and Cybernetics, Budapest, Hungary, 2016.
- Van Hooland, S., De Wilde, M., Verborgh, R., Steiner, T., Van de Walle, R., “Exploring entity recognition and disambiguation for cultural heritage collections”. The Journal of Digital Scholarship in the Humanities, 30(2), 262-279, 2015
- Souvay, G., Pierrel, J.M., « LGeRM Lemmatisation des mots en moyen français », Traitement Automatique des Langues. 50(2), 149-172, 2009, “(article in French with an abstract in English)
- Tamilin, A., Magnini, B., Serafini, L., Girardi, C., Joseph, M., Zanoli, R., “Context-Driven Semantic Enrichment of Italian News Archive”, 6th European Semantic Web Conference, Heraklion, Greece, 2009.
- Lee, H., Peirsman, L., Chang, A., Chambers, N., Surdeanu, M., Jurafsky, D. “Stanford’s Multi-Pass Sieve Coreference Resolution System”, Conference on Computational Natural Language Learning : Shared Task, Portland, Oregon, 2011
- M. Mallek. R. Guetari, “Automatic detection of variable data in Web document: Graphical representation on demand” in IEEE International Computer Science and Engineering Conference Web conference (ICSEC), Chiang Mai Thailand, 2016.
- R. Mihalcea, and P. Tarau, “TextRank: Bringing Order into Texts”, The 2004 Conference on Empirical Methods in Natural Language Processing, Barcelona, Spain, 2004
- Jiang, J., Conrath, D., “Semantic Similarity Based on Corpus Statistics and Lexical Taxonomy”, International Conference Research on Computational Linguistics (ROCLING X), pp. 19–33 (1997)
- G. Chowdhury, “Natural language processing,” Annual Review of Information Science and Technology, 37, pp. 51-89, ISSN 0066-4200, 2003.
- D. Nasa, “Text Mining Techniques- A Survey”, International Journal of Advanced Research in Computer Science and Software Engineering, 2(4), 2012.
- A. Kaushik, S. Naithani, “A Comprehensive Study of Text Mining Approach”, International Journal of Computer Science and Network Security, 16(2), 2016
- V. Gupta, and G.S. Lehal, “A Survey of Text Mining Techniques and Applications,” Journal of emerging technologies in Web intelligence, Vol. 1 – n° 1, pp. 60 – 76, 2009.
- K. Glass and S. Bangay, “A naive salience-based method for speaker identification in fiction books”. In Proceedings of the 18th Annual Symposium of the Pattern Recognition, 2007.
- N. Lie, and D.D. Wu, “Using text mining and sentiment analysis for online forums hotspot detection and forecast,” International Journal of Decision Support Systems, pp. 354 – 368, 2010.
- H. He, D. Barbosa and G. Kondrak, “Identification of Speakers in Novels”, in Proceedings of the 51st Annual Meeting of the Association for Computational Linguistics, 2013.
- S. Bethard, H. Yu, A. Thornton, V. Hativassiloglou and D. Jurafsky, “Automatic Extraction of Opinion Propositions and their Holders”. In AAAI Spring Symposium on Exploring Attitude and Affect in Text, 2004.
- S.M. Shamimul Hasan, D. A. Adjeroh, “Detecting Human Sentiment from Text using a Proximity-Based Approach”, In Journal of Digital Information Management 9(5), pp 206-212, 2011
- W. Jin, “A Novel Lexicalized HMM-based Learning Framework for Web Opinion Mining”, In Proceedings of the 26th International Conference on Machine Learning, Montreal, Canada, 2009.
- Wilson T., Wiebe J. et Hwa R. (2004). Just how mad are you? Finding strong and weak opinion clauses, In proceedings of AAAI’04.
- V. Hatzivassiloglou and K. R. McKeown, “Predicting the semantic orientation of adjectives”, In proceedings of ACL’97, p. 174–181, 1997.
- H. Yu and V. Hatzivassiloglou, “Towards answering opinion questions: Separating facts from opinions and identifying the polarity of opinion sentences”, In proceedings of EMNLP’03, p. 129–136, 2003
- S.-M. Kim and E. Hovy, “Determining the sentiment of opinions”, In Actes of COLING’04, p. 1267–1373, 2004.
- C.D. Manning, M. Surdeanu, J. Bauer, J. Finkel, S.J. Bethard, and D. McClosky, “The Stanford CoreNLP Natural Language Processing Toolkit,” In Proceedings of 52nd Annual Meeting of the Association for Computational Linguistics: System Demonstrations, pp. 55-60, 2014.
- D.D Pawar, M.S Bewoor, and S.H Patil, “Text Rank: A Novel Concept for Extraction Based Text Summarization,” International Journal of Computer Science and Information Technologies, 5(3), pp. 3301 – 3304, 2014.
- H. Shima, “WS4J : WordNet Similarity for Java,” [Online]. Available at: https://code.google.com/p/ws4j/, 2013.