Indoor monitoring in Public Buildings: workplace wellbeing and energy consumptions. An example of IoT for smart cities application
Indoor monitoring in Public Buildings: workplace wellbeing and energy consumptions. An example of IoT for smart cities application
Volume 2, Issue 3, Page No 884-890, 2017
Author’s Name: Stefania Nanni1, a), Elisa Benetti1, Gianluca Mazzini2
View Affiliations
1LepidaSpa, Viale Aldo Moro, 64, 40127 Bologna, Italy
2University of Ferrara, Via Savonarola, 9, 44121 Ferrara FE, Italy
a)Author to whom correspondence should be addressed. E-mail: stefania.nanni@lepida.it
Adv. Sci. Technol. Eng. Syst. J. 2(3), 884-890 (2017); ![]() DOI: 10.25046/aj0203110
DOI: 10.25046/aj0203110
Keywords: Indoor monitoring, Consumptions monitoring, Sensor integration, IoT Smart Cities, Environmental awareness, Workplaces wellbeing

Export Citations
In the recent years LepidaSpa created Sensornet platform for the control of the Emilia-Romagna territory managing heterogeneous environmental sensor networks distributed all over the region. LepidaSpa decided to integrate into Sensornet a brand-new family of sensors measuring indoor environmental parameters inside public buildings, in order to monitor energy consumption on one hand and workers’ wellbeing on the other. The innovative aspects of the adopted solution (the extreme simplicity of the sensor network architecture, its ease of installation, the real time detection of parameters directly related to power consumption and the availability of environmental parameters measurements (temperature, humidity and light) simultaneously providing context information on the power consumption and correlation to working conditions) made it a perfect candidate for a seamless integration within the platform and for an intensive monitoring campaign. This paper is presenting the results of such monitoring activity, where an IoT infrastructure acts as an enabler of a Smart City solution, focused on a sustainable wellbeing of the working places.
Received: 05 April 2017, Accepted: 12 May 2017, Published Online: 20 June 2017
1. Introduction
The concept of “smart building” is focused on scientific and technological development and social advancement of automated and integrated management of intelligent buildings systems. While the automation of new buildings, being able to be provided in the process of realization, has a negligible impact on the overall costs, the automation of already existing buildings often requires an expensive investment both on the infrastructure point of view and on the economic one. To these ends, in the latest case, which is clearly the most frequent for the Public Administration, the support of a system for monitoring power consumptions, being able to identify wastes and allow their reduction, is necessary, not necessarily through a control system, but through a more careful and aware use of the conditioning system by the users themselves.
The above assumptions were the basis of the experiment conducted by LepidaSpa to demonstrate the generality and repeatability of the system and to make available to all PAs of the Emilia-Romagna region a tool for monitoring energy consumption, as well as economic and environmental benefits, derived from it.The development of new architecture for radio links based on low bit-rate, long range and low power consumption, (LPWAN) and the presence of a sensor platform available to all the PA of the Emilia Romagna region for the collection of data (SensorNet), constitute the right prerequisites for the development of an indoor monitoring system for energy consumption in public buildings, without the need for infrastructure works on already existing buildings.
This paper will explain and demonstrate the main innovative aspects of the proposed solution, such as the extreme simplicity of the network architecture used, the ease of installation of the indoor monitoring system, the simplification of the energy monitoring through the measurement of indirect parameters (temperature, humidity and light), the detection in real time of parameters related to the consumption, the possibility of immediate intervention on their reduction by a direct, conscious and spontaneous action of the users and its repeatability on a large scale.
Section II of this paper shows the evidence of the big interest on the theme of consumptions and of the limit of the traditional wireless technologies used until today for indoor monitoring systems. Section III explains the conceptual, architectural and functional model of the proposed solution. Section IV shows the technical and logistic features and constraints of the building used for the test. The analysis of the experimental data is presented in section V, and their correlation with wellbeing parameters is provided in section VI. In section VII the consequences in Energy saving are provided. Conclusions are provided in Section VIII.
2. The State of The Art
Reducing energy consumptions, especially those related to electric energy, in buildings is a topic of big interest [1] as it relates to the problem of greenhouse gas emissions: the CO2 emitted by the latter each year is equal to 15% of emissions total worldwide (source World Research Institute). The legislation at EU and national level is increasingly stringent on energy containment in buildings, as evidenced by the past European Directive 2010/31 / EC and the more recent 2012/27 / EU. Until the beginning of 2012 every year the new buildings with high energy performance and existing ones improved, represented a share of 2,5% of the total housing stock, while on the remaining part of the buildings was not carried out any type of improvement [2].
The availability of new technologies is making a significant contribution to the creation of “smart buildings” and the achievement of the European objectives.
Both wired and wireless environmental monitoring systems have their own benefits over the other, as well as their own drawbacks. For the purpose and constraints of this research, dealing with buildings already existing, only wireless technologies will be treated.
The paradigm of sensor and actuator networks is based until now on short-range transmission technologies, often in the frequency band around 2.4 GHz, with multi-hop architecture, such as the ZigBee system [3]. In metering application another standard “de facto” protocol is the wireless M-BUS (169MHz / 868MHz), which requires, in general, the use, on top of a concentrator, also of one or more repeaters to extend the signal range radio peripheral nodes [8][9][12].
Currently however networks with wide geographic coverage operating in the band around the 868 MHz in Europe and 915 MHz in the USA are emerging. An example of this type of system is the one used by SIGFOX, an operator dedicated to the internet of things (IoT – Internet of Things), which, from France, is extending its coverage to Russia and other European countries, also including, from 2015, Italy. [10]
A technology that fits into this trend, but that can be used in private applications (that is, without necessarily requiring the presence of an operator) is the Lo-RaTM of Semtech technology [4]. The Lo-RaTM (Long Range) technology can be considered the actual innovation in the IoT world as it extends by a factor of ten the coverage range compared to the de facto standards, such as ZigBee, constituting an infrastructure enabler for new and different application areas, starting from that of monitoring of consumption.
3. The Proposed Solution
In an article that appeared in the chronicle of Bologna in early February 2016 [11] the virtuous and rather isolated example of the Sala Borsa was reported, highlighting its compliance of the legislation limits regarding the maximum temperature allowed inside public buildings. To be fair, the same article also reported the use of coats and scarves by users who were reading in the library. This example shows how the imposition of limits on the permissible temperature in public offices is not always easy to apply, both for technical and technological issues, but also for contour conditions such the time of permanence or the activity carried out in the offices, which can determine a different degree of perception of the temperature. Having said that, however, is crucial to have tools that can detect a possible misuse of energy resources in buildings, starting with those public, enabling energy savings just from the elimination of unnecessary waste, and that constitutes a concrete solution, effective and replicable on a large scale.
The proposed solution is a monitoring system, and not a control system, which aims at providing feedback to the buildings manager on the consumption. The conceptual model of the proposed system is based on a centralized control system of a distributed building stock that could bring significant energy savings with very low investment costs being primarily based on control, intelligence and awareness [5].
The technology Lo-RaTM of Semtech allows monitoring very extensive building via wireless. It uses a star topology (in which the various nodes-sensors are connected directly to a hub-gateway node and is suitable for low traffic applications (such as monitoring). The advantages of the technology Lo-RaTM [6] compared to existing technologies for sensor networks are:
- a range 10 times more extended, compared to the short-range technologies, thanks to a 198dB link budget (obtained via a modulation of the spread spectrum type) that allows for connections of up to 15 km in the sub-urban area, 2-5 km in densely populated urban areas and 2 km inside buildings;
- simplified network architecture that avoids the multi-hop and all related problems;
- low consumption of nodes (up to 10 years on battery power);
- very high network capacity: a single-concentrator gateway can connect thousands of nodes (up to 50,000)
- very low cost of the transmitters nodes.
All the above features make the Lo-Ra™ system an optimal solution, in the current scenario, for the implementation of energy monitoring systems of buildings because a single concentrator can cover one or more neighbouring buildings with a star architecture, which eliminates the problems associated with multi-hop (routing problems, latency, etc.) and because is characterized by high energy efficiency which can enable the duration of the batteries of nodes even for several years.
The monitoring system is based on a network of sensors installed in every building that transmit the indoor parameters to a central system in real time. These sensors are low-power and easily replaceable because of radio data transmission and because of being battery powered. The network of sensors, widely distributed within each building, allows the monitoring of the parameters, such as temperature, humidity and brightness, providing useful indications about the consumption resulting from the conditioning system. The transmission system, integrated on each sensor node, transfers the measured data to a single centralized point in real time. In the “control room” the parameter information is stored and processed on a server (remote intelligence). The data analysis module is able to detect in real time any conditions of energy waste, such as the exceeding of the reference temperature thresholds, different for summer and winter [7]. An automatic “warning” system, allows to report any abnormal conditions detected, by sending email or text message to the involved user, which will have to spontaneously provide to an immediate regulation of local conditioning system and pay more attention on unnecessary consumptions. System web interface allows all users to view at any time and in real time the value of the parameters measured in their own office, favouring the acquisition of a greater awareness of consumption and use of energy resources.
4. The Test Bed
As a test bed has been chosen a building known and verifiable, the headquarters of LepidaSpa, located in a tower of the Bologna exhibition, divided on three floors with a total of thirty offices (Fig. 1, point A).
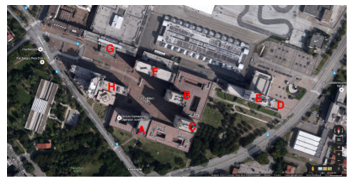
Figure 1: The Test Bed
In this building, as in all those of the same area, the conditioning system is centralized, with forced convection and independently adjustable in every office. The central conditioning system is switched on and off automatically on the working days from 6.00 to 19.00. The windows of the building are locked. The test bed consists of the installation of a sensor node in each office of all three floors. The lack of constraint on the presence of an electrical power point has allowed to select the most suitable installation point, as close as possible to the workers to measure their real comfort, but so it does not interfere with normal business activities, and also far away from sources of heat or exposure to direct sunlight. Each sensor node is equipped with a temperature, humidity and brightness sensor. The sampling period is 15 minutes, while the data transmission period one hour. In each transmission, therefore, the sensor nodes send 4 samples for each of the three measured parameters, for a total of 12 measures.
An extension of the experimentation has provided, in its terminal stage, the displacement of some sensors in some offices of the adjacent towers to those of LepidaSpa (points G, F and H of Fig. 1), which has allowed to verify the actual coverage of the data transmission system, as well as the monitoring of environmental parameters relating to different entities and buildings.
5. Experimental Data
The monitoring has been focused on the detection of three environmental parameters inside the offices: temperature, humidity and brightness. The parameters were calculated automatically and continuously 24 hours a day, 7 days a week.
The monitoring period lasted a year, from May 2015 to April 2016, and it made possible, therefore, to monitor the use of the air conditioning system both in summer and in winter. Temperature measurements data, coming from the indoor monitoring system, were correlated with outside temperature measurements, coming from ARPA hydro-pluviometric monitoring system installed in the city of Bologna, to allow a deeper understanding in the reading of the data.
5.1. Temperature monitoring
Fig. 2 shows the graphs of the temperatures in Celsius degrees measured by the sensors installed in the offices in July 2015. A correlation between the internal temperatures and the outside temperature (blue sinusoid) can be noticed, but also a dispersion of several degrees in the indoor temperature measurements during the on-time of conditioning systems.
In particular, Fig. 3 shows the comparison of the temperature trend detected in two offices in the period from 29/06/2015 to 05/07/2015. It’s evident a rather different use of the air conditioning system on every working day, which it brings a difference of temperature up to a couple of degrees in the hottest hours between the two offices. Office users corresponding to the blue graph appear to have adopted the most efficient use of the conditioning system, since the temperature never drops below 26 degrees. From the chart it may also be noted that the air conditioning system in the office corresponding to the purple graph is always active regardless of the presence or absence of office staff, because it evident that it works when the offices are certainly closed.
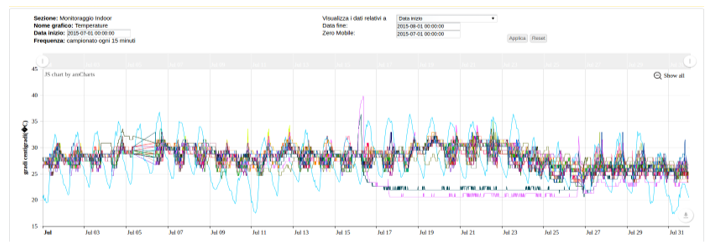
Figure 2: Temperatures in the offices in July 2015 expressed in Celsius degrees
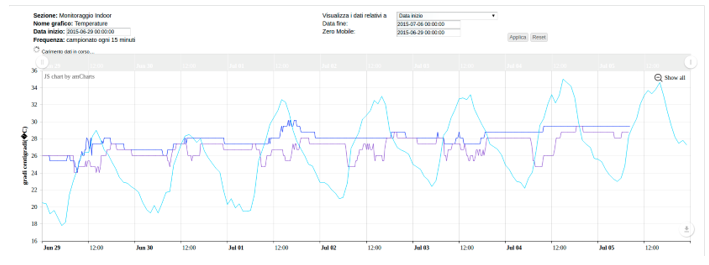
Figure 3: Temperature comparison of two offices from 29/06/2015 to 05/07/2015
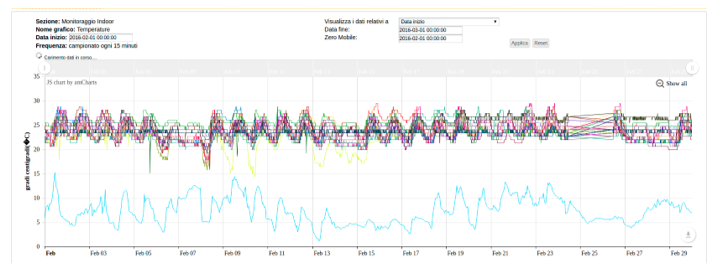
Figure 4: Temperatures in the offices in February 2016 expressed in Celsius degrees
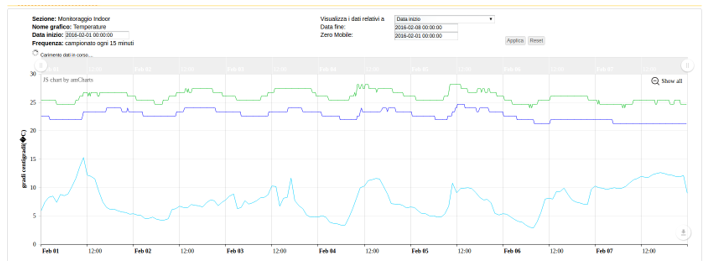
Figure 5: Temperature comparison of two offices from 01/02/2106 to 07/02/2016
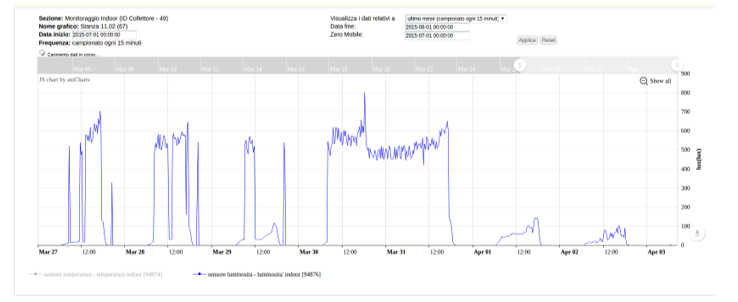
Figure 6: Lighting monitoring
Fig. 4 corresponds to the graphs of the temperatures measured in the offices in February 2016. The variance of the measured values is very high, up to five degrees. The average temperature during working hours is about 25 degrees, with peaks up to over 28.
Fig. 5 shows the comparison between the temperature trend detected in two offices during the first week of February 2016 in which a quite different use of the air conditioning system, even more than in the summer, is evident in all the days of working week. In particular, an average difference of more than two degrees between the temperature of the two offices can be noticed: while the temperature represented by the blue line is always below 24 degrees, the one in the green line is always above 24 degrees, with a typical value of 27 degrees.
5.2. Lighting monitoring
The brightness sensor installed on each sensor node enabled a very interesting lighting monitoring. The graphs corresponding to the data detected by the brightness sensor (expressed in lux) easily highlight the alternation between day and night, as well as the use of artificial light in place of the natural one.
Fig.6 shows a chart related to the lighting monitoring in an office during a week, in which it is evident a generally correct use of the light during the working hours (light-on), the night and the weekend (light-off), except for an occurrence of light left on during the night.
The analysis carried out during one year of testing has shown that the oversights were few. As a matter of fact, only five offices resulted having left the lights on for a total of only 11 occurrences in a year.
5.3. More data analysis
The graphs of the light sensors, as well as main information analysed in the previous paragraph, can provide some additional one, useful in the control and management of buildings and personnel occupying them. In Fig.6, for example, the entry and exit time of the employee sitting in the office can be easily distinguished as well as the proper use of the lights even in the lunch break, during which are kept switched off. The same graph also shows a typical reactivation of lights around 8PM, linked to the presence of the cleaning personnel, authorized to operate only after the working time
6. Conditions of Health and Wellness within the Offices
Environmental parameters monitoring inside the offices are also providing useful information about health and wellness conditions inside workplaces.
As a matter of fact, among the aspects considered in the EHS guidelines for the workplaces and environmental protection in working activities [13], on top of indoor air quality, passive smoking and noise, it is also possible to find indicators on microclimate and lighting matching the data analysis on the environmental monitoring.
6.1. Microclimate
The range of physical and climatic parameters (temperature, relative humidity, air speed) in a confined environment is called microclimate. Thermal wellbeing depends on the performed activity, on the clothing and on individual sensations that can be influenced by environmental parameters such as temperature, relative humidity and air speed. Besides, the spread of microbiological contaminants in a confined area is influenced and enabled by other factors such as temperatures above 26°C and Relative Humidity above 65%.
| PERIOD | AIR TEMP. | recommended value | R.H. |
| Summer | 19-24 | 22 | 40-60 |
| Winter | 17.5 – 21.5 | 19.5 | 40-60 |
Table 1: thermal comfort zone in sedentary working conditions and seasonal clothing
From the data analysis performed, it is possible to identify a significant overpass of the recommended temperature during the months when study was conducted, but it is also possible to note an overall respect of the recommended values for relative humidity, both in winter and in summer, with some isolated cases in the summertime (Fig. 7, Fig. 8).
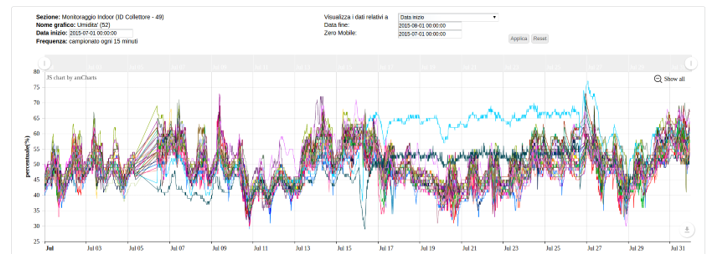
Figure 7: Humidity in the offices in July 2015
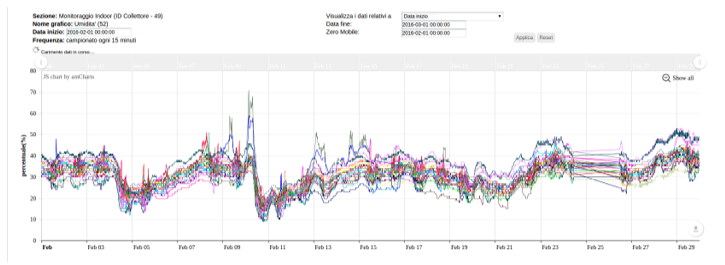
Figure 8: Humidity in the offices in February 2016
6.2. Lighting
The vast majority of the sensorial stimuli in the offices are visual, and eyes are evidently one of the most stressed organs. Natural light, although fundamental, is not sufficient alone to grant an adequate lighting in a confined area, since it is subject to a number of factors, among which the time of the day, the orientation of the room, the weather conditions, etc. In case of insufficient natural lighting, it is therefore necessary to provide a correct artificial lighting. There are several parameters defining a bright room, such as distribution and direction of the light sources, dazzling, etc… as an example, comparing in a table the measured parameters with minimum indoor requirements, it is possible to conclude that offices are correctly lightened (Fig.6).
| UFFICI | (ILLUMINAMENTO) LUX |
| Copy room | 300 |
| Structure | 500 |
| Data centre | 500 |
| Technical Drawings | 750 |
Table 2: Fonte normative: UNI EN 1264-1/2001
7. Energy Saving
Once the power of the light sources is known, the saving that can be achieved if lights are not turned on when nobody’s around can be easily calculated
Kwh yearly saving = light source power * # hours light source is off because of the good practice / 1000
The saving that can be achieved if the room temperatures is lowered by 1°C is much less straightforward to calculate, and even less known. It is reported that each degree Celsius less in the room temperatures is allowing a 7% annual saving on heating costs. Under this assumption, the annual saving can be calculated as
yearly saving (Kwh) =yearly cost*0,07*reduction of degrees
Taking into account that 1 KWh of electricity equals 0,72 Kg of CO2, it is possible to evaluate the quantity of carbon dioxide that is not emitted
These simple formulas tell us that a significant saving is possible even with small actions and good practices that can also be learnt by means of an awareness system such the one depicted highlighting the waste, misuse or dangerous use of resources.
8. Conclusions
The results of the experiment have shown the effectiveness of the energy monitoring system developed by LepidaSpa, highlighting that there are wide opportunities for savings coming from a more rational use of the heating and air conditioning system inside of LepidaSpa offices. In particular, while it has overall demonstrated a correct use of the lights, it has shown an incorrect use of the heating system in the winter period, detecting a much higher temperature than the allowed limits and much more than any reasonable margin of discretion.
Another important result was the verification of the radio coverage provided by the transmission system. Fig. 1 shows the positioning of the gateway (point A) and the different points in which the coverage has been verified (points B, C, D, E, F, G, H). The only area not covered consists of the E tower, inside which the received signal has not been sufficient to ensure reliable communications. The cause is probably to be identified in the C tower and in the interference caused by its height and its position between the extreme points A and E.
The results have, indeed, demonstrated the adequacy of the new technologies adopted, Lo-RaTM, which allowed the realization of unprecedented solutions and constitutes an enabling element for the IoT paradigm.
The solution illustrated is a real example of “Smart city” application not only because it provides a value-added service for the Public Administration through the use of new technology [13], but also because it has been made by the reuse of the already existing Sensornet platform [14].
The results of the experiment have finally demonstrated the generality and the possibility of large-scale implementation of the system, which can be adopted since now by all PAs of the Emilia-Romagna region interested in the implementation of energy savings policies through the detection of waste within their buildings, as well as of wellbeing conditions in their offices.
- Chen, Han, et al. “The design and implementation of a smart building control system. “e-Business Engineering, 2009. ICEBE’09. IEEE International Conference on. IEEE, 2009.
- “Monitoraggio e modellazione innovativa di consumi elettrici in smart building”, M. Annuziato, C. Meloni, S. Pizzuti (ENEA), F. Lauro (Università degli sutdi della Calabria), Novembre 2011.
- Akyildiz, Ian F., Xudong Wang, and Weilin Wang. “Wireless mesh networks: a survey. “Computer networks 47.4 (2005): 445-487.
- http://www.semtech.com/wireless-rf/iot.html.
- Tuan Anh Nguyen, Marco Aiello, Energy intelligent buildings based on user activity: A survey, Energy and Buildings, Volume 56, January 2013, Pages 244-257, ISSN 0378-7788
- http://www.semtech.com/images/mediacenter/collateral/ism_sg.pdf
- E. Benetti, S. Nanni, G. Mazzini, “Indoor Monitoring: SensorNet Integration and Actuations for Energy Saving”. Submitted to Software, Telecommunications and Computer Networks (SoftCOM), 2016 24th International Conference on. IEEE.
- http://www.telecomitalia.com/content/dam/telecomitalia/it/archivio/documenti/Innovazione/NotiziarioTecnico/2013/n3-2013/07.pdf
- Spinsante, Susanna, et al. “Wireless m-bus sensor networks for smart water grids: analysis and results. “International Journal of Distributed Sensor Networks 2014 (2014).
- Bhagwat, Pravin. “Bluetooth: technology for short-range wireless apps. “IEEE Internet Computing 5.3 (2001): 96-103.
- http://bologna.repubblica.it/cronaca/2016/02/04/news/termosifoni_bassi_contro_lo_smog_ma_gli_uffici_pubblici_non_si_adeguano-132657870/
- Squartini, Stefano, et al. “Wireless M-Bus sensor nodes in smart water grids: the energy issue. “Intelligent Control and Information Processing (ICICIP), 2013 Fourth International Conference on. IEEE, 2013.
- Carlo Alberto Rosini, Davide Barbieri, Tiziana Chiara, Dante Milani, “Sicurezza sul lavoro e tutela dell’ambiente nelle attività di ufficio”, Area Ambiente e Sicurezza.
- NANNI, Stefania; MAZZINI, Gianluca. From the Smart City to the Smart Community, Model and Architecture of a Real Project: SensorNet. Journal of Communications Software & Systems, 2014, 10.3.