An efficient model to improve the performance of platelet inventory of the blood banks
An efficient model to improve the performance of platelet inventory of the blood banks
Volume 2, Issue 3, Page No 839-844, 2017
Author’s Name: Annista Wijayanayakea), Manisha Dandunna
View Affiliations
Department of Industrial Management, University of Kelaniya, 094, Sri Lanka
a)Author to whom correspondence should be addressed. E-mail: anni@kln.ac.lk
Adv. Sci. Technol. Eng. Syst. J. 2(3), 839-844 (2017); ![]() DOI: 10.25046/aj0203104
DOI: 10.25046/aj0203104
Keywords: Platelets, Shortages, Wastage, Inventory management, Demand forecasting

Export Citations
Platelet transfusions are vital for the prevention of fatal hemorrhage. Therefore, a stable inventory of platelets is required for an efficient and effective delivery of services in all the hospitals and medical centers. However, over the past decades, the requirement for platelets seems to be continuously increasing, while the number of potential donors is decreasing. Moreover, due to its very short life span of just five days, a large volume of platelets expires while they are on the shelves, resulting unnecessary shortages of platelets. Furthermore, it is very costly and difficult to get platelets from another blood bank in a short notice. Hence, these unexpected shortages put the life of patients at risk.
This study is focused on addressing the issues discussed, by developing an efficient blood inventory management model to reduce the platelet shortages, and wastages, while reducing the related inventory costs. Currently, the blood banks are managing platelet inventory according to their own instincts, which result to shortages and wastages. As a solution, we propose a model to manage the daily supply of platelets by forecasting the daily demand. Three different algorithms were developed using lower bound, average and upper bound values and tested to find the optimal solution that best fits to manage platelet inventory. These models were tested using data for 60 days obtained from two different levels of blood banks in Sri Lanka, namely a General Hospital blood bank and a Base Hospital blood bank. In General hospitals, the demand for blood components including platelets is very high when compared to the Base hospitals.
The study was able to come up with two different inventory management models for the two different types of blood banks. The model that best fits the General Hospital blood bank where the demand is high and was able to reduce the shortages by 46.74%, wastage by 89.82% and total inventory level by 39.10% and, the model that best fits the Base Hospital blood bank was able to reduce the shortages by 100%, wastage by 81.48% and total inventory level by 37.95%. It can be concluded that the same models can be adopted by other blood banks with similar characteristics to manage their blood inventory efficiently.
Received: 05 April 2017, Accepted: 16 May 2017, Published Online: 19 June 2017
1. Introduction
Blood transfusions are generally required in surgeries, childbirths, organ transplants and for patients who are receiving treatments for diseases such as cancers and anemia. In Sri Lanka, total annual blood requirement exceeds 350,000 units and over the past decade the demand seemed to be increasing continuously. Since there are many voluntary donors as a result of the national culture and beliefs of Sri Lankans being a South Asian country, the demand was balanced throughout the history.
However, the blood units are outdated and blood is wasted in some areas while there are shortages in other areas. Blood shortages can put a human life at risk as the operations may have to be postponed, and moreover blood is an invaluable product and its wastage is highly undesirable.
The National Blood Transfusion ServiceFurthermore, with the increase of diseases and the increase in the number of patients who required surgery and transplants, over the past two decades, the demand for blood is expected to show an exponential growth in the future. On the other hand, with the increase in diseases transmitted through blood such as HIV and Hepatitis B, and with the increase in the aging population, the number of potential donors will be reduced. Hence there would be a challenge to fulfill the increasing demand with the reducing supply in the future.
National Blood Transfusion Service (NBTS) is engaged in the collection of blood, screening the collected blood and making different blood components, and distribution. Also, NTBS deals with any issues of whole blood and blood component etc. It is a nationally coordinated system with the National Blood Center (NBC). This has many branches/clusters in every province with several main cluster centers in each province. The National Blood Centre, which is the operational headquarters for the entire Blood Transfusion Service, has 96 bloods Banks Island wide. These 96 blood banks are incorporated into 19 cluster centers according to their geographical locations. Apart from the NBC cluster, in all other clusters, the main cluster center is a General Hospital blood bank and the blood banks under them are Base Hospital blood banks.
The inefficient inventory management methods in each cluster and lack of coordination among different clusters lead to wastages as well as shortfalls of blood. Furthermore, despite the fact that blood is a costly product, the national blood transfusion service in Sri Lanka is not cost effective and the expenses are increasing day by day.
- Platelets
The whole blood is processed into several blood components or products including plasma, platelets, red blood cells and, another hundred and fifteen other components. Blood plasma is a straw colored liquid component of blood that normally holds the blood cells in whole blood in suspension. Red blood cell, also called erythrocyte, cellular component of blood millions of which in the circulation of vertebrates give the blood its characteristic color and carry oxygen from the lungs to the tissues. Platelets are the blood cells that help the blood clot, stop bleeding when blood vessels are injured. Furthermore, when patients are receiving chemotherapy or suffering bleeding complications require platelet transfusions to prevent a fatal hemorrhage. Normally platelets are produced from whole blood in the initial separation process; on the other hand, platelets can also be collected through apheresis. However, in Sri Lanka only the national blood center has an apheresis machine.
Among all the blood components platelets have the shortest life span of just five days making it difficult to handle the inventory without experiencing both wastage and shortages. Hence this study is focused merely on platelets and all the solutions provided are customized to the special characteristics of platelets. Moreover, component processing and testing for transmissible diseases take an average of one day to complete and platelets are generally available for transfusion only for four days. However, platelets need not to be cross-matched as red blood cells.
2. Literature Review
Only very few research was done on the topic on ‘management of blood bank supply chain. Research on the management aspects of the blood supply chain were started in the 1960s, peaked in the late 1970s and early 1980s and then dropped off continuously to the present time. In 70s and 80s, many researches were done regarding blood bank management policies [1], and regarding theories of perishable inventories [2]. Thereafter, it shows a decline and experts argue that this was caused by the collapse of funding for studies in the area and in the increasing difficulty of the remaining problems in this area [3]. Since the mid-1980s, research on this topic has mostly been in the development of information systems to support donor screening, inventory management, blood ordering, blood usage review and compatibility testing [4]. Furthermore, few other studies were done during the past two decades as well.
From 1960s to 2000s William P. Pierskalla has done several researches in this area addressing different issues. In 1970s a transportation and location allocation model was developed for regional blood banking in the hope of decreasing overall costs. The objective was to decide how many central blood banks to be set up, where to locate them, how to allocate hospitals to the banks and how to route the periodic supply operations [5].
In 2001 the Nova Scotia government funded a project to investigate mechanisms to coordinate the platelet supply chain between CBS (Canadian Blood Services) and local hospitals. This study was done in three phases and in the first step a platelet repository was developed to store information necessary for an integrated planning model. In the second step a dynamic programming model was developed to identify optimal ordering policies for both the CBS and hospitals, and finally a simulation model was developed to evaluate integrated order policies. To simplify the problem by reducing the problem search space, orders and demands were aggregated into larger units and that approach was not used in the previous studies [6].In 2004 a detailed analysis was published, addressing the issues; regional structures and economies of scale, optimal target inventory levels, cross-match release policies, allocation, transshipment and issuing policies, vehicle routes and demand forecasting [3]. Cross-match releasing policies and other issues such as dealing with mismatching and keeping rare blood products in the inventory were addressed later by Katsaliaki and Brailsford. [7].
Apart from the statistical approaches, few studies were conducted on applying lean techniques to improve the performance of the blood supply chain. A recent study was done in Serbia to identify the most appropriate lean six sigma improvement methods and hence develop a framework to improve main blood inventory management processes that will minimize the wastage of blood [8].
Though different models were developed to address different issues, only few models have integrated more than one blood product or varieties of products, due to the complexity of modeling the different shelf lives and of computing the remaining shelf life. Furthermore, in all the above cases, collection of blood is a centralized activity, whereas in Sri Lanka, blood is collected by each and every blood bank to satisfy their own demand. On the other hand, the national blood center is distributing blood to all blood banks in the country if a request was made. Apart from that hospital blood banks can share their excess volumes with other blood banks where there are shortfalls. Therefore, policies regarding inventory management as well as distribution are completely different from the above studies and hence there was a need to conduct a study specific to the Sri Lankan blood transfusion service.
3. Methodology
In the current method, blood inventory management was handled manually. However, there is no proper mechanism used to handle them efficiently, but based on the previous demands and experience of the staff and their own instincts on the inventory of the blood components are handled and managed. Therefore, the current practices cause many issues and lead toward shortages and wastages at many occasions. In this research, a customized spreadsheet based on a statistical analysis was developed to manage the platelet inventory level in hospital blood banks. To develop the spreadsheet, several mathematical models were tested and using the results from each model, the best model was selected using a multiple criteria decision analysis method (MCDA).
The models were developed in three phases; in the first phase different methods for forecasting the daily demand for platelets were tested and the best models for each technique was selected, in the second phase using the selected forecasting models different lower bound, mean and upper bound values were defined and in the third phase three different algorithms were developed to determine the optimal target inventory levels for blood banks that will reduce both shortages and wastages, hence the cost of operations.
In 2007 Katsaliaki and Brailsford [7] found that in the UK the demand for platelets follow a Log Normal distribution and all previous researchers have used the same approach in their research. Hence it can be assumed that the demand is normally distributed and moreover as a pilot test, some demand values that match the Sri Lankan conditions were randomly generated and tested for normality. From the pilot test it was found that the platelet demand is normally distributed.
3.1 Phase I: Forecasting the daily demand for platelets
Since the daily platelet/blood supply needs to be balanced, it is needed to forecast the daily demand for platelets/blood. Four different time series techniques were used to forecast the demand. Since the daily demand is stochastic, the Moving Average (MA), Weighted Moving Average (WMA) and Exponential Smoothing (ES) methods were used to forecast the demand. In addition, a Trend Analysis was conducted to check whether the daily demand shows any linear trend. According to the experience and knowledge of the staff of the blood banks there is no upward or downward trend in the demand of platelets. However, in the months of December and April, due to the festival season, which experiences the high rate of accidents, an increase in the demand for blood components can be observed and experienced. Nonetheless, according to the experts there is no possibility of observing a trend in daily demand and yet the trend analysis was conducted to verify that fact.
Sampling frame for this study includes all the blood banks of the NBTS except the National Blood Center cluster. When selecting the samples, the level of the blood bank was taken into consideration and one general hospital blood bank (a main cluster center) and one base hospital blood bank was selected for data collection. In order to make the sample more representative, from two blood banks that were selected, one was with a comparatively high level of demand and the other was with a low level of demand and yet the level of supply is equivalent in both hospitals. Two months (60 days) data taken from the blood banks were used for forecasting and analyzing demand, under the all four techniques.
3.2 Phase II: Defining mean, lower bounds and upper bounds for daily demand
Under the normality assumption, using the daily demand values, the selected forecasting methods MA, WMA and ES, computed the, mean, lower bound (LB) and upper bound (UB) values for the demand for each model. These mean, UB, LB values were considered as the minimum inventory level that should be maintained in order to avoid the shortages. The confidence level of 95% was used to calculate the different upper and lower bounds.
3.3 Phase III: Managing the daily supply and total platelet inventory level
Several mathematical models were developed in this final phase. The objectives were to find the best model that minimizes wastages, experience no shortages, keep the inventory level as low as possible by managing the supply and ultimately reduce the cost.
Considering the three different levels of inventory; lower bound, mean and the upper bound, three algorithms were developed and those algorithms were used to develop the different models. In all these algorithms, it was assumed that the entire intake of blood is usable despite the fact that a certain number of blood units will be rejected and disposed if they were infected with diseases transmitted through blood. However, in Sri Lanka still it is a nominal negligible amount, yet it seems to be continuously increasing. Since the figures of rejected blood are difficult to obtain due to confidentiality issues and as they were small in values according to the experts, it was not considered in these algorithms.
Once the blood is donated, it will be separated into different components and then it is tested for infectious diseases. It almost takes one day and therefore platelets only have four more days left on which they can be used. However, blood banks only records the date a blood unit is donated, but not the time it was donated. Therefore, the remaining shelf life is calculated on a daily basis but not on the time scale.
Three algorithms were developed around the same basic theory as described below. Currently, blood banks receive all the blood units donated by donors and yet the main objective of algorithms, is to manage the supply in an efficient manner. All the algorithms are updating remaining shelf life on a daily basis, however data can be input and outputs can be viewed at any time. In these algorithms the platelets are issued to the wards based on “First In First Out” basis. However, platelets with a remaining shelf life of one day are not given away or taken from another blood bank as those units have a high possibility of expiring the next day, before they are used. Also, cost reduction is one indirect objective of the algorithms, dispatching or ordering such platelet units is highly undesirable.
In all algorithms, before taking blood from donors, the inventory levels are checked to find if the desired reorder levels are met. If the current inventory level is above the reorder level, then the donors were asked to donate it some other day or direct them to the nearest cluster location where the blood is needed. This would minimize the medical expenses used for testing the blood components unnecessarily, which may avoid wastages of blood components. If the blood inventory goes below the reorder level, orders are placed to get platelets from other blood banks, to fill the gap. Here it is assumed that the blood is available at all times and the lead time to receive ordered blood as zero days. Therefore, the reorder level and the safety stock levels will be the same.
It was assumed that the blood banks will perfectly manage the model and however, extremely rare or unexpected situations arises where demand could go very high or supply could go very low continuously for a few days. These situations were excluded as in such situations the NBTS intermediate to control such situations. Therefore, such situations were not taken into consideration when developing the model.
3.4 Mathematical model to manage the Blood inventory system
Variables in the inventory management algorithms
LB – Lower bound for the forecasted daily demand for algorithm 1
M – Mean for the forecasted daily demand for algorithm 2
UB – Lower bound for the forecasted daily demand for algorithm 3
S – Actual platelet supply during the day
N – Days of stocks to be kept (Each algorithm was tested for both N=1, 2, 3 and 4)
Xi – Amount of platelet units in the inventory with a remaining shelf life of i days
Yi – Amount of platelet units with a remaining shelf life of i days, which need to be dispatched from the inventory
Zi – Amount of platelet units with a remaining shelf life of i days, which need to be ordered
D – Actual demand for platelets during the day
TI – Total inventory level in a day
TI = X1 + X2 + X3 + X4 + X5
WS – Wastage in a day
SH – Shortages in a day
From a pilot test done using computer generated data it was found that the best values for the days of stocks to be kept N are 2 and 3, among the four values tested 1, 2, 3 and 4, in order to minimize the wastages and shortages.
In all three algorithms, it was assumed that the orders will be delivered within the same day as the order is placed. Furthermore, while checking for the desired inventory levels, X1 value was not taken into consideration. The reason that the algorithms were developed in that way is to see if any, remaining units (after satisfying today’s demand) with a shelf life of only one day that is in today, will be expired tomorrow, and platelets taken today become usable only from the next day onwards. Therefore, ignoring X1 value reduces the risk associated with fulfilling the actual demand next day. However, algorithms were designed to ultimately minimize the total inventory level which is equal to X1 + X2 + X3 + X4 + X5.
The algorithm 1 presented below, which maintains the value X2 + X3 + X4 + X5 in the lower bound value is shown below. However this can be easily replaced by algorithm 2 and algorithm 3 by replacing the LB values by the mean and UB values
Algorithm 1
Objectives: – Min SH
Min WS
Min TI
Step 1: Checking the inventory
If X2 + X3 + X4 < LB*N Then
X5 = L*N – (X2 + X3 + X4)
Else
X5 = 0
Step 2: Amount to be dispatch or receive
If S >= X5 Then
Y5 = S – X5
Z5 = 0
Else
Y5 = 0
Z5 = (LB*N – (X2 + X3 + X4) – S
Step 3: Shortages
If D > X1 + X2 + X3 + X4 Then
SH = D – (X1 + X2 + X3 + X4)
Else
SH = 0
Step 4: Wastage
If X1> D Then
WS = X1 – D
Else
WS = 0
Total inventory level
TI = X1 + X2 + X3 + X4 + X5
Step1: The amount of platelet required on that day will be calculated
Step2: If the supply of platelet is greater than the required amount, then compute the dispatch amount Yi. If it is less than the required amount then compute the amount needed to be ordered Zi
Step3: Compute the amount of shortages
Step4: Compute the amount of wastages
3.5 Selecting the model that best fits the objectives
With the objective of minimizing the wastage, shortages and the total inventory level, all three algorithms explained above were tested using the different LB, Mean and UB values and using MA, WMA, and ES techniques under different confidence levels. There were altogether eighteen different models were developed and given different codes for each model which is shown in the below table (Table 1). For each model, the total wastage, total shortages and the total inventory level were calculated to compare the results and choose the best inventory management model, associated with the best forecasting technique using 95% confidence interval.
| Forecasting methods | LB Algorithm 1 |
Mean Algorithm 2 |
UB Algorithm 3 |
|||
|
** N=2 |
N=3 | N=2 | N=3 | N= 2 | N=3 | |
| MA |
MA 12 |
MA 13 |
MA 22 |
MA 23 |
MA 32 |
MA 33 |
| WMA |
WMA 12 |
WMA 13 |
WMA22 |
WMA 23 |
WMA 32 |
WMA 33 |
| ES |
ES 12 |
ES 13 |
ES 22 |
ES 23 |
ES 32 |
ES 33 |
Table 1:- Alternative Models for Platelet Inventory Management
**N=2, 3, 4, 5 days were considered but when N=2 and 3 produced better results.
In each testing model, the first two to three characters represent the forecasting technique used, the first digit represents the algorithm model number and the last digit represents the number of days that the stock needed to be considered. Since all the objectives are measured in the same unit, Weighted Sum Model (WSM) was used as the MCDA method to determine the best model among the eighteen models (given in Table 1). Delphi method was used to rank the three objectives and determine a weight for each objective. This was done merely consulting the experts and the staff of blood banks. The weights that were given can be changed according the experience and knowledge of importance. In our model the importance or weights for shortages given as 0.4, wastages the weight given was 0.375 and the total inventory management level the weights given were 0.275 while the sum of weights become 1. The model that yields the minimum total performance value was selected as the best model for managing inventory level.
4. Results
Data on demand from both blood banks was tested for normality to find whether they follow a normal distribution. Shapiro – Wilk test was used as the test statistic and it was found that demand for both hospital blood banks follows a normal distribution.
4.1 Outcomes of the different forecasting techniques
Using different number of days where n=2 to 12 the demand was forecasted in the Moving Average method and for each n value, Mean Absolute Deviation (MAD) was calculated to find the best value which minimize the forecasted Vs the actual error values. For General hospital blood bank, the least MAD value can be observed when n = 3, whereas for Base hospital blood bank, n = 9 gives the least MAD value. Therefore, n = 3 and n = 9 is selected as the best values for forecasting the platelet demand using the moving average method, for General hospital blood bank and Base hospital blood bank respectively.
Using weighted moving average method, for n = 2 to 15, the daily demand for platelets was forecasted and rank order centroid method was used to calculate the weighting factor. The least MAD value of General hospital blood bank can be observed when n = 5 and for Base hospital blood bank it is n = 12 hence for General hospital blood bank, n = 5 was selected and for Base hospital blood bank, n = 12 was selected to forecast the daily platelet demand using the weighted moving average method.
Using different values for the smoothing factor α, the daily demand for the platelets were forecasted and, MAD values for each α were calculated to find the best α for each blood bank. For General hospital blood bank, the least MAD value can be observed when α = 0.2 and for Base hospital blood bank, the least MAD value can be observed when α = 0.3. Therefore, α = 0.2 and α = 0.3 were selected for General hospital blood bank and Base hospital blood bank respectively to calculate the forecasted daily demand.
It was found that the demand shows no linear trend, exponential trend or polynomial trend in the daily platelet demand at both General hospital blood bank and Base hospital blood bank, throughout the two months considered. Hence it can be concluded that the daily demand for platelets shows no underlying trends and the demand is random for both General hospital blood bank and Base hospital blood bank.
Using the all three forecasting methods selected, from samples of seven days, the mean daily demand was calculated for each day and, using 95% confidence levels, the respective lower bound and upper bound values were calculated for each day considered.
When the forecasted demand and the actual demands were analyzed the difference was a negligible amount. The actual and forecasted demands were shown below for ES33 model in Fig 1
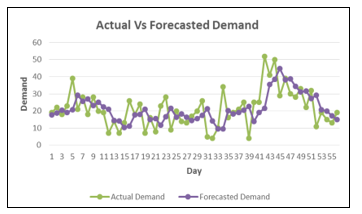
Figure 1:- Actual vs Forecasted Demand for model ES33
4.2 Analysis of the platelet inventory management models
For each blood bank, all the eighteen models shown in Table1 were applied and the percentage of reduction in shortages, the percentage of reduction in wastages and percentage reduction of the total inventory level was calculated for each of those models. Thereafter, using the weighted sum model as explained in section 3, the total performance for each model was calculated.
The models were tested separately for 30 days and for 60 days using the new forecasted demand values. Thereafter the average performance for each model was calculated using the actual values. The difference between the actual values and the forecasted values were considered to evaluate the best model.
The table below shows the total performance of best three models for General hospital blood bank.
| Model | Reduction of Shortages % | Reduction of Wastage % | Reduction of TI % | Total Performance % |
| WMA32 | 46.74 | 89.82 | 39.10 | 61.18 |
| MA32 | 46.47 | 89.76 | 37.32 | 60.64 |
| ES33 | 86.61 | 55.24 | 9.82 | 57.57 |
Table 2:- Best three Models for General hospital Blood Bank
As it shows the model WMA32 which use the weighted moving average method for forecasting the demand and use 95% confidence interval upper bound values and where the days of stock to be kept is two, gives the highest total performance for the General hospital blood bank. In average model WMA32 reduces shortages by 46.74%, wastage by 89.82% and total inventory level by 39.10%, resulting in a total performance of 61.18% achievement of objectives.
The below table shows the total performance of best three models for the Base hospital blood bank.
| Model | Reduction of Shortages % | Reduction of Wastage % | Reduction of TI % | Total Performance % |
| ES33 | 100.00 | 81.48 | 37.95 | 79.09 |
| WMA33 | 100.00 | 75.68 | 33.51 | 75.92 |
| MA33 | 100.00 | 72.90 | 31.99 | 74.53 |
Table 3:- Best three Models for Base hospital blood bank
As the above table shows, the model ES33 which uses exponential smoothing as the forecasting method and use 95% CI upper bound values for the forecasted demand and where the days of stock to be kept is three, gives the best total performance for Base hospital blood bank. In average model ES33 reduces shortages by 100%, wastage by 81.48% and total inventory level by 37.95%, resulting in a total performance of 79.09% achievement of objectives.
When we analyze the efficiency of all 18 models that we proposed, model ES33 produce better results for both General hospitals and base hospitals to manage blood. Here the reduction of shortages is 86% and 100% respectively.
It can be concluded that the above model can be adopted by the other blood banks to improve their inventory performance while minimizing the shortages. The same algorithm can be applied to other products with similar characteristics, such as food industry, pharmaceutical items and other perishable goods.
As discussed and proven above the proposed model could reduce the wastages and manage the shortages, while maintain a minimum amount in the inventory of blood banks. This would save most of the medical expenses unnecessary spend on testing and managing the inventory of blood components and could be used to uplift the medical services in any hospitals.
5. Further research
The area is fruitful for future research as there are so many areas that need to be improved, in the blood supply chain. This study has focused only on platelets, however the scope can be increased by adding other blood components such as red blood cells and plasma. Another area that needs to be addressed in a further research is clustering the blood banks island-wide, in a more effective way based on the transportation cost and time that takes to deliver a blood product/s to another blood bank. It should be noted that the blood banks are clustered currently based on the district they belong to and no other valid logic was used to define those clusters.
Further research can be focused to develop algorithms for scheduling donors. A database should be maintained for existing and potential donors and it is needed to develop algorithms for scheduling those donors based on the requirements of each day. Therefore many of the practical issues can be overcome by developing a web based management information system incorporating our proposed algorithm. This would enable the staff of the blood bank to find out when there is a scarcity or excess of blood. According to the need the registered donors can be informed in advance and manage the blood supply chain smoothly and effectively. Therefore the wastages and shortages of the blood component can be reduced further.
- Prastacos, G., Blood Inventory Management: An overview of theory and practice, Management Science, vol. 30, pp. 777-800, 1984.
- Nahmias, S., Perishable inventory theory: An overview, Operations Research, vol. 30, pp. 680-708, 1982.
- Brandeau, M.L., Sainfort, F. and Pierskalla W.P., Supply chain management of blood banks in Operations research and health care, Boston: Kluwer Academic Publishers, pp. 103 – 145, 2004.
- Kern, D.A. and Bennett, S.T., Informatics applications in blood banking, Clinics in Laboratory Medicine, vol. 16, pp. 947-960, 1996.
- Or, I. and Pierskalla W.P., A transportation location – allocation model for regional blood banking, AIIE Transactions, vol. 11, no. 2, pp. 86 – 94, 1979.
- Blake, J.T., Thompson, S., Smith, S., Anderson, D., Arellano, R. and Bernard, D., Optimizing the platelet supply chain in Nova Scotia, in Proceedings of 29th meeting of the EURO Working Group on Operational Research Applied to Health Services, Prague, Czech Republic, pp. 47 – 65, July 27 – August 1, 2003.
- Katsaliaki K. and Brailsford S.C., Using simulation to improve the blood supply chain, Journal of the Operational Research Society, vol. 58, pp. 219-227, 2007.
- Jovanovic, R., Delic, M., Kamberovic, B., Vulanovic, S. and Radlovacki, V., Planning the use of lean six sigma as a framework for blood bank management improvements, International Journal of Industrial Engineering and Management, vol. 4, no. 4, pp. 237-244, 2013.