Deep venous thrombus characterization: ultrasonography, elastography and scattering operator
Deep venous thrombus characterization: ultrasonography, elastography and scattering operator
Volume 2, Issue 3, Page No 48-59, 2017
Author’s Name: Thibaud Berthomiera),1,2,3, Ali Mansour1, Luc Bressollette2, Frédéric Le Roy1, Dominique Mottier2,3
View Affiliations
1LABSTICC (UMR 6285), ENSTA Bretagne, 2 rue François Verny, 29806 Brest Cedex, France
2 EA 3878 (GETBO), CIC Inserm 1412, CHU de la Cavale Blanche, Bld Tanguy Prigent, 29609 Brest Cedex, France
3F-CRIN INNOVTE, CIC Inserm 1408, CHU Saint-Etienne, 42055 Cedex 2, France
a)Author to whom correspondence should be addressed. E-mail: thibaud.berthomier@ensta-bretagne.org
Adv. Sci. Technol. Eng. Syst. J. 2(3), 48-59 (2017); ![]() DOI: 10.25046/aj020308
DOI: 10.25046/aj020308
Keywords: Deep Venous Thrombosis, Thrombus, Ultrasonography, Elastography, Image preprocessing, Scattering Operator, Wavelets, Feature Extraction

Export Citations
A thrombus or a blood clot is the result of blood coagulation which is a natural process to prevent bleeding. An inappropriate formation of a thrombus in a deep vein is known as Deep Venous Thrombosis (DVT). The main complication of a DVT is a Pulmonary Embolism (PE) which occurs when a thrombus breaks loose and travels to the lungs. DVT, PE, or both are also known as Venous thromboembolism (VTE). It affects an estimated 300,000–600,000 Individuals just in the United States per year and can cause considerable morbidity and mortality. This multifactorial disease related to advanced age, immobility, surgery or obesity is an important public health issue. Our project is looking to link the VTE epidemiology (risk factors, patient history, PE) to the thrombus structure. To reach our goals, we are collecting ultrasonography (echogenicity) and elastography (stiffness) of human thrombus. This manuscript describes our approach to create and preprocess a database using Toshiba Aplio 500. Our approaches to characterize the thrombus structure with ultrasound images are also described. The feature extraction is made with the scattering operator. Obtained features are then reduced using Principal Component Analysis and are analyzed to evaluate our approach.
Received: 05 March 2017, Accepted: 20 March 2017, Published Online: 05 April 2017
1. Introduction
This manuscript is an extension of two conference papers presented at 2016 2nd International Conference on Frontiers of Signal Processing [1, 2]. Deep Venous Thrombosis (DVT) is an outcome of an incongruous blood clot in a deep venous network. Due to the clot, the blood flow is slowed or stopped in the affected vessel. Therefore, the remaining blood finds its way back to the heart through the superficial network. This situation can oftenly occur in leg vessels and it may lead to warm, swelling, pain or edema of the affected leg. DVT is a serious disease and has to be treated as soon as possible to avoid the blood clot extent and irreparable damage to the veins. Moreover, it may also have deadly consequences when a clot fragment breaks off, travels to the lung and causes a Pulmonary Embolism (PE). Without an urgent care, a DVT has about a 50% risk of leading to a PE [3]. DVT has multifactorial causes: immobilization, surgery, age, cancers, genetic variations; and it is mostly diagnosed via ultrasound. More precisions on blood clot formation and risk factors are provided in section 2.
Our project is aiming to relate the blood clot structure to its age, its formation cause and PE risk. Ultimately that can lead us to the detection of a cancer in an early stage. Section 2 presents the imaging techniques – ultrasonography and elastography – and our acquisition system. Section 3 describes our databases get with Toshiba Aplio 500 and the preprocessing steps. Section 4 proposes a wavelet-based feature extraction algorithm, the scattering operator [4]. Finally, major energetic relevant features have been selected using Principal Component Analysis.
2. Background and Key issues
Here in after, our project on Deep Venous Thrombosis is described. Subsection 2.1 describes a blood clot and its major risk factors. Subsection 2.2 summarizes the state of art and describes the main imaging techniques. Subsection 2.3 outlines technical issues related to our acquisition process.
2.1. Medical Background
2.1.1. Blood circulation and coagulation
Blood flows one-way through the body [5]: the arteries (in red on Figure 1) distribute oxygenated blood from the heart to various organs and muscles. Veins (in blue on Figure 1) have thinner and elastic walls and take over from arteries to return back oxygen impoverished blood to the heart. The blood cycle is performed using: (a) Heartbeat to maintain a continuous flow, (b) Diaphragmatic or deep breathing, (c) Muscle pump system (calf muscular contraction) and (d) Venous pump of the foot which is a major factor in blood return activated by walking. Moreover, veins include a valve system to avoid blood reflux. Prolonged immobilization due to plaster cast, bed rest or long distance flights slow down blood circulation and raise the risk of a venous thrombosis.
The physiological process to keep blood within veins and stop bleeding in case of injuries is called hemostasis [6]. Hemostasis involves vascular spasm (reduction of the damaged vessel diameter) and coagulation which change the liquid blood to a gel. The mechanism of coagulation includes: activation, adhesion, and aggregation of platelets along with deposition and maturation of fibrin. When a broken vessel is cared, a process named fibrinolysis starts dissolving the clot and prevents it from growing and causing thrombosis. Hemostasis or fibrinolysis disorder is indeed one of the risk factors for venous thrombosis.
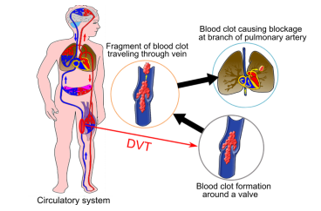
Figure 1: Deep Venous Thrombosis and its major complication, Pulmonary Embolism.
2.1.2. Thrombosis, symptoms and treatment
Thrombosis occurs when an abnormal blood clot is formed and/or when the fibrinolysis process becomes deficient. Thrombosis symptoms are an inflammation of a stamped or obstructed vessel [5], most commonly in the lower extremities. Superficial thromboses occur in the veins near the skin and usually don’t cause fever, infection or swelling. On the contrary, DVT are very dangerous because a piece of the clot can break off, be carried by the blood to the lung and cause a PE, as seen in Figure 1.
The clot formation often begins in the calf veins, where the blood flow may slow down (valves, collateral veins) and extends to the knee or thigh veins [6]. The risk of a PE increases when the clot gets closer to the heart. When a deep vein is obstructed by a clot, the blood cannot flow anymore back to the heart through this vein; this creates a hypertension upstream part of the clot, therefore the blood finds another way through the superficial venous network.
Many cases are asymptomatic and resolve spontaneously. Otherwise, DVT can be revealed by three main signs: swelling of the calf or the ankle, leg warm to the touch and leg pain or tenderness. The patient could also have numbing, cramps, a sensation of heavy legs, pain on palpation and/or bluish skin discoloration. At a confirmed stage, DVT may go along with fever, edema, ulcer, tachycardia or even a complete functional impotence [6]. Asymptomatic DVT is about 5 to 20 times more common than symptomatic events [3]. Moreover, relapse is frequent and the patient can have post-thrombotic symptoms, i.e. long-term complications.
DVT treatment aims to prevent the clot from getting any bigger or breaking loose and causing a pulmonary embolism. In general, the anticoagulant drugs decrease the blood’s ability to form a clot but they don’t break up existing blood clots (to avoid a PE). The blood clot will be naturally destroyed by the body (fibrinolysis). Later on, physicians should treat the patient to reduce the risk of new thrombosis.
2.1.3. Epidemiology
Normally in our blood circulation system, there is a trade-off between coagulant and anticoagulant molecules. Many physiopathological mechanisms can unbalance the fragile trade-off and create a venous thrombosis. Virchow’s triad [7] for thrombus formation is:
(a) Venous stasis,
(b) Endothelial injury,
(c) Hypercoagulable state.
Venous stasis gathers all factors responsible for the blood slow down: extended immobilization (bed rest, labor, and plaster cast), heart failure, varicose vein and venous constriction (prolonged sitting, long distance flight, cancer). For instance, statistics on venous thrombosis showed an incidence of two to four per ten thousand passengers of a flight over five hours [8]. Smoking also increases the risk as it stimulates the production of fibrinogen in the blood (and hence platelet aggregation and coagulation) and generates more viscous blood.
Endothelial injury brings factors degrading the venous walls. Therefore, an inflammation caused by an infection (related to surgery, catheter, traumatism and age) can produce a thrombosis. According to [8], statistics show that the risks, without preventive thrombosis in medicine, increase in the range of ten to twenty percent in the four to five weeks following a hospital discharge. In the same way, risks become twice larger every ten years after the age of 40.
Hypercoagulability incorporates all mechanisms reinforcing coagulation or disturbing anticoagulation. It can be acquired factors (such as pregnancy, hormone therapy, and cancer), inflammatory disorders or inherited factors (Factor V Leiden mutation, protein C or S deficiency, antithrombin deficiency). Pregnant women or people with hormonal treatment have two to five times more likely to develop a DVT [8].
2.1.4. Diagnosis and imaging techniques
An untreated DVT in the calf has about a 25% risk of extending and reaching the proximal veins (popliteal, femoral, or iliac) [3]. As well, half of untreated proximal DVT will lead to a PE. To reduce the risk of a long term complication (e.g. damage of venous valves and wall) and PE, it is vital to diagnose as soon as possible the DVT. However, this task seems to be difficult because the signs and symptoms associated with the DTV are not specific to this disease [6]. A blood test can exclude thromboembolic disease where the DVT probability is low. This test is based on the concentration of D-Dimers (i.e. fibrin degradation products) which are present in the blood when the coagulation system is activated. Nevertheless, a positive test does not always indicate thrombosis.
Imaging studies of the venous blood network are needed for diagnosis. Duplex ultrasonography is the standard imaging process. Physicians view the blood network and flow, and check on the veins’ compressibility. A vein with a blood clot is relatively incompressible and is more echogenic than a free vein. Contrast venography is a gold standard but it is rarely used because its invasiveness [9]. Magnetic Resonance Angiography (MRA) and Computed Tomography Angiography (CTA) are rarely used: they are costlier and less than ultrasonography which is mostly sufficient to diagnose a DVT. In the event of a PE suspicion, CTA is the standard procedure.
2.2. Medical issues
2.2.1. Venous thrombus characterization
DVT is a multifactorial disease which can cause serious and irremediable health problems. Its early detection would limit the risk. Since this disease is often asymptomatic, prevention measures and surveillance might be used before and after any procedure or event that can increase the risk of a DVT. In case of doubt, the detection using ultrasound is relatively simple. Yet it is a lot more difficult to identify the thrombosis origins, age and to estimate the risk of PE. Thus, the objective of our project is to analyze the blood clot structure with the help of ultrasonography and elastography techniques in order to estimate the age, the origins and the risk of a PE. Elastography is an imaging technique, based on ultrasound, used with success to analyze human tissue stiffness (e.g. liver fibrosis detection).
In the literature, there are studies linking thrombosis maturity to the clot elasticity ([10, 11]), determining the impact of genetic variations on the onset of a DVT ([12, 13]) or estimating treatment efficiency ([14, 15]). But, currently, there is a little or no convincing evidence that there is a correlation between the blood clot structure and its triggering factors, hence making our research even more challenging. To characterize thrombi, in vivo data are collected thanks to Brest University Hospital. The following two subsections will respectively describe ultrasonography and elastography. In biomedical Engineering, these two techniques are widely studied in various research projects. In particular, the authors of [16] publish an instructive survey titled “Automated breast cancer detection and classification using ultrasound images”. The recent and promising imaging technique, elastography, is mainly considered for detection and characterization of several tissues, such as liver [17], breast [18, 19] and thyroid [20, 21]. The tissue shiftiness is indeed a valuable source of information to diagnose diseases.
2.2.2. Ultrasonography
Ultrasonography (or Brightness-mode with 2-dimension imaging – B-mode 2D) is the default and the most intuitive mode: it is a 2-dimensional cross sectional view of the portions of the organs or the tissues that are intersected by the scanning plane. The shape of the field (sector, rectangular or trapezoid) depends on the used probes. The chosen probe to perform venous examination is a 5-10 MHz linear probe. On a gray scale, high reflectivity (as tissue) is colored white and for no reflection (as blood) is colored black. Two ultrasound imaging findings can point out the presence of a blood clot in a vein: the relative incompressibility of the vein and an echogenic intraluminal material [22].
In most case, the blood clot is echogenic (see Figure 2). At the beginning of a DVT episode (in the first hours or days), the clot is hypoechoic, homogeneous, elastic and it dilates the vein. On the contrary, an older clot (several weeks) becomes slowly more heterogeneous, harder and smaller. The clot echogenicity actually depends on its blood cell composition, distribution and on its fibrin mesh [23]. The incompressibility of the vein during the ultrasound test is considered as the main detection criterion of a DVT. Conversely, using the adjacent artery as a reference point, the full compression of the vein with a minimal deformation of the artery indicates an absence of thrombosis. Moreover, the vascular paresis (fixity of the venous valves) can indicate the presence of a blood clot as well.
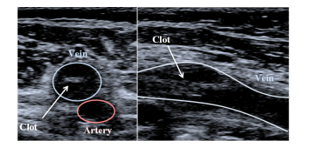
Figure 2: Transverse (left) and longitudinal (right) ultrasonographies of a blood clot in the femoral vein (Images obtained with Toshiba Aplio 500).
2.2.3. A new approach: elastography
Elastography consists in mapping the hardness, or the elasticity, of human tissues, e.g. their resistance when a mechanical force is applied on it: the harder a tissue is, the more elastic it is. A static external stress (in pascal Pa), applied to the surface of a solid, is linearly proportional to its fractional extension (non-dimensional) by the modulus of elasticity (in Pa). This principle is named Hooke’s law [24]:![]()
Human soft tissues can distort under the influence of two types of mechanical waves: compressional and shear waves. Compressional waves are also called longitudinal waves because the particle displacement is parallel to the direction of wave propagation. As well, shear waves are named transverse waves because, this time, the particle displacement is perpendicular to the direction of the wave propagation.
The velocity of these waves is directly connected to the elastic modulus (or Young’s modulus). In soft biological tissues [24], the compressional velocity is much higher (≈ 1500 m/s) than the shear wave velocity (≈ 10 m/s), so the Young’s modulus can be approximated using the following equation:![]()
where is the volume density (kg/m3) and the shear wave velocity (m/s). The volume density is assumed to be constant (1000 kg/m3 which is the water density) even if it is actually different from one tissue to another (fat ≈ 950 kg/m3, blood ≈ 1025 kg/m3, liver ≈ 1060 kg/m3, muscle ≈ 1070 kg/m3 and bone between 1380 kg/m3 and 1810 kg/m3 [25]).
Elastography systems do not measure directly the hardness of the human tissue but estimate the velocity of the shear waves. These systems send either a mechanical or an acoustic impulse to generate the shear waves and follow their propagation using ultrasound, i.e. compressional waves. Ultrasonic echoes are analyzed in order to determine the velocity of the shear waves, and hence the elasticity, using equation (2).
2.2.4. Elastography and venous blood clot
In the medical context, the main application is the diagnosis of hepatic fibrosis because the liver gets harder when the fibrosis gets more severe. In old days, palpation was used to estimate the hardness. Recently, several systems can precisely measure and create a map of the organ hardness (elastography). In theory, the blood clot hardness (and hence elasticity) should increase with age thank to the loaded fibrin. The exact age of the thrombus can help determining the right treatment (anticoagulant, surgery). Several studies ([11, 26]) create an animal model to estimate the exact age of the venous thrombus in vivo using ultrasound elastography. On human patients, the treatment efficiency makes the experiment more difficult. However, for some patients still presenting a DVT after three months, the results show a correlation between the shear wave velocity measures and the age of the thrombus [27]. Furthermore, our project aims to characterize the thrombus structure by analyze his stiffness using elastography.
2.3. Technical issues
2.3.1. Acquisition system: Toshiba Aplio 500
Our research project is currently focused on ultrasonography and elastography to characterize the blood clot structures and emphasize the existing links to the patients’ physiopathologies. Elastography is a recent imaging technique (about 10 to 20 years) but it becomes inescapable for biomedical manufacturers as it has been introduced in several systems: Toshiba (Aplio 500), Echosens (FIbroscan), Siemens (Acuson S3000), Supersonic Imagine (Aixplorer), Philips (Epiq), Hitachi Aloka (Arietta), General Electric (Ultrasonix, Logic SonixTouch), Esaote (MyLabEight).
At Brest Hospital, Toshiba Aplio 500 machines are used to diagnose DVT with ultrasonography and to practice elastography. This section describes our acquisition systems, the used procedure and relative data. Toshiba Aplio 500 delivers high resolution clinical images to help a physician making quick and reliable diagnostic [28]. As said before, the system provides both modes ultrasonography and elastography.
Three types of 2D-ultrasonography are available:
- Classic Brightness-mode ( paragraph 2.2.2 or fundamental ultrasound imaging: the probe transmits an impulsion at a certain frequency and measures echoes reflected by the different interaction with the medium. The system then interprets the echoes at the selected frequency to build the image.
- Tissue Harmonic Imaging (THI): the image is produced using higher harmonics. These harmonics are generated by the nonlinear propagation of the ultrasound beam through tissues. THI has a better lateral resolution and a better signal-to-noise ratio.
- Differential Tissue Harmonic Imaging (DTHI): Toshiba develops a new nonlinear sonographic imaging technique where a dual-frequency and is transmitted, then the system analyzes the echoes of the difference and the second harmonic of . DTHI can combine the advantages of fundamental and THI modes.
In the Shear Wave Elastography (SWE) mode, three display modes are available on Toshiba’s system (see Figure 3):
- Shear velocity named speed mode (m/s),
- Modulus of elasticity named elasticity mode (kPa),
- Propagation mode.
The relationship between shear velocity (m/s) and modulus of elasticity is given by equation (2).
The speed or the elasticity modes provides a quantitative measure and a dynamic visual display of tissue stiffness. The propagation mode displays the shear wave propagation through the tissue in a single image. This mode is useful to determine the data reliability, see Figure 4. If the shear waves, lines, are parallel, the reliability in this area becomes high. In contrast, distorted and non-paralleled shear waves correspond to a low reliability.
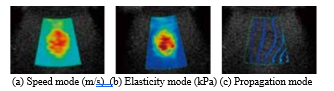
Figure 3: Three display modes: shear wave velocity (speed mode), modulus of elasticity (elasticity mode) and propagation mode [29].
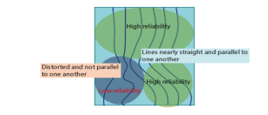
Figure 4: Reliability of the propagation display [29].
Previously, the used probe is primarily intended to observe the organs and their structures within the abdomen. That probe allowed us to use elastography which greatly helps to diagnose a liver or a pancreas fibrosis. Our ultrasound echo signals are acquired using a convex array ultrasound transducer (Toshiba PVT-375BT). With a variable carrier frequency in 1.5 to 6 MHz, the venous network can be observed in a depth of 0 up to 10 cm.
Since June 2016, the Toshiba Aplio 500 has been updated by a new probe: PWT-1005BT. This Linear Array Probe has a frequency range [5, 14] MHz and is intended, in particular, to small-part imaging. The update and the new probe have improved the imaging quality of our acquisition. However, we ended up by having two distinct databases for feature extraction and classification. Next two subsections describe the acquisition procedure and the data
2.3.2. Data acquisition process with Toshiba Aplio500
In case of DVT suspicion, the medical expert locates the blood clot head using compression ultrasonography. During the diagnosis, the patient lies on his back. Then, the physician switches to the SWE mode and selects a Region Of Interest (ROI). A part of the tissue is deformed by the shear wave. For an existing obstacle (such as a tumor in the tissue or a clot in a vein), the shear wave velocity in that area should be different from the velocity of surrounded areas. A softer obstacle slows down the shear waves as opposed to a stiffer obstacle which makes them faster.
The system displays the elastography on the left side of the screen and the ultrasonography on the right side, see Figure 5. Later on, physicians select a shape (an ellipse or another shape) around the blood clot on the ultrasound image. Then, the system returns the shear wave velocities in this area and displays the mean and the standard deviation values at the bottom of the screen, see Figure 5. After checking the data reliability, several screenshots are made and added to our database.
Previously, and in order to reduce human error (e.g. probe pressure on the skin, localization), two experts make 10 measures, each patient. For each patient, a second check-up should be made three months later. In most cases, the treatment dissolves the blood clot but new measurements are performed again. The new system limits operator errors and makes elastographies more stable. Moreover, previously, the blood clot was only analyzed in a transverse view. However, a longitudinal observation is also considered, as shown in Figure 2 or Figure 5.
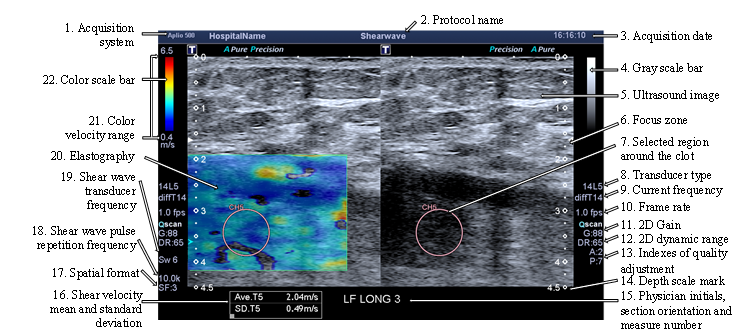
Figure 5: Image exported from Toshiba Aplio 500 and composed of the elastography and ultrasound images; the measurement parameters, the mean and the standard deviation of the shear wave velocity are displayed on the border of the image.
2.3.3. Data description
The data are exported from Aplio 500 in a format named Digital Imaging and COmmunication in Medicine (DICOM). This is a standard for handling, storing, and transmitting medical imaging information and related data. A DICOM file contains a certain number of attributes (metadata such as name, age, etc.) and also one special attribute containing the image pixel data (ultrasonography, X-rays, MRA, CTA, etc.).
In our case, the image data is a color screenshot as shown in Figure 5 which contains different information: the acquisition parameters (system, probes, and date), the patient’s name (erased here for medical secrecy), the ultrasound image, the elastography, the elliptical ROI selected by an expert and the shear wave velocity in this area. Raw images can’t be provided with Toshiba’s system. For this reason, the ultrasonography and the elastography have to be extracted from the screenshot and then preprocessed.
The metadata provides us information about the patient (name, age, and gender), some acquisition parameters (e.g. probes, emitted frequency) and the images (size, depth). It is worth mentioning that in our data, the DICOM files do not contain any information about the shear wave velocity. Indeed, this information should be recovered from the image data. Thus, a Human Computer Interaction (HCI) is created and described in the next section.
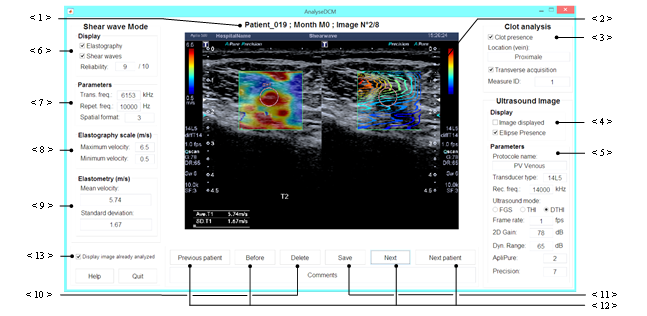
Figure 6: HCI of our application to manually extract information from the DICOM files exported from Toshiba Aplio 500.
3. Database and preprocessing
Previous sections explain the major goal of our project in the characterization of the blood clot structure in order to identify the DVT main triggering factor. To do this, two databases (before and after the updating of the system update) composed of ultrasonography and elastography in DICOM format are built. This current section describes the used process to prepare our data for further image processing (feature extraction and classification).
3.1. Data analysis using a Human Computer Interaction
The first step of the process is to read the DICOM file which is composed of metadata and an image. This image contains mostly two parts (mainly ultrasonography and elastography), the acquisition parameters and the elastometry values. Moreover, the patient physiopathologies and the presence of PE are collected in a spreadsheet enclosed with the database. To gather all those data in a single file, to identify the type of each part of the image and to recover the information unavailable in the metadata, a HCI is built. Our application browses through all DICOM files and is illustrated in Figure 6.
The DICOM image is displayed on the middle of the HCI (the < 2 > pointer of Figure 6). The patient’s number, the month (approximation of clot age) and the image number are indicated just above the image (the < 1 > pointer of Figure 6). The right fields of the HCI are related to the global acquisition information and the ultrasonography. The user notices the acquisition orientation (transverse or longitudinal) and the thrombus presence in the two checkboxes (the < 3 > pointer of Figure 6). Since there can be several screenshots for one acquisition (with or without ellipse, shear wave propagation), the acquisition ID (or measure ID) should be specified too. The location of the clot is extracted from the spreadsheet. The two checkboxes indicated by the < 4 > pointer of Figure 6 have to be checked if the image contains an ultrasonography part and an ellipse around the clot. The different fields, indicated by the < 5 > pointer of Figure 6, correspond to the ultrasonography parameters (8. to 13. pointers of Figure 5) and they will be useful to evaluate the impacts of these parameters on our future simulations.
The left part of the HCI is dedicated to the shear wave elastography mode. In the box indicated by the < 6 > pointer of Figure 6, the user can indicate if the image displays the elastography or the shear wave propagation (see Figure 3). He can also estimate the reliability of the acquisition. The shear wave parameters (18. to 20. pointers of Figure 5) are entered fields indicated by the < 7 >pointer of Figure 6. The four next fields (< 8 > and < 9 > pointers of Figure 6) allow the user to enter the color range (the 19. pointer of Figure 5), the means and the standard deviation of the shear wave velocity (the 16. pointer of Figure 5).
Furthermore, the user can delete or save changes using the dedicated buttons (the < 10 > or < 11 > pointer of Figure 6). The image is then converted in the bitmap format (‘.bmp’). The recovered information and the metadata are stored in a file. The navigation between the patient’s DICOM files is made using the buttons ‘Previous patient’, ‘Next patient’, ‘Before’ and ‘Next’ (the < 12 > pointer of Figure 6). The already exported files can be skipped by checking the checkbox indicated by the <13> pointer of Figure 6.
3.2. Image extraction and sorting by type
DICOM image contains two parts among elastography, ultrasonography and shear waves propagation. This paragraph explains how these two parts are isolated and how the depth resolution is estimated. The boundaries of each part can be estimated using the metadata. The depth resolution is not contained in the metadata so the depth scale marks are segmented to estimate it (see tag 14. in Figure 5). These marks have a special pixel color whose value is used for the segmentation. Some marks are not filled. After filling them, an erosion removes the isolated pixels (pixel of the ultrasound image with the same color as the marks). Then, the middle mark indexes are calculated, the number of marks is counted and the depth resolution is estimated. The both extracted images are finally cropped so that neither scale mark nor a black border is present on these images.
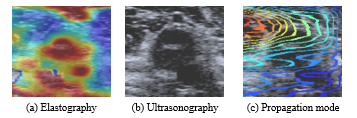
Figure 7: Images extracted from a transverse acquisition: a DICOM file of this acquisition is display in Figure 6 (images get with Toshiba Aplio 500).
Moreover, for a single acquisition, there could be several DICOM files so our program gathers all files with the same measure ID. Each extracted image is store in the main file and its fieldname is defined by the image type and the ellipse presence. Until all file with the same ID are browsed, the images, if wanted by the user, are cropped to the elastography size. An example is shown in Figure 7.
3.3. Image preprocessing
3.3.1. Elastography
As you can see in Figure 8 (a), the elastography is a RGB map superimposed on the ultrasonography. For further analyses, the ultrasonography has to be removed and RGB colors have to be converted into velocities using the color scale displayed on main image (see Figure 6). Depending on the acquisition parameters, the transparency coefficient is either 0 or 0.5. The RGB map can be computed from the elastography and the ultrasonography with the following equation:![]()
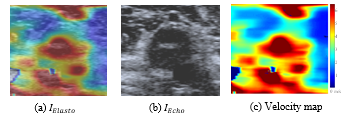
Figure 8: Estimation of the velocity map from the ultrasonography and the elastography (images get with Toshiba Aplio 500).
Then, each pixel of the RGB map is compared with color scale to obtain its velocity value. The final velocity map (see Figure 8 (c)) is stored in the main file.
3.3.2. Ultrasonography
During the medical examination, the physician often needs to adjust some parameters to observe the blood clot. Before the system update, most ultrasonographies were acquired with the THI mode at the frequency 5MHz (setup A). After the system update, the Differential THI is preferred and there are two main setups: one with a 10MHz frequency (setup B) and another with 14MHz (setup C). Whatever the setup, the most changing parameter is still the gain which essentially affects the contrast and the brightness. To standardize our acquisition for each setup, this manuscript proposes the equalization of obtained histograms with the two following methods: ordinary Histogram Equalization (HE) and Contrast-Limited Adaptive Histogram Equalization (CLAHE) [30].
HE improves the contrast globally by adjusting intensity values. This process uses the same transformation derived from the image histogram to transform all pixels. The transformation function is proportional to the cumulative distribution function of pixel values. This works well when the distribution of intensity values is similar throughout the image. However, when the image contains regions that are significantly lighter or darker than most of the image, the contrast in those regions will not be sufficiently enhanced. In our images, the blood clot is mostly darker than the surrounding tissues so the contrast inside the blood clot may not be improved.
For improving the local contrast and enhancing the definitions of edges in each region of an image, HE can be applied over each region of the image with a transformation function derived from their neighbor pixels. This method is called Adaptive Histogram Equalization (AHE) and a major drawback concerning the overamplifying small amounts of noise in largely homogeneous regions of the image. This noise problem can be reduced by limiting contrast enhancement specifically in homogenous areas characterized by a high peak in the associated histogram because many pixels will be inside the same gray range.
With CLAHE, the slope associated with the gray level assignment function is limited by a threshold. The main disadvantage of CLAHE is that the ratio between the gray values of the original images and those of the resulted image is not
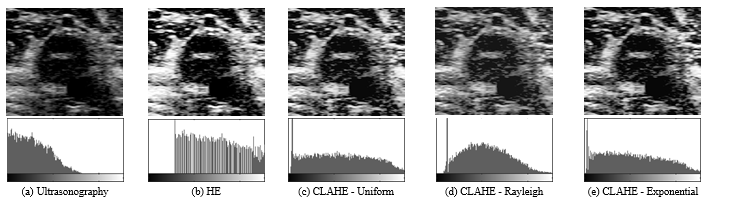
Figure 9: Ultrasonography contrast enhancement of an image (get with Toshiba Aplio 500) (a) using respectively ordinary Histogram Equalization (HE (b) and Contrast Limited Adaptive HE (CLAHE with uniform- (c), Rayleigh- (d) and Exponential- (e) distribution functions.
constant, so CLAHE images are not suited for quantitative measurements. Figure 13 compares HE and CLAHE for a blood clot image. In this example, CLAHE methods give better results but it is hard to choose the best distribution function (uniform, Rayleigh or exponential) for CLAHE.
3.4. Blood clot for image extraction
To characterize the blood clot structure and identify the thrombosis triggering factors, hereinafter the scattering operator[1] is applied on the ultrasonographies containing a blood clot. To simplify and reduce the computing effort of the scattering operator, these extracted images should be squares and have a size of 2. The next paragraphs explain our strategy to create our database composed of blood clot resized square images
3.4.1. Blood clot localization
During the acquisition, the physician draws an ellipse to emphasize a blood clot. In the longitudinal observation, several ellipses can be drawn on different areas of the blood clot (see Figure 10 2.). For the structure characterization, the inside of the ellipse is analyzed using image processing. An image mask is created by exploiting the special color of the ellipses. Segmentation at this specific pixel color is made either on the ultrasonography (if available) or on the elastography. Therefore, the segmentation followed by a filing operation give the ellipse mask.
Sometimes, the ellipses are truncated (because of the previous cropping) or their edges are not closed. Thus, a validation step, either manual (display of the result and dialogbox) or automatic (based on the ellipse area), checks if the ellipses are well-segmented. Otherwise, their edges are closed and filled. This procedure can be repeated if necessary. Then, with an image processing toolbox, the ellipses are labelled (see Figure 10) and their properties estimated: area, centroid O, orientation α, major a and minor b axes (see Figure 12). Finally, this information is stored in the main acquisition file.
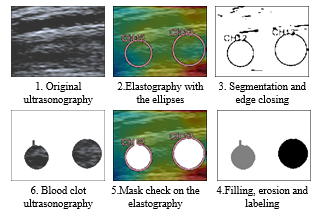
Figure 10: Segmentation of the ellipses, creation of their mask and extraction of their position (Ultrasonography and elastography get with Toshiba Aplio 500).
3.4.2. Image extraction
At first, the blood clot image was identified as the biggest square inside an ellipse, as shown in Figure 11. This approach includes a rotation if the ellipse and the image have not the same orientation.
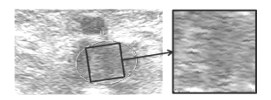
Figure 11: Extraction of the largest square inside an ellipse on an ultrasound image: the rotation distorts the image.
To avoid the artefacts generated by this rotation, this manuscript suggests to not rotate the global image and to find the biggest square in the image orthonormal system. Figure 12 and Figure 13 illustrate this idea, the different variables and the results without artefacts. The width c is computed using the following system:
where and
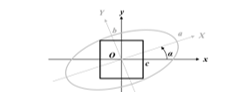
Figure 12: Extraction of the largest square inside an oriented ellipse.
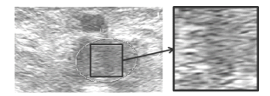
Figure 13: The extracted image is smaller with this second method but there is no artefact.
3.4.3. Image resizing
The size of the square differs according to the patient (its anatomy), the clot age, its size and its localization (vein). To compare their scattering transform, the images need to have the same size. The simulations were made with two different sizes (64×64 and 128×128 pixels) and four resizing methods: nearest neighbor interpolation [31], bicubic interpolation [31] and zero padding in the Fourier or in the cosine representation. If the goal size is relatively close of the original size, these four methods give very similar results. In the next section, the scattering operator is applied on 64×64 images resized with zero padding in cosine transform.
4. Feature extraction and classification
Previous sections describe the background of our project and the collection mechanisms of our data. This section presents our way to characterize thrombi structures with ultrasound images. The exposed simulations are made with our first database (about 200 images for 12 patients). The blood clot will be characterized with features extracted by applying an algorithm named scattering operator [4]. This technique is based on wavelet transforms and detailed in the subsection 4.1.
This project intends to correlate the images features and the Venous ThromboEmbolism (VTE) epidemiology (Risk factors, history of DVT, and presence of EP). Principal Component Analysis (PCA) is used to reduce the important size of the scattering features. Simulation results are presented in the subsection 4.2.
4.1. Feature extraction using the Scattering Operator
The challenge of automatically classify images resides in the high variability within a same class. This variability is often uninformative in the sense that it does not characterize a class change. The scattering operator aims at reducing this variability by creating a “translation invariant image representation, which is stable to deformations and preserves high frequency information for classification” [4].
4.1.1. Scattering wavelets
The scattering operator combines three three types of operations: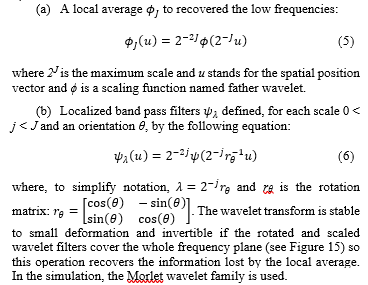
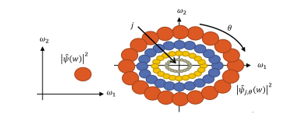
Figure 14: Frequency support of the mother wavelet on the left side and of the child wavelets on the right side: ? is the Fourier transform of ?
A non-linear operator to contract the space and move the energy to the low frequencies which is the modulus (see Figure 15).
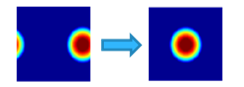
Figure 15: Frequency support (threshold at -3dB) of a localize pass band filter before (left) end after (right) the application of the modulus.
4.1.2. Scattering transform
The first step to compute the scattering transform S of an image x consists in applying the average filter on the image x:![]()
To recover the high-frequency information lost by this operation, localized band pass filters are applied. Then, that information is extracted with a modulus and a low pass filter again:![]() defines the first layer of the scattering transform S. To recover the high frequency information lost during the average operations is applied localized band pass filters to construct the second layer of S:
defines the first layer of the scattering transform S. To recover the high frequency information lost during the average operations is applied localized band pass filters to construct the second layer of S: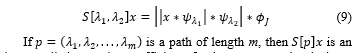
image called scattering coefficient of order m computed at the layer m of the scattering network (see Figure 16). For a large invariant representation, several layers are necessary to avoid losing crucial information. The number of rotations, scales and layers are key parameters of the scattering transform and need to be optimized.
Finally, each ultrasound image will be represented by the norm of each image of the scattering transform. The norm forms a crude signal representation which measures the scarcity of the wavelet coefficients and is defined by:![]()
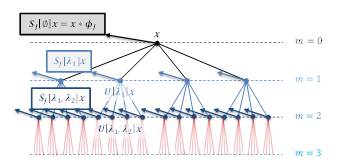
Figure 16: The scattering operator computed the first layer of wavelet coefficients modulus and its local average S_J [∅]x (black arrows). Then, the process is applied again on each wavelet coefficients modulus to forms the second layer of coefficients S[λ1]x (blue arrows). This process is repeated until the desired layer m is reached.
4.1.3. Feature reduction using Principal Component Analysis
In [1], the Euclidean distance among the scattering coefficients of a referent image and those of all the images of the database is computed. This simple comparison method seems to be irrelevant to enhance the correlation between the scattering coefficients and the VTE epidemiology. For this reason, this manuscript proposes to reduce the number of the scattering coefficients and to retain part of the information. Principal Component Analysis [4] is widely used to reduce the dimension of observed vectors. PCA, a linear orthogonal transformation, aims to convert a set of observations of possibly correlated variables into a set of linearly uncorrelated variables called principal components.
Let be the number of the scattering feature. Firstly, the data are centered around the origin by subtracting the mean of each variable from the dataset. PCA algorithm approximates the difference by projecting them in a linear space of lower dimension . Let stands for the linear space generated by the PCA eigenvectors of covariance matrix having the largest eigenvalues. Among all linear spaces of dimension , is the approximation space with the smallest expected quadratic error.
Finally, PCA is equivalent to approximating by its projection on an affine approximation space:![]()
This affine space selection is effective if is well approximated by a projection in a low-dimensional space. The scattering parameters (number of scales, orientations and layers) and the dimension must be adjusted so that has a better approximation in the affine space .
4.2. Simulations
4.2.1. Experimental process
Our databases are formed by three different categories: the old acquisition system, the new one with 10 MHz and 14 MHz. In this paper, the exposed simulations are made with the biggest possible database including ultrasound images get with exactly the same parameters. Indeed, the use of different presets can affect the scattering coefficients and biased our conclusions. Consequently, the test database contains about 200 images acquired with the older version of the system. Our main goal is to identify the main causes of the DVT and to evaluate the risk of a PE. Thus, the expected classes would include:
- Cancer
- Idiopathic: DVT with unknown pathogenesis of apparently spontaneous origin
- Idiopathic and PE
- Immobilization
- Pregnancy
- Surgery and PE
The scattering operator parameters (number of scales, orientations, layers and the size of the images) should be optimized. The optimization step is necessary; even though, there is no guarantee that it will lead to a satisfactory classification. We are not totally sure that the cause of the thrombosis and the presence of a PE are linked to the clot structure. In our simulations, our images are resized to 64 x 64 pixels because a power-of-2 square image reduces the calculation factor of the scattering operator. All coefficients are computed with the following parameters:
- Number of scales J: 2, 3, 4, 5, 6 and 7
- Number of orientations L: 1, 2, 4, 6 and 8.
The scattering energy has an exponential decay with respect to the order m [4]. Moreover, its energy converges to 0 as m increases and is below 1% when m ≥ 3. Therefore, all obtained coefficients (for all J and L) are neglected when m ≥ 3. To analyze the scattering feature for each order, each image will be represented by one vector per order (i.e. four vectors: orders m = 0, 1, 2 or m = 3). After that, the dimension of these four vectors is reduced using PCA. The affine approximation space will be projected in two dimensions: the two 2 best discriminant dimension among the three first principal components.
4.2.2. Results
Figure 17 shows the projection of the scattering features in two-dimension spaces. Figure 17 (a) considers coefficients at the order 0: the abscissa axis represents the first Principal Component (PC) and the ordinate axis the third PC (it is more discriminant than the second PC). The point cloud can be separate into four clusters:
- Cluster 1: some images of patient No .2 (immobilization.)
- Cluster 2: some images of patient No. 4 (idiopathic), patient No. 8 (idiopathic) and patient No. 19 (pregnancy);
- Cluster 3: patient No. 9 (surgery & EP)
- Cluster 4 (rest of the point cloud): No. 1, No. 10, No. 13, No. 15, No. 16, No. 17 and No. 18.7
However, it is difficult to link this observation with the main cause of the DVT. There is a pregnant woman in two clusters (No. 17 and No. 19). Idiopathic thromboses are also presented in the two clusters (cluster 1 and 4).
The points of patient No.2 show the impact of the acquisition conditions. Indeed, two levels can be easily distinguished. In fact, these images were taken by two different medical experts. To reduce the effect of the human factor, an articulated arm was used. We can notice as well that there are two levels for patient 19: the beginning of the DVT and three months later. The age of the blood clot seems to impact the scattering coefficients. Naturally, an old blood clot is stiffer, and thus more echogenic than a recent blood clot.
Moreover, the order 0 corresponds to low frequency information which greatly depends on the overall energy of the image. In order to characterize the clot structure, the higher scattering orders appear to be more appropriate. Nevertheless, looking at Figure 17 (b) to (d), the clusters observed at order 0 are less explicit. The scattering coefficients seem to give less information at the deeper order: order 2 (c) and order 3 (d) point clouds are very similar, so it is sufficient to explore until m=2. Finally, if orders 1 and 2 are represented on the same figure, then Figure 17 (e) and (f) show that order 2 do not add a lot of information comparing the order 1: Figure 17 (e) shows that the first PC of these orders are mostly correlated. As well, Figure 17 (c) and (f) are quite similar to Figure 17 (b).
These simulations did not reveal much about a correlation among the blood clot structure, the scattering coefficients and the VTE epidemiology. In our experimentations, we tried other metrics (e.g. Minkowski at different exponents), increased the size of the images (128×128 pixels) and applied the described contrast enhancement methods (HE and CLAHE). But, unfortunately, the new parameters do not improve our results.
5. Conclusion
Venous thromboembolism occurs with inappropriate blood clots, causing considerable morbidity and mortality in the world. It affects an estimated 300,000–600,000 individuals just in the United States per year [32]. The term venous thromboembolism includes both deep vein thrombosis, clots in the deep veins and
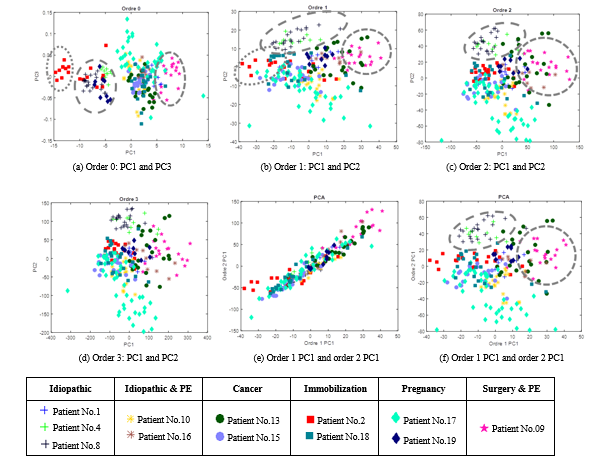
Figure 17: Projection of the scattering features in two-dimension spaces: (a) to (d) display the two best discriminants Principal Component (PC) at each order; (e) displays the first PC of the orders 1 and 2; (f) displays the first PC of the order 1 and the second PC of the order 2.
pulmonary embolism. Multiple factors can cause a venous thromboembolism: stasis, endothelial injury or/and hypercoagulability. Deep vein thrombosis is a common, serious and multifactorial disease. Our project aims at characterizing the blood clot structure in order to date it, explain its formation and estimate the risk of pulmonary embolism. Several techniques exist to analyze their structure: phlebography, magnetic resonance angiography, computed tomography angiography and ultrasonography. Ultrasonography and elastography have the advantage to be easy, repeatable, cheaper and non-invasive. This paper presents our approaches to generate databases using Toshiba Aplio 500. The outputs of Toshiba’s system are preprocessed images exported in the DICOM format. Therefore, a human computer interaction is created to read the output files, store the acquisition parameters and extract both the ultrasonography and the elastography.
After some preprocessing steps, the scattering operator is applied to the ultrasonography in order to characterize the blood clot structure. Our simulations show that the scattering operator seems to be not suitable for the clot characterization. In recent work, we compared the obtained results with respect to different image sizes, resizing methods and with histogram equalization (ordinary HE or CLAHE). Even doing the later procedures, similar results are obtained. Currently, we are working on spectral clustering because it gave positive results in prostate and brain MRI images [27, 28]. Moreover, we are looking to increase the size of our database and to standardize the acquisition procedure. In future work, we want to compare the results obtained with the scattering operator, spectral clustering and deep learning. The later approach is recently widely used and shows promising results in breast tumor elastography classification [19].
Conflict of Interest
The authors declare no conflict of interest.
Acknowledgment
This research project is supported by the Brittany region (Région Bretagne, France) and French Clinical Research Infrastructure Network on Venous Thrombo-Embolism (F-CRIN INNOVTE). We would like to acknowledge Brest University Hospital, ENSTA Bretagne and Toshiba for the material support. Finally, our thanks go out to all the people involved in our project and, particularly, to L.Fréchier and B.Hermenault.
- T. Berthomier, A. Mansour, L. Bressollette, F. Le Roy, and D. Mottier, “Venous blood clot structure characterization using scattering operator,” in 2016 2nd International Conference on Frontiers of Signal Processing (ICFSP), Warsaw, Poland, 2016, pp. 73–80.
- T. Berthomier, A. Mansour, L. Bressollette, F. Le Roy, and D. Mottier, “Deep Venous Thrombosis: Database creation and image preprocessing,” in 2016 2nd International Conference on Frontiers of Signal Processing (ICFSP), Warsaw, Poland, 2016, pp. 87–92.
- N. L. Reyes, S. D. Grosse, and A. M. Grant, “Deep vein thombosis & Pulmonary Embolism,” in CDC Health Information for International Travel 2016, Oxford University Press, Incorporated, 2015, pp. 132–135.
- J. Bruna and S. Mallat, “Invariant Scattering Convolution Networks,” IEEE Transactions on Pattern Analysis and Machine Intelligence, vol. 35, no. 8, pp. 1872–1886, Aug. 2013.
- A. M. N. Gardner and R. H. Fox, The Venous System in Health and Disease. IOS Press, 2001.
- R. W. Colman, Hemostasis and Thrombosis: Basic Principles and Clinical Practice. Lippincott Williams & Wilkins, 2006.
- C. N. Bagot and R. Arya, “Virchow and his triad: a question of attribution,” British Journal of Haematology, vol. 143, no. 2, pp. 180–190, Oct. 2008.
- P. Léger, D. Barcat, C. Boccalon, J. Guilloux, and H. Boccalon, “Thromboses veineuses des membres inférieurs et de la veine cave inférieure (article in French),” EMC – Cardiologie-Angéiologie, vol. 1, no. 1, pp. 80–96, Feb. 2004.
- J. P. Carpenter, G. A. Holland, R. A. Baum, R. S. Owen, J. T. Carpenter, and C. Cope, “Magnetic resonance venography for the detection of deep venous thrombosis: Comparison with contrast venography and duplex Doppler ultrasonography,” Journal of Vascular Surgery, vol. 18, no. 5, pp. 734–741, Nov. 1993.
- J.-L. Gennisson, S. Lerouge, and G. Cloutier, “Assessment by transient elastography of the viscoelastic properties of blood during clotting,” Ultrasound in Medicine & Biology, vol. 32, no. 10, pp. 1529–1537, Oct. 2006.
- B. Geier et al., “Ultrasound elastography for the age determination of venous thrombi. Evaluation in an animal model of venous thrombosis,” Journal of Thrombosis and Haemostasis, Jan. 2005.
- Smith NL et al., “Asociation of genetic variations with nonfatal venous thrombosis in postmenopausal women,” Journal of the American Medical Association, vol. 297, no. 5, pp. 489–498, Feb. 2007.
- F. Couturaud et al., “Factors that predict thrombosis in relatives of patients with venous thromboembolism,” Blood Journal, vol. 124, no. 13, pp. 2124–2130, Sep. 2014.
- F. Couturaud et al., “Six Months vs Extended Oral Anticoagulation After a First Episode of Pulmonary Embolism: The PADIS-PE Randomized Clinical Trial,” The Journal of the American Medical Association, vol. 314, no. 1, pp. 31–40, 2015.
- H. R. Büller et al., “Edoxaban versus warfarin for the treatment of symptomatic venous thromboembolism,” The New England Journal of Medicine, vol. 369, no. 15, pp. 1406–1415, Oct. 2013.
- H. D. Cheng, J. Shan, W. Ju, Y. Guo, and L. Zhang, “Automated breast cancer detection and classification using ultrasound images: A survey,” Pattern Recognition, vol. 43, no. 1, pp. 299–317, Jan. 2010.
- I. Gatos et al., “A new computer aided diagnosis system for evaluation of chronic liver disease with ultrasound shear wave elastography imaging,” Med. Phys., vol. 43, no. 3, pp. 1428–1436, Mar. 2016.
- K. Skerl, S. Vinnicombe, S. McKenna, K. Thomson, and A. Evans, “First step for computer assisted evaluation of qualitative supersonic shear wave elastography characteristics in breast tissue,” in 2016 IEEE 13th International Symposium on Biomedical Imaging (ISBI), 2016, pp. 481–484.
- Q. Zhang et al., “Deep learning based classification of breast tumors with shear-wave elastography,” Ultrasonics, vol. 72, pp. 150–157, Dec. 2016.
- J. Ding, H. D. Cheng, J. Huang, Y. Zhang, and C. Ning, “A novel quantitative measurement for thyroid cancer detection based on elastography,” in 2011 4th International Congress on Image and Signal Processing, 2011, vol. 4, pp. 1801–1804.
- F. Paparo et al., “Real-Time Elastography in the Assessment of Liver Fibrosis: A Review of Qualitative and Semi-quantitative Methods for Elastogram Analysis,” Ultrasound in Medicine & Biology, vol. 40, no. 9, pp. 1923–1933, Sep. 2014.
- A. Sarti and F. L. Lorini, Echocardiography for Intensivists. Springer Science & Business Media, 2012.
- S. Beuil, “Recherche d’une corrélation entre l’échographie 2D et l’Elastométrie sur les thromboses veineuses proximales profondes pour datation du thrombus,” Diploma of Complementary Specialized Studies (thesis in French), UBO, Brest, 2013.
- M. E. Hachemi, S. Callé, and J.-P. Remeniéras, “Application of shear wave propagation to elasticity imaging of biological tissues,” Traitement du signal et cancérologie, vol. 23, 2006.
- L. M. Roch, “Introduction à l’imagerie médicale (University course in French),” University of Montreal Hospital, Mar-2006.
- E. Mfoumou, J. Tripette, M. Blostein, and G. Cloutier, “Time-dependent hardening of blood clots quantitatively measured in vivo with shear-wave ultrasound imaging in a rabbit model of venous thrombosis,” Journal of Thrombosis and Haemostasis, vol. 133, no. 2, pp. 265–271, Feb. 2014.
- L. Bressollette, P. Quehe, S. Gestin, and S. Beuil, “Imagerie du thrombus (article in French),” Journal des Maladies Vasculaires, vol. 40, no. 5, p. 286, Sep. 2015.
- Toshiba Medical Systems Corporation, Ed., “System Brochure : Aplio 500, picture perfect ultrasound.” 2012.
- H. Lijima, “Approaches to the diagnosis of liver fibrosis,” Japan, 2014.
- K. Zuiderveld, “Contrast limited adaptive histogram equalization,” in Graphics Gems IV, P. S. Heckbert, Ed. San Diego, CA, USA: Academic Press Professional, Inc., 1994, pp. 474–485.
- H. S. Prasantha, H. L. Shashidhara, and K. N. Balasubramanya Murthy, “Image scaling comparison using universal image quality index,” in 2009 International Conference on Advances in Computing, Control, and Telecommunication Technologies, 2009, pp. 859–863.
- M. G. Beckman, W. C. Hooper, S. E. Critchley, and T. L. Ortel, “Venous Thromboembolism: A Public Health Concern,” American Journal of Preventive Medicine, vol. 38, no. 4, Supplement, pp. S495–S501, Apr. 2010.
- G. Tartare, “Contribution à l’analyse de l’IRM dynamique pour l’aide au diagnostic du cancer de la prostate,” Ph.D Thesis (in French with an abstract in English), Université du Littoral Cote d’Opale, 2014.
- P. Chuzel et al., “Automatic clustering for MRI images, application on perfusion MRI of brain,” in 2016 2nd International Conference on Frontiers of Signal Processing (ICFSP), 2016, pp. 63–66.