A Derived Metrics as a Measurement to Support Efficient Requirements Analysis and Release Management
A Derived Metrics as a Measurement to Support Efficient Requirements Analysis and Release Management
Volume 2, Issue 3, Page No 36-40, 2017
Author’s Name: Indranil Natha)
View Affiliations
Chartered Fellow, BCS, The Chartered Institute for IT, United Kingdom
a)Author to whom correspondence should be addressed. E-mail: indranil.nath@bcs.org.uk
Adv. Sci. Technol. Eng. Syst. J. 2(3), 36-40 (2017); ![]() DOI: 10.25046/aj020306
DOI: 10.25046/aj020306
Keywords: Software Requirements Management, Software Engineering, Software Development Process, Requirements Specification, Lifecycle Model, Release Planning, Analysis, Metrics

Export Citations
This paper presents a Release Management model to support requirements management. Requirements development and management can be integrated with a release-planning approach to achieve lesser Requirements spillover problems which is an innovative way to capture, control and evolve the user requirements based on integer linear programming.
Received: 11 March 2017, Accepted: 27 March 2017, Published Online: 04 April 2017
1. Introduction
The Capability Maturity Model (CMM) and its successor Capability Maturity Model Integration (CMMI) have been widely accepted as a process model to steer software process improvement (SPI) activities [1]. In some parts of the software industry, like the defense industry, software suppliers are obliged to have their software processes at least at CMM [2] level 4 or 5 in order to get any contracts. In many organizations, software has become such a critical part of the product portfolio, that senior management at the strategic level has defined objectives and allocated budgets for improvements. Despite these successes to realize sustainable improvements, the percentage of failures is however probably still higher. It is true of any system that there are several Critical Success Factors [3]. They include both performance requirements (such as serviceability, reliability, portability, and usability) and limited resource requirements (such as people, time and money) In my experience, they either failed because of poor estimation or poor change management or even poor requirements including release plan. Although modeling activities [4] like Data Flow Diagram, Entity Relationship Diagram, State Charts, Object Oriented Method and Unified Modeling Language helped to better understand the Requirements and to represent them in clear and comprehensive manner, it still failed to adapt to an evolutionary approach for incremental software release and an opportunity for prioritizing requirements. This paper presents a Release Management model to support requirements management. Requirements development and management can be integrated with a release-planning approach to achieve lesser Requirements spillover problems that are an innovative way to capture, control and evolve the user requirements. A metric coupled with the incremental software release that offers organizations an opportunity for prioritizing requirements, an optimization technique, based on integer linear programming, to support software vendors in determining the next release of a software product developed and demonstrated in Section 3. The technique is based on the assumption that a release’s best set of requirements is the set that results in maximum projected revenue against available resources in a given time period.
2. General Process Metrics
Today measuring processes and products, objective, quantified information can be gathered to support decision-making at all levels. The objective measurements provided allow management and software product engineers to:
- Identify inefficient processes that need improvement.
- Reengineer ineffective processes that do not add quality to products.
- Evaluate process changes to measure process improvement.
- Utilize historic measurements of productivity, complexity, size, effort, and cost during project planning.
- Monitor a current project plan’s risk by measuring the schedule, cost, size, and effort of the products under development and comparing them to the assumptions and estimates used as the basis for the plan.
- Monitor product development by measuring current cost, effort, and schedule data to determine if corrective action, such as re-planning, is needed.
A typical Process Flow of the Software Process is shown in Fig1 that is based on Humphrey [4] with only minor changes. In the first phase Analysis the Requirements are studied, where after estimates are made for the size of the resulting program, the productivity, the effort distribution over the subsequent phases, and other product and process metrics. These estimates are recorded on the Project Plan Summary.
During the subsequent phases, the actual defect and time data are logged on the Defect Log Form and the Time Log Form. The Design Review Checklist and the Code Review Checklist are used to structure the review process during the Design Review phase and the Code Review phase. When the program has been tested and is ready to be released as a Finished Product, all recorded data is summarized in the Project Plan Summary, enabling the software engineer to make an analysis in the Post Mortem phase prior to the program release.
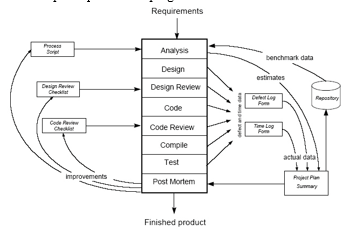
Fig 1: Process flow of the Software Process (based on [HUM 1997]).
The purpose of this analysis is to investigate how the process used can be further improved. The result may be that the Process Script, the Design Review Checklist and/or the Code Review Checklist are adjusted. Further, the data from the Project Plan Summary can be used to calculate accumulated values for productivity, time or effort distribution, and so on. This information can be stored in a Repository to support the estimation process for future programming assignments.
By following the Process Flow of the Software Process [5] Humphrey proved that valuable product and process data could be obtained and the analysis of the data would enable a software engineer to calculate for instance the following metrics for better decision making in software engineering:
2.1. Estimation Accuracy
Estimates are collected for the size of the program to be developed and the process to be followed (time distribution, productivity, etcetera). These estimates are compared with the actual figures when the program has been implemented and tested. The result is the estimation inaccuracy, which can be calculated with the following
Equation:
2.2. Relating Size and Effort: Productivity
By measuring the size and effort of programs, the productivity can be calculated in retrospect. When the productivity has been measured, however, it can be used to proactively calculate the expected effort or time needed to develop a program when the size of the program has been estimated, the equation being:![]()
2.3. Yield
When developing a program subsequent development phases are passed through. In each development phase defects will be injected and removed. Removed defects might have been injected in the current development phase; however, they might also have been injected in previous development phases. The yield of a development phase can be defined as a number, expressing the number of defects removed in a particular phase divided by the sum of the number of defects inherited from previous phases and the defects injected in the phase itself: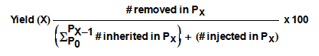
Where #= Number of Defects and Px is ”Phase x” The yield of a phase can vary from 0% to 100% (if the denominator equals 0, the yield of the phase is equal to 100%). When the yield of a phase equals 0 it means that in that particular phase no defects have been removed. They are all carried forward to the next phase. When the yield of a phase equals 100%, it means that in that particular phase all existing defects are removed. These are both the defects inherited from previous phases and the defects injected in that particular phase itself. In the ideal case, the yield of each development phase is equal to 100%. This means that in each phase all injected defects are also removed and that the final product is free of defects.
But in practice, not all defects will always be removed. Defects will be carried forward to the subsequent phases. If they are not found in, they will be shipped being part of the final product. Note that the yield of the different development phases can only be calculated when all defects have been found. Only then it is known how many defects were injected and removed in the different phases.
If an injected defect is carried forward to subsequent phases, it is very important to detect and remove the defect as early as possible. The rework effort is proportional to the difference between the injection phase and the detection and removal phase. If an early injected defect is found in one the latest phases of development, the rework effort will extend over more phases. Very expensive defects are the ones that are injected during the Analysis and Design phase and detected during the Test phase. It is assumed here, that there are no defects in the requirements. Another approach is now to calculate the Yield of the phases Analysis and Design (A&D) combined: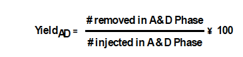
This metric denotes the quality of the early phases before handing over of the product for further implementation and testing.
2.4. Appraisal/Failure Ratio (A/FR)
Striving for a high combined Yield means investing effort in appraisal to detect defects as early as possible. An example of an appraisal action is, for instance, a peer review. The objective of appraisal actions is to pass forward a reliable product to the next phase. Advantages are twofold. In the first place, this will probably lead to a more reliable final product. It is a utopia to think that all transported defects will be found at a later stage. In the second place, the total failure cost in subsequent phases due to fixing detected defects will probably decrease as the number of expensive defects decreases. A new metric is introduced, called the Appraisal/Failure Ratio or A/FR. This is the ratio between the appraisal cost in the early development phases and the failure cost in subsequent development phases, its equation: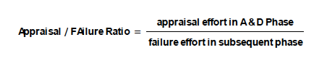
The A/FR can vary from 0 to infinite (if the denominator equals 0, the A/FR is equal to 0 if defects are found but not removed and the A/FR is undefined if no defects are found). An A/FR equal to 0 means that no appraisal effort is spent in detecting and removing defects in the early phases of development. The failure cost to be made in subsequent phases later will presumably be very high, assuming that the reliability of the final product is important.
2.5. Defect Injection and Defect Removal Rate
Collecting defect data enables one to calculate the defect injection and defect removal rate in each development phase. It can, for instance, be related to the effort spent in that particular phase: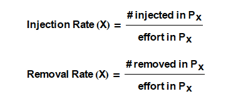
2.6. Defect Density
The defect density can be calculated by relating the total number of defects found during development to the resulting program size: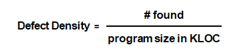
A defect density equal to 0 means that no defects are introduced during development; in other words, the Yield of each development phase equals 100%. These metrics are powerful to analyze the software process and adjust the process in order to implement improvements. Most metrics are self-explaining with regard to their best values. The best values for Estimation Inaccuracy and Defect Density are for instance 0%, for Yield the best value would be 100%. This is however not evident for a metric like A/FR. But there is more. The best value does not necessarily mean that it is the optimal value. There might be practical limitations to obtain a Yield of 100% for instance. Human work is not perfect, causing the injection of defects, and a project budget is normally limited, meaning that time for appraisal and failure expenditures is limited. It is worth considering the question whether there are optimal combinations of a set of metrics, that there is no metric that allows helping management to decide on prioritizing requirements in the 3-Degree-Of-Freedom [6] of Software Engineering (Software Development Process, System Components and View onto the Systems).
3. The Derived Metrics
This section will have all the derived metric from above and how the derived metrics can be used to support the re-engineering. The set of derived metrics will offer the possibility to analyze and re-engineer processes and their respective work products. Finally, this re-engineering will allow for efficient Requirement Analysis and bi-directional requirement traceability [7-9].
One of the most common life-cycle approaches adopted by most software development organizations is the evolutionary approach. This approach, coupled with incremental software release offers the opportunity for prioritizing requirements [10]. Customers receive part of the full working system early on as a beta release and it is easier to schedule and estimate for each delivery. This approach also enables user feedback early on (during development stage) and changes and additions to requirements are easily handled. Release management is mathematically modeled as follows.
Let us consider a set of requirements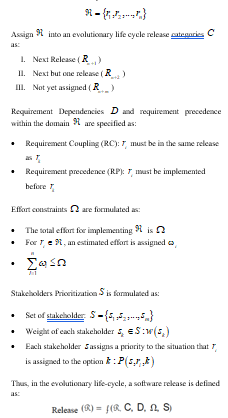
4. Discussion
Release Re-engineering using Requirement Analysis [11]. For software vendors, the process to determine the requirements [12] for the next release of a software product is often difficult. The mathematical formalization of release composition with a corresponding optimization tool that aims to support product managers and development project managers during release planning is discussed as above. The tool is based on integer linear programming and assumes that an optimal set of requirements is the set with maximum projected revenue against available resources in a given time period. The input for the optimization is twofold. Input data like the list of candidate requirements estimated revenue and required team resources per requirement, whether or not a requirement is mandatory, comprise the first type of input. Secondly, several managerial steering mechanisms provide flexibility in the optimization environment.
Companies developing software products face complex challenges when determining requirements for upcoming releases. Often the wish list of requirements extends the capacity of available resources, requirements may not be unambiguous, they may be difficult to prioritize, etc. As a matter of fact, many aspects influence the definition of an optimal set of requirements for a next release. Several scholars have presented lists of such aspects including importance or business value, personal preference of certain customers and other stakeholders, the penalty if not developed, the cost of development in man days, development lead-time, requirement volatility, requirement dependencies, the ability to reuse, and requirements quality.
In order to deal with this multi-aspect optimization problem, different techniques and procedures have been applied. The analytical hierarchy process [13] assesses requirements according to certain criteria by taking all possible requirement pairs, relatively valuing each pair, and subsequently using matrix calculations to determine a weighted list of requirements. Jung extended the work of Karlsson and Ryan by reducing the complexity of applying the analytical hierarchy process to large amounts of requirements using linear programming techniques [14]. Through cumulative voting (Leffingwell and Widrig (2000)) different stakeholders are asked to distribute a fixed amount of units (e.g. euros) between all requirements, from where an average weighted requirement list is constructed. With discrete event simulation, the effect of the development of requirements is modeled, allowing what-if analysis.
The set of derived metrics shown in Section 3 offers the possibility to analyze projects, Software Requirement, and their respective work products in detail [15]. The following can be concluded:
- Predictability: There is a considerable budget overrun (+50%) and schedule overrun (+19%), but the realized product size is less than predicted (-24%). The realized overall productivity is nearly half the predicted value (-49%). These data need to be further analyzed in order to find out the reasons for these deviations.
- Effectiveness: The cumulative Yield at the Detailed Design phase and the Implementation phase is very low, 10% and 19% respectively. This implies that many defects are transported to subsequent phases and that the failure cost in these phases will probably be high. This is confirmed by the fact that the total amount of rework equals 38% of the overall lifecycle effort.
- Efficiency: The efficiency is very low because many defects have been found in the later phases. As a consequence, the overall failure cost is high (38% of overall life cycle effort). This is confirmed by the fact that the cumulative A/FR before the Detailed Design phase and Implementation phase is very low (0.02 and 0.03 respectively).
This analysis gives an organization the possibility to select improvements for future projects, assuming that this project has not been very exceptional but comparable with similar projects. Improvements might be:
- Improve the predictability by using a lower productivity figure when estimating projects. In this way, more realistic estimates will be obtained.
- Increase the quality of the resulting product by increasing the Yield in the earlier development phases. This can be done by increasing the review effort (A/FR higher) or by adjusting the review method.
- Improve the efficiency by increasing the A/FR in the various development phases before the Integration Test phase. Special interest might be given to the Implementation phase and Unit Test phase as in these phases the Detection Rate and Removal Rate are very high.
In all cases, the available data can be used to make predictions about the expected effects in terms of return on investment. This is not always easy, as the various parameters might be correlated (for instance, a higher A/FR will probably contribute to a higher Yield).
However, by building a record of experiences, the capabilities in this area can be stepwise improved. In this example, the following approach might be applied in an iterative way:
- Increase the cumulative A/FR by increasing the appraisal cost in the earlier development phases.
- Estimate what the effect will be on the cumulative Yield at the Detailed Design phase: what will be the reduction of defects injected in the Requirements phase and Architecture phase?
- Take measures to improve the inspection and review process during the Implementation phase and Unit Test phase and estimate the effect on the Defect Detection Rate and the Defect Removal Rate in these phases.
- Use the cumulative Yield at the Detailed Design phase to predict the number of defects that will be passed forward to subsequent phases and use the Defect Detection Rate and Defect Removal Rate to calculate the failure cost.
- Calculate the effect on effort, time, and expected corrective maintenance cost.
- Repeat the steps 1 till 5 until satisfactory (and realistic) values have been obtained.
5. Conclusion
The derived metrics can be considered to be useful for organizations still having to build a measurement foundation for their software projects and products as well as for organizations looking for further improvements of their software processes. The mature organizations will analyze their available data, select the most promising improvements and re-engineer and re-measure their performance over time. The less mature organizations will not be able to implement re-engineering from day one but need to define a strategy how to implement the model in subsequent steps. The order of the steps can be derived from the most urgent problems the organization is faced with:
- In this case, the first step might be to collect estimates and actual for size, effort and time.
- In this case, the focus is on the output of the project, being the quality of the product. Important measurements to be considered first are defects (Yield values per phase and cumulative).
- In this case, attention must be paid to appraisal cost related to failure cost (A/FR) and defect rates (Defect Detection Rate and Defect Removal Rate).
In all cases, supporting methods and tools might be selected to facilitate the measurements, as long as it is understood that “a fool with a tool still remains a fool”. A method or tool will not solve the problem; they can only support a defined process.
Conflict of Interest
The authors declare no conflict of interest.
- J.W.E. Greene, “Software Process Improvement: Management Commitment, Measure, and motivation”, QSM Ltd. SPI98ADR
- CMMI-SVC, V1.3, Improving processes for providing better services, Software Engineering Process Management Program, Software Engineering Institute, November 2010
- Tom Gilb, “Competitive Engineering, A Handbook for Systems Engineering, Requirements Engineering and Software Engineering Using Planguage”, Page 4. Elsevier Butterworth-Heinemann, 2006.
- R.S. Pressman, “Software Engineering – A Practitioner’s Approach”, Page 300, 301, 309-310, 305, 793, 438, 646. McGraw-Hill, 2001.
- Humphrey, W. Managing the Software Process, Addison-Wesley Publishing Company, 1990.
- I. Nath, S Kundu, “Is Software Requirements a Corporate Asset?” Fig.2. Degrees of Freedom in the Software Engineering Components of SE-CUBE, IEEE International Engineering Maangement Conference Proceedigs, Innovation and Entrepreneurship for Sustainable Development, Volune 1, 2004
- Davis, A. M., “Software Requirements: Analysis and Specification”, Prentice Hall, 1990.
- Kovitz, B. L., “Practical Software Requirements: A Manual of Contents & Style”. Manning, 1999.
- Potts, C., “Requirements Models in Context”, 3rd International Symposium on Requirements Engineering (RE’97), Annapolis, USA, 6-10 January 1997, pp. 102-104, 1997.
- Nancy Mead., “Requirements Prioritization Introduction, Software Engineering Institute, Carnegie Mellon University, September 2006.
- A.G. Sutcliffe & M. Ryan, “Experience with SCRAM, a Scenario Requirements Analysis Method”, 3rd Int’l. Conf. on Requirements Eng., pp. 164-171, 1998.
- Nguyen, L. and Swatman, P.A., “Managing the Requirements Engineering Process”, Working Paper 2000/15, School of Management Information Systems, Deakin University, Australia, 2001.
- Melvin Alexander, “Decision-Making using the Analytic hierarchy Process (AHP) and SAS/IML”, Social Security Administration, Baltimore, MD, 2012.
- John W. Chinneck, “Practical Optimisation “ a Gentle Introduction”, 2001
- Mack W. Alford, “Software Requirements Engineering Methodology (SREM) at the age of two”, In 4th Int. Computer Software & Applications Conference, New York, pages 866–874. IEEE, 1980.