Proposal of a congestion control technique in LAN networks using an econometric model ARIMA
Proposal of a congestion control technique in LAN networks using an econometric model ARIMA
Volume 2, Issue 1, Page No 269-276, 2017
Author’s Name: Joaquín F Sánchez1,a), Martha M Cuellar2
View Affiliations
1Docente Ingeniería de Telecomunicaciones, Facultad de Ingeniería, San Mateo Educación Superior, Bogotá Colombia
2Docente Negocios Internacionales, Facultad de Negocios Internacionales, San Mateo Educación Superior, Bogotá Colombia
a)Author to whom correspondence should be addressed. E-mail: js012108@gmail.com
Adv. Sci. Technol. Eng. Syst. J. 2(1), 269-276 (2017); ![]() DOI: 10.25046/aj020133
DOI: 10.25046/aj020133
Keywords: LAN Network, Time series, Congestion control, ARIMA model

Export Citations
Hasty software development can produce immediate implementations with source code unnecessarily complex and hardly readable. These small kinds of software decay generate a technical debt that could be big enough to seriously affect future maintenance activities. This work presents an analysis technique for identifying architectural technical debt related to non-uniformity of naming patterns; the technique is based on term frequency over package hierarchies. The proposal has been evaluated on projects of two popular organizations, Apache and Eclipse. The results have shown that most of the projects have frequent occurrences of the proposed naming patterns, and using a graph model and aggregated data could enable the elaboration of simple queries for debt identification. The technique has features that favor its applicability on emergent architectures and agile software development.
Received: 24 December 2016, Accepted: 23 January 2017, Published Online: 28 January 2017
1. Introduction
This paper is an extension of work originally presented in conference 2016 8th Euro American Conference on Telematics and Information Systems (EATIS) “Congestion control LAN networks using an econometric model ARIMA”[1] .In Computer Sciences, especially in Telecommunications, several mathematical tools to make analysis and design of the systems allowing to improve their own performance are used. For instance, time series are used on research and industry fields, and reviewing their applications as in [2]–[5], it was found that stock exchange analysis has some similarities with the telecommunications field. After look over the LAN networks traces as viewed in [5] and [6], network trafficking behavior is as similar as the variation graphs of the shares in the stock exchange. Considering this, the present paper aims to reach commonalities between data network trafficking and stock exchange behavior to 1) design a traffic analysis tool in data networks, and 2) propose a model of congestion control based on an econometric model.
Time series are suitable tools to evaluate a given situation of a performance movement of the analyzed variable, and data congestion in the telecommunications networks in this case. This kind of mathematical resources are appropriate to detect immediate trends or errors related to the volume and movement of analyzed data, providing better correctives and trends which are important for data channels management; therefore, time series afford occurrence predictions for decision-making.
Congestion analysis in data networks may carry out using different parameters and trends, getting estimates for the use, control, and application of statistics measures in decision-making. This could guide predictions of the variables in a given model with their historical behavior, statistics, and features to give the chance to value the future occurrence level [8]. In this way, past data may lead to forecast future values movements if data are established and depicted through graphs and specific indicators given by positive or negative variables trends. It is worth mentioning that delay times and LAN networks bandwidth are the variables considered for this paper.
According to the previous concepts, analysis of one share of a given company will be presented. This shall allow to propose the congestion control model of data obtained from a LAN network implementation. In section 2, a theoretical revision of econometric analysis for one share is made and, in section 3, it is discussed why to design a congestion control strategy is worth, explaining some theoretical elements. Proposal of the model and results are presented in sections 4 and 5, and conclusions are displayed in the last section.
2. ARIMA model (autoregressive integrated moving average) to analyze one share
It could be useful to estimate a model capable of making technical analysis related to the behavior of negotiation indicators in the financial market because they might enhance the evaluation of trends, variables, relations of influence, and historical behavior within supply and demand of stock market. In general, the price and the volume of negotiation are the most relevant variables taken into account mainly because they determine the movement of the variable: the upward or downward trend, or its resistance to change through considered time opening and closing, like relation of values, maximum and minimum, and volatility in periods of time such as days, weeks, months, and years. In this way, information of global market and its necessities is reflected, determining negotiation trends with patterns of behavior, and allowing that information does exhibit a cyclic and repeated activity according to the own market features.
Looking over time series characteristics in stock markets, basic concepts of one analyzed variable could be established by chartism (analysis of financial graphs) [9]. In fig. 1, the price of one share is depicted. The downward market is the bold outlined circle and the upward market is the light. The bases (dotted lines) delimit the trend in the bearish movement, giving the chance to rebound towards the bullish, meaning that the price demand stands out compared to the supply. On the other hand, in the upward trend of the market (dashed lines), supply is greater than demand.
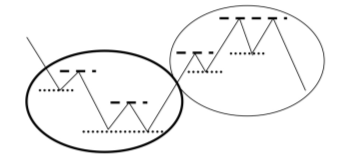
Fig1: Variation concept [2], [8]
The assessments of prices can progress in a specific time to have a suitable measure in a given period of time. Highlighting that a market is named bullish when the price exhibits the trend to be over its own value, the maximum benchmarks come up, (1, 2, 3, 4 in fig. 2) increasingly higher, and minimum benchmarks (1., 2., 3., 4. in fig. 2) are greater than the previous ones. In this way, it is created a trend line which breaks the base of the price trend, giving rise to a new trend, named pull back in the stock market environment. On the other hand, the bearish market exhibits an opposite behavior compared to the bullish market, with the same contextual benchmarks and indicators, associated to the downward trend.
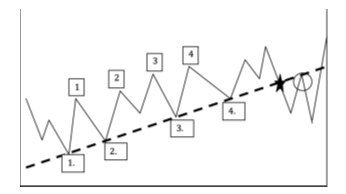
Fig2: Prices trend [2], [8]
ARIMA model can be used to make a Forecasting analysis. When the model is proposed, an estimation of values behavior of the shares is obtained, allowing to make a decision to sell or buy. This model comes from a nonstationary homogenous series.
Given the series which follows a general stationary process , then: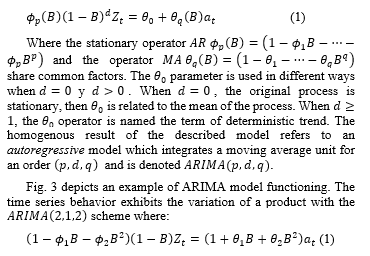
Fig3: ARIMA model (2,1,2)
In other words, model allows to describe one value as a linear function of previous data and errors which come from the random behavior of that data. It works with a stationary series, and the model is used to get an estimation or a price forecast, where the time series is put and mean squared error is calculated. To determine the variance of the series we have: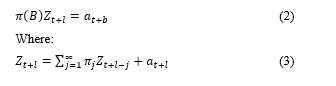
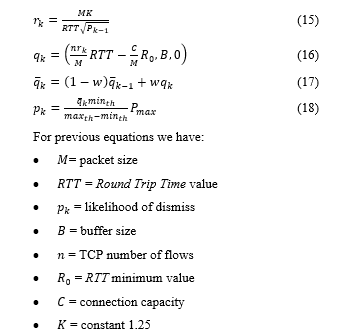
Parameters must be calculated with those equations to get an estimation of the variance trend of the original series; hence, we have the equations as follows: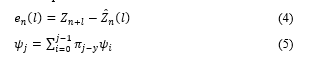
Error is calculated with equation 4, and terms of the estimated series are determined with equation 5.
2.1. Graphical analysis and series analysis
Fig. 4 depicts the result of taking stock exchange behavior and time series into account. It is worth thinking in an model which allows to one independent variable (share #1) be related to or compared with other independent variable (share #2) according to its behavior in the stock exchange.
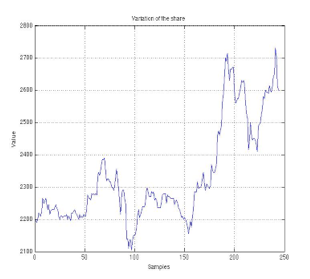
Fig4: Graph of one share behavior
Variable Share #1 will take error into account within the constant mean, and its (risk level) will be reflected, where risk level remains in the trend of its volatility inside of the independent stock market, producing a single one variance. In the same way, behavior of the share #2 will be the same. Relation between these two variables will produce a covariance which shall describe the behavior inside of the stock market, but behavior itself does not have an impact on the independent variable performance within the market.
Then, we have the mean of the independent variable: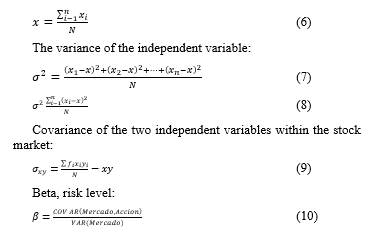
Having previous equations, model is used within the stock market [10] and [11] which works to calculate the price of an asset or a liability. This model allows to establish the behavior projection of the share in a specific period of time, and in this paper the congestion volume of a LAN network is the variable; therefore, this kind of analysis let to make an estimation considering historical behavior of data which are being analyzed in periods of measurement.
It is considered that model is defined by: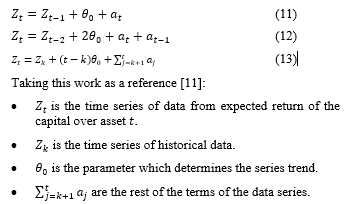
3. Congestion control in data networks
Congestion in data networks has become a proper phenomenon of this technology, and it comes up in several parts of the network architecture, beginning in the sizes of the routers buffers which are responsible for make the routing of the packets. Those buffers are limited, and they can be shaped as a type of queue M/M/1/ N/ , where the queue size is which is a limited resource; therefore, when the queue is full, a known consequence starts to come up, denoted packet loss which can be measured as likelihood of blockage. 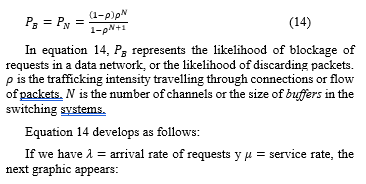

Based on the diagram of state, it is possible to propose equations of balance for different states:
| State | Output rate | Input rate |
| 0 | ||
| 1 | ||
| 2 | ||
| n |
Then, we have: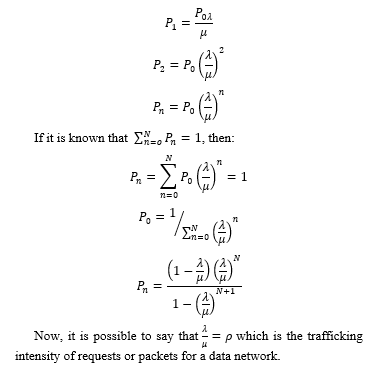
Now, it is possible to say that which is the trafficking intensity of requests or packets for a data network.
Equation 14 represents likelihood of blockage of a used model at the beginning of telephone systems. In mathematical terms, it models the value of the service quality that would be given to a network, depending on the size of the buffer. In the course of evolution of telecommunications networks, specifically data networks, equation 14 has been adapted to measure resources and fulfill demand needs of the users.
However, the size of the buffers is not the only one resource that affects the congestion of data networks, but also the processing level of the network elements, and the capacity of transporting information, such as the connections bandwidth between nodes. Bandwidth is one of the most important resources in data networks that directly affects congestion because it is the main aspect where packet transport becomes tangible and from which is possible to measure service deterioration.
As fig. 6 depicts, congestion can be represented as a downward curve that drops depending on the number of flows that enter the system. If system turns congested, the more flows they enter, the less efficiency of network performance.
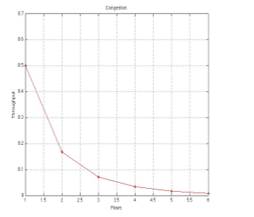
Fig6: Concept of congestion
To demonstrate this behavior, the limit when tends to infinity can be calculated; thus, we have: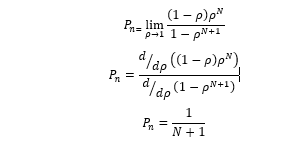
This expression defines the congestion shape in a data channel. This behavior can be replicated not only in connection flows, but also in different junction sections of data connections; for instance, the formed bottlenecks when there is a transfer from distribution network to access network because the mean of transmission has to change due to the architecture, as is seen in HFC networks (Hibrid Fiber Coaxia) that mix fiber optic with coaxial cables.
3.1. Congestion control with TCP
Congestion control models have been focused on the transport layer protocol TCP [12] and [13], in such a way that flow control by sliding window protocol, AQM technique (Active Queues Management) [14], admission control, and delay time management are the more used techniques. All of this is made by different changes or versions to the TCP protocol, beginning by TCP Tahoe and TCP Reno, which modify retransmission of ACK packets or confirmations.
These TCP modifications have led to study new forms of making congestion control, which have been focused on transmission states that define how algorithm is executed. This sequence can be modified according to necessities of the desired control over data flow. For instance, in [12] the TCP states define how the algorithm of congestion control changes, from slow start state towards congestion avoidance state. During transition, the size of retransmission window is affected by connection state.
The main goal of this paper is to propose a model of control without any change to the protocol because it leads to make modifications in the times of transmissions, confirmations, and retransmissions of the network elements, and these changes could worsen the network behavior; therefore, a model without modifications in the protocol structure is proposed to help to treat the behavior of network elements for their adaptation to the flow of produced data from random behavior of users.
3.2. TCP basis
RFC 793[15] describes TCP functioning, where window of congestion control is not dynamic. First variation implemented on TCP protocol is the fitting of transference rate to the level of current congestion presented in data network. The purpose of making this reduction of transference rate is to diminish the number of lost packets in connections. Next steps of change in TCP protocol lead to TCP Tahoe algorithm which modifies slow start and congestion avoidance algorithms, as well as fast retransmission. In TCP Reno another modifications happens, consisting in TCP Tahoe but with a variation in the fast recovery algorithm [16].
The main functions of slow start and congestion control are the control of transference rates of generated packets and the determination of available capacity of network connections; however, making a process in congestion window is needed to achieve this. This process is denoted cwnd, and it is defined as the number of transmitted bytes whose confirmation is not required. Another considered element is the recovery window denoted rwnd which is the number of bytes that receptor is capable of receiving from a given source [17]–[19].
To establish connection between two network elements, activity of information transport can be described as follows:
- Maximum size is assigned to cwnd by transmitter.
- The transmitter starts a retransmissions timer.
- Slow start algorithm sends a packet or a section if an ACK is received; then, the cwnd value is augmented in one section.
- After that, two sections can be sent and cause two ACK.
- For each ACK, cwnd is augmented in one section.
- Growth process of congestion window is exponential and keeps this rhythm as far as the bounded value is reached by rwnd and established threshold is attained by ssthresh.
- Congestion avoidance algorithm is executed when ssthresh value is obtained and the cwnd value is augmented in one additional section, but this time, by each ACK and RTT.
- When packets loss happens, the process returns to the slow start: cwnd is again established to one section and ssthresh to half the window size.
Having knowledge about TCP protocol functioning and how congestion control is made, a congestion control model based on an econometric model denoted ARIMA is pose, which will be fused together with TCP mechanism to measure congestion control of a LAN network.
4. Approach of the model
According to the analysis made in section 2.1 and the congestion control functioning explained in section 3, the relation between model and the congestion control is presented as follows:
- A time series with data of packets circulating in the network must be taken.
- parameters for this time series must be calculated.
- The function of yield rate for must be estimated.
- Transmission rates must be fitted with obtained results, and the congestion control must be verified.
To attain this, data are taken from a working LAN network through obtained traces from the network interface of a Switch gate. Analogy between compilation of LAN network data and econometric model is the way in which statistics of variables that work in the network are represented. Each feature is taken as one share of a product, leading to analyze the behavior of one or more shares to know how market behavior will be. In this case, market is the whole data trafficking through LAN network. Once the time of network congestion is known, the congestion control operation is made.
Variables taken in network behavior analysis are: CD (amount of connected devices), PU (percentage of use), and RT (response time) which lead to following result:
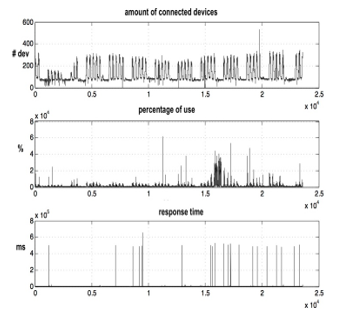
Fig7: Behavior of variables in LAN network
Fig. 7 depicts behavior of variables in LAN network, each one separately. It is worth noting that each variable is affected by the congestion phenomenon; for instance, if congestion comes up, response time begins to increase the same as percentage of use, and the connected devices can undergo complications in different services and applications. Thus, model is applied to detect congestion which is identified by increases in response time or percentage use. When the number is detected, transmission rates will be modified to alleviate the LAN network problems.
Test environment is a LAN network with hierarchical structure whose core layer is the most rugged, and devices are router of Cisco ® brand. In second layer, i.e. distribution layer, Cisco switch catalyst are found, with management capacity. Finally, all devices of the network users are connected to the third layer, i.e. access layer, where congestion control is made through manipulation of the operating system of the switches found in this layer. Fig. 8 depicts test environment distribution.
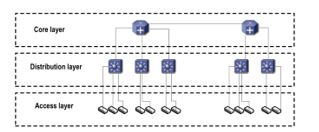
Fig8: LAN network test environment
To apply the model, the following methodology is used: simulation of one transmission control system for TCP is made (fig. 9). This model has a traffic source that feeds the mechanism of TCP; then, RED (Random Early Detection) module is found, where transmission rates are modified; after that, feedback module is found which allows to make the modification to the mechanism of TCP with data being transmitted. This model has been based on previous studies [6], [20], [21]
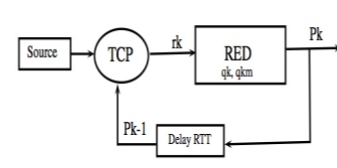
Fig9: TCP control system
During model execution, the modified variable is . This number is modified by value which is calculated with taken values from the LAN network trace.
Fig. 10 shows series which represents taken response times to analyze one LAN subnetwork.
5. Results of the model
To examine the behavior of the proposed model in the last section, one data series is taken from LAN network. For this data series, series is created taking as reference the following values:
- trend of the series = limit of response times or percentage of use.
- market yield = LAN network throughput in conditions of no congestion.
- yield of one risk-free asset = throughput of channel capacity.
Taking those variables about TCP control system, we have:![]()
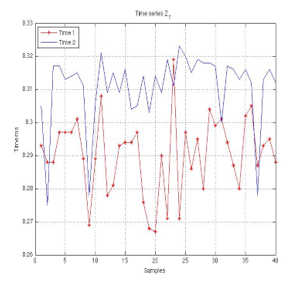
Fig10: Z_t time series
Fig. 11 shows the comparison between behavior of two types of data flows supported by TCP control system. Flow depicted by the continuous line is the normal flow in which congestion control has not been applied, and flow depicted by the dashed line is the flow with modification which is the variable affected by .
Fig. 12 shows another way to look at congestion control. The throughput measure of network is made, where that network is saturated to observe model’s behavior. In this environment, network is saturated by injecting an amount of traffic, and response times are measured. When those are risen, the transmission rate keeps a constant value of 10 Mbps. On the other hand, when network is no longer saturated, transmission rate rises above 10 Mbps because congestion control is no longer applied.
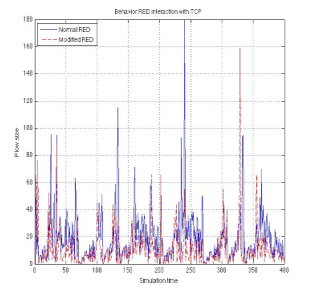
Fig11: Comparison between behavior
Fig. 12 shows a comparison between different subnetworks of the LAN network when congestion experiment is made to saturate subnetwork under observation. An interesting result is that the operation only affects the network where congestion is generated, which when translated into technical work, affects the transmission rates only in the gate where subnetwork is connected and in which the experiment is done. In this comparison, channels independency is shown, and a good functioning of the whole LAN network is guaranteed.
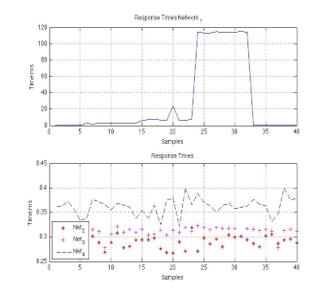
Fig12: Comparison between subnetworks
As a final part of congestion control test on test subnetwork, lost packets are of particular interest because one of the symptoms of congestion is the increase of lost packets in connection. Fig. 13 shows a test subnetwork behavior. At the beginning of the experiment, the number of lost packets rises when the channel is saturated, but then it drops substantially when congestion control is carried out in the switch gate.
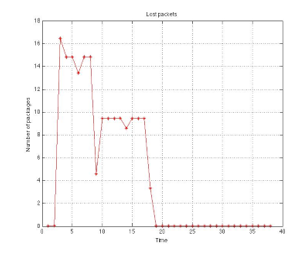
Fig13: Lost packets in a subnetwork
6. Conclusions
This paper has explained a congestion control proposal, where two central concepts are fused together. On the one hand, econometric model works with time series, calculating parameters of a linear function to estimate future values. On the other, TCP conceptual model has been taken to make the congestion control, based on RED (random early detection). Following the analogy in which a LAN network is like a stock exchange and the stock market shares are like the network variables that are produced with circulating traffic, a model with a series is pose, which is the function that represents the estimation for one asset. In this proposal, the modified parameter is , which is the number of traffic flows in the network. Moreover, three network LAN variables have been taken: RT (response time), CD (connected devices), and PU (percentage of use), and one experiment to saturate LAN network to analyze RT behavior with the congestion control model integrated into the system was carried out.
Results demonstrate that the way in which congestion control was made works, and although only the behavior of one variable (RT) has been illustrated, it would be expected that works with the other variables. On the other hand, the used strategy to make traffic control is the transmission rates variation. In summary, it is promising the way in which concepts from other fields or disciplines are being used, since it is possible to successfully adapt the econometric model. Further tests and measurements in LAN network and other data networks like Internet should be carried out to provide better tools to alleviate the congestion experienced nowadays.
- M. M. Cuellar and J. F. Sánchez, “Congestion control LAN networks using an econometric model ARIMA,” in Telematics and Information Systems (EATIS), 2016 8th Euro American Conference on, 2016, pp. 1–7.
- C. W. J. Granger, “Some properties of time series data and their use in econometric model specification,” J. Econom., vol. 16, no. 1, pp. 121–130, 1981.
- D. Rossi, L. Muscariello, and M. Mellia, “On the properties of TCP flow arrival process,” in Communications, 2004 IEEE International Conference on, 2004, vol. 4, pp. 2153–2157.
- A. Sang and S. Li, “A predictability analysis of network traffic,” Comput. networks, vol. 39, no. 4, pp. 329–345, 2002.
- C. You and K. Chandra, “Time series models for internet data traffic,” in Local Computer Networks, 1999. LCN’99. Conference on, 1999, pp. 164–171.
- J. F. Sánchez and L. A. Cobo, “Theoretical model of congestion control in VANET networks,” in Communications and Computing (COLCOM), 2014 IEEE Colombian Conference on, 2014, pp. 1–6.
- L. F. Niño, E. Ardila, and J. F. Sanchez, “Congestion control model for local ip networks,” in Communications and Computing (COLCOM), 2013 IEEE Colombian Conference on, 2013, pp. 1–6.
- F. X. Diebold, Elements of forecasting. Citeseer, 1998.
- D. Baur and K. Glover, “A Behavioural Finance Approach with Fundamentalists and Chartists in the Gold Market,” Univ. Technol. Sydney Work. Pap., 2011.
- I. Dubova, “La validación y aplicabilidad de la teoría de portafolio en el caso colombiano,” Cuad. Adm., vol. 18, no. 30, 2005.
- J. Durbin and S. J. Koopman, Time series analysis by state space methods, no. 38. Oxford University Press, 2012.
- B.-J. Chang, S.-Y. Lin, and J.-Y. Jin, “LIAD: Adaptive bandwidth prediction based Logarithmic Increase Adaptive Decrease for TCP congestion control in heterogeneous wireless networks,” Comput. Networks, vol. 53, no. 14, pp. 2566–2585, 2009.
- M. P. Papazoglou, P. Traverso, S. Dustdar, and F. Leymann, “Service-oriented computing: a research roadmap,” Int. J. Coop. Inf. Syst., vol. 17, no. 2, pp. 223–255, 2008.
- R. Barzamini, M. Shafiee, and A. Dadlani, “Adaptive generalized minimum variance congestion controller for dynamic TCP/AQM networks,” Comput. Commun., vol. 35, no. 2, pp. 170–178, 2012.
- F. Gont and A. Yourtchenko, “On the Implementation of the TCP Urgent Mechanism,” 2011.
- Y. Teng, H. Wang, M. Jing, and Z. Lian, “A study of improved approaches for tcp congestion control in ad hoc networks,” Procedia Eng., vol. 29, pp. 1270–1275, 2012.
- M. Scharf, “Comparison of end-to-end and network-supported fast startup congestion control schemes,” Comput. Networks, vol. 55, no. 8, pp. 1921–1940, 2011.
- S.-S. Wang and H.-F. Hsiao, “TCP-friendly congestion control for the fair streaming of scalable video,” Comput. Commun., vol. 33, no. 14, pp. 1578–1588, 2010.
- G. A. Abed, M. Ismail, and K. Jumari, “Exploration and evaluation of traditional TCP congestion control techniques,” J. King Saud Univ. Inf. Sci., vol. 24, no. 2, pp. 145–155, 2012.
- J. Felix, V. Stavro, M. Aurelio, and A. Monroy, “Determinación de la predecibilidad de trazas de tráfico mediante análisis de recurrencia,” 2008.
- M. Mejia, N. Peña, J. L. Muñoz, O. Esparza, and M. Alzate, “DECADE: Distributed Emergent Cooperation through ADaptive Evolution in mobile ad hoc networks,” Ad Hoc Networks, vol. 10, no. 7, pp. 1379–1398, 2012.