Design and Fabrication of a Dielectrophoretic Cell Trap Array
Design and Fabrication of a Dielectrophoretic Cell Trap Array
Volume 2, Issue 1, Page No 84-89, 2017
Author’s Name: Logeeshan Velmanickam, Dharmakeerthi Nawarathnaa)
View Affiliations
Department of Electrical and Computer Engineering, North Dakota State University, Fargo, ND, 58102-6050
a)Author to whom correspondence should be addressed. E-mail: dharmakeerthi.nawara@ndsu.edu
Adv. Sci. Technol. Eng. Syst. J. 2(1), 84-89 (2017); ![]() DOI: 10.25046/aj020110
DOI: 10.25046/aj020110
Keywords: Dielectrophoresis, Cell isolation, Electrode cell trap array, Electric field gradient

Export Citations
We present a design and fabrication of an integrated micro-fabricated dielectrophoretic (DEP) cell trap array in a microfluidic channel. The cell trap array is capable of isolating target cells in high-throughput manner and producing cell clusters of tunable cell numbers. In this work, we have used commercially available polystyrene beads to show the concept. Bead clusters of various sizes were successfully produced using DEP force (attractive or repulsive). We have found that the number of beads in a cluster depends on the frequency of electric field and the concentration of beads in the mixture.
Received: 01 December 2016, Accepted: 08 January 2017, Published Online: 28 January 2017
1. Introduction
This report is an extension of work that was originally presented in 2016 IEEE International Conference on Electro Information Technology (EIT) [1]. Cell isolation is one of the basic steps of the devices that are commonly used in the applications such as Point-Of-Care diagnosis, food pathogen screening, and environmental monitoring. [2]. It is desirable that the cell isolation needs to be simple and high-throughput. Among the currently available techniques for cell isolation, FACS (fluorescence activated cell sorting), MACS (magnetic activated cell sorting), laser micro dissection, manual cell picking are the methods that are the most widely used. [3]. FACS is the most commonly used method but, to use FACS to isolate target cells, complete knowledge about the surface proteins of the target cells and other non-target cells in the cell mixture is needed. In FACS, first, a fluorescence dye is selectively attached to a surface protein of the target cell and then the separation of target cells is through the fluorescence [4, 3]. To use MACS in cell isolation, prior knowledge about the target cells are also needed. Briefly, in MACS, the target cells are labeled with magnetic beads and they are separated from the cell mixture by applying a magnetic force [5]. Therefore, the prior knowledge about the surface proteins of the cells in the mixture is required for both FACS and MACS methods [3]. Unfortunately, the information of target cells’ surface proteins is not always available and therefore, both of these methods can only be used to isolate limited number of target cells from cell mixtures. In laser micro-dissection, typically, the operator observes the tissue sample through a microscope and the target cell population area is separated by using laser cutting [6]. In manual cell picking, micro-pipettes are used to pick-up the target cell from a cell mixture by applying a negative pressure [2]. Due to the manual operation, laser micro dissection and manual cell pick up methods are low-throughput and not applicable in most of the applications. These critical limitations in existing cell isolation techniques prevent advancing many important areas of biomedical engineering such as Point-Of-Care diagnosis, food pathogen screening, and environmental monitoring. Therefore, there is an urgent need to develop high-throughput, label-free cell isolation technique.
To address this critical need, we have developed a high-throughput and label-free technique for cell isolation. The technique is based on the dielectrophoresis (DEP) and microfluidics. First, we briefly describe DEP and microfluidics below.
2. Theory
Dielectrophoresis is a motion of suspensoid particles relative to the suspended medium resulting from polarization forces produced by an inhomogeneous electric field [7-11], which is widely used in many biomedical applications such as medical diagnostics, cell therapeutics and molecular separation [14]. In particular, most of the biomedical materials including cells, DNA and proteins experience frequency dependent DEP force [7-9, 12].
Mathematically, the time-average DEP force acting on a dielectric particle such as cell or bead that are in a non-uniform external electric field can be represented as
![]()
where r is the radius of the particle, m is suspended medium permittivity, is real part of the Clausius-Mossoti (CM) factor, is the vector operator, and is the r.m.s of the external electric field [11,13]. CM factor depends on the conductivity and permittivity of the particle ( and medium ( , at the applied frequency ( . Since the CM factor changes with frequency, DEP can be represented as negative (repulsive) ( 0), where polarized particles move towards the lowest field strength region), (attractive) positive ( ), where the polarized particles repelled from the lowest field strength region and move to regions of highest field gradient) or zero-force [11-13].
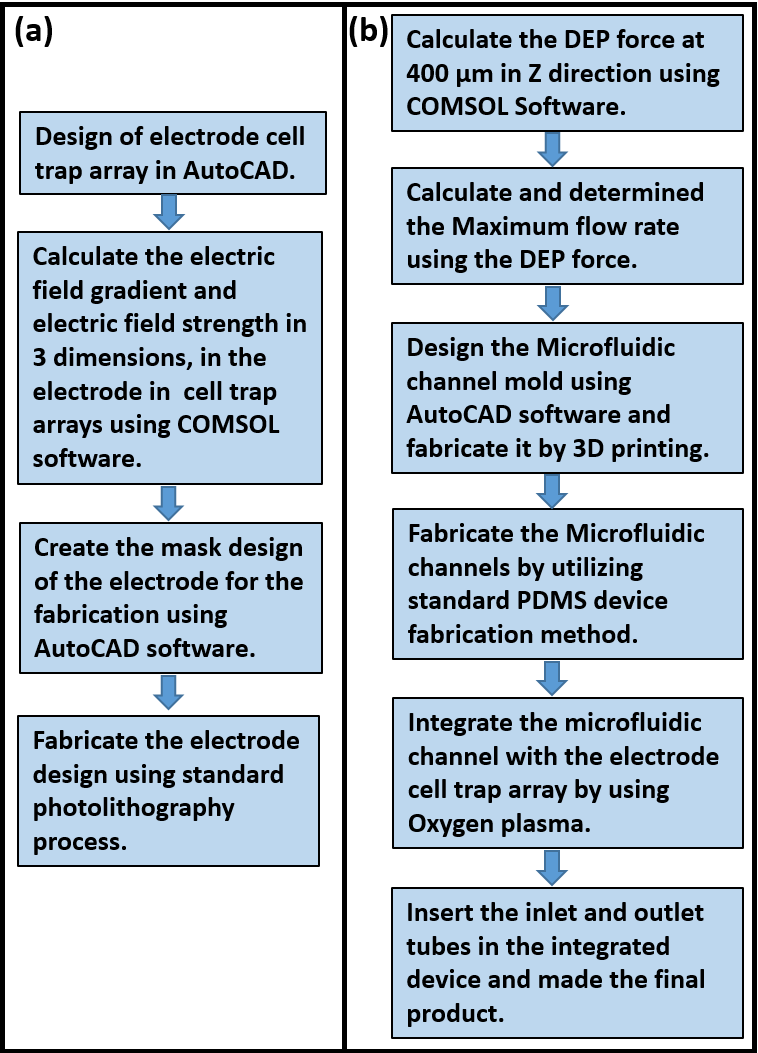
Figure 1: Dielectrophoretic cell trap device fabrication steps. (a) Fabrication steps of the DEP cell trap arrays, (b) fabrication steps of the microfluidic channel and integration method of the electrode cell trap array and microfluidic channel.
The of the cell or bead can be written as the sum of bulk conductivity ( ) and surface conductivity ( ) , which can be represented as = + ( /r). Depending on the cell type and stage of the cell growth, surface conductivity value can be vary from cell to cell [9]. This will produce cell type or stage dependent DEP force on cells. Therefore, target cells can be separated from other cells using this unique feature.
3. Microfluidics
Microfluidics facilitates the handling of fluid flow through micrometer channels [23]. Microfluidics flow channels have been using in various applications [23,24]. The inclusion of microfluidic devices has led to increase the throughput, sensitivity and decrease the cost of applications such as flow cytometry, patterned three-dimensional cultures and drug delivery systems [23,24].
This is mainly due to the fact that Microfluidics requires only small volumes of samples (typically µL) and reagents, produces little waste, offers short reaction and analysis times [25].These unique characteristics make microfluidics particularly useful in biology and medicine [25]. Moreover, fabrication cost is considerably less as it uses the standard semiconductor manufacturing techniques such as photolithography, e-beam evaporation and etching techniques.
In our work we have integrated this microfluidics channels to flow cell/beads sample over the designed electrodes. Below, we describe the design, fabrication and the integration method of our device.
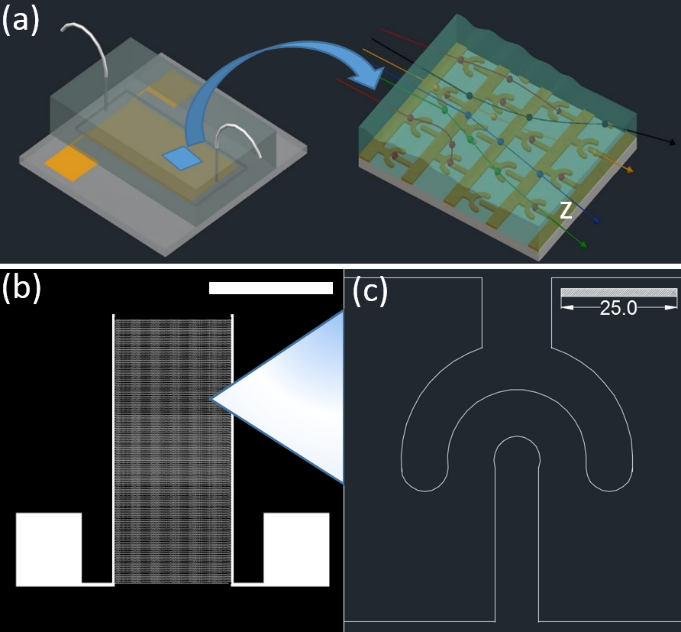
Figure 2: Design of the cell isolation device (a) Conceptual view of our cell isolation device, left side image is the magnified view of the device during the experiment. The electrodes are shown in gold color. Target cells (indicated in red) will be trapped over electrodes and non-target cells (indicated in green, yellow black and blue) will flow into the waste outlet of the device. (b) AutoCAD drawing of the electrode cell trap array (scale bar indicates 1cm), (c) enlarged image of one electrode cell trap (scale bar is in µm).
4. Design of the Dielectrophoretic Cell Isolation Device
The main steps of the fabrication are indicated in the Figure 1. Briefly, cell isolation device has two components. They are: (1) micro-scale DEP cell traps (electrodes) fabricated on glass wafer. Below, we will discuss design of cell traps using electric-current simulations (using COMSOL software), and (2) Microfluidics flow channels designed to flow cell sample over the DEP traps. The conceptual view of the cell isolation device is shown in “Figure. 2(a)” .We will discuss the design of the channel including, fabricating the mold, microfluidic channels and other important experimental parameters below.
4.1. Design and fabrication of electrodes.
Based on our prior experience on design electrodes [26], we came up with an electrode design that generate large DEP force on target cells. Since the DEP force depends on the electric field gradient (see equation 1), the electrode must be capable of generating high electric field gradient (∇E2).
To estimate the expected electric field gradients from our electrodes, first, electrodes were drawn to a scale using AutoCAD software (see “Figure. 2(b and c)”) and imported into COMSOL software. We then used the COMSOL software to calculate the electric fields and electric field gradients generated by the electrodes. This calculation was performed using AC/DC electric current (ec) module and frequency domain studies of COMSOL.
In the simulation, we have assumed that the electrode material is gold and the device is filled with phosphate buffered saline (PBS) solution. We then applied a 1 Vpeak-peak and 100 kHz frequency to the electrodes and design was meshed using free triangular extremely fine mesh with maximum element size= 5 µm and minimum element size= 0.026 µm. Then the electric field gradient and normalized electric field strength pattern were calculated in X-Y plane. Finally, variations of electric field gradient were plotted along contours to see the variation of the field gradient in the device. From these calculations, maximum electric field gradient is 1.09 x10¹⁶ V2/m3 and this electric field gradient will generate µN DEP force on cells and beads [1]. In comparison with other forces acting on the cell such as viscous drag and buoyancy (these forces are sub µN for the flow rate and cells that we use), DEP force is significantly large. Therefore, these electrodes are suitable for high-throughput cell isolation applications.
We then fabricated the electrodes using standard photolithography process following by metal deposition and lift-off process [15]. The images of the fabricated electrodes were shown in “Figure. 4(a,b, and c)”.
4.2. Design and fabrication of microfluidics channels
The proper design is needed to achieve the maximum recovery of the target cells. To capture target cells without losing, we calculated the maximum flow rate that we will use in experiments.
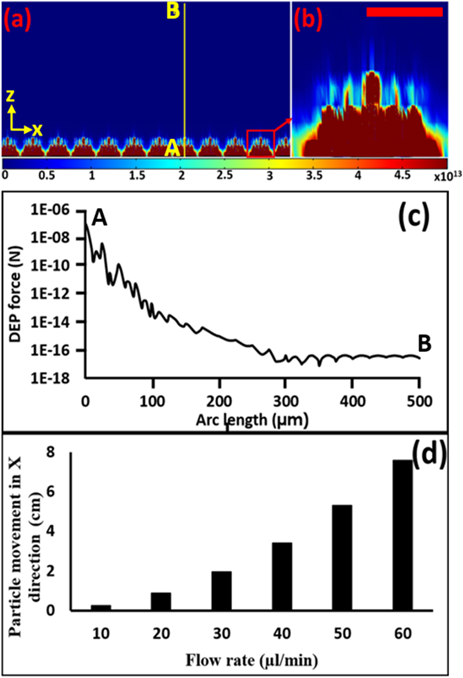
Figure 3: Calculated Electric field gradient in z direction. (a) Electric field gradient pattern in x-z plane in V2/m3, (b) enlarged image of the electric field gradient of a single electrode cell trap in V2/m3 (scale bar indicates 25µm), (c) variation of DEP force along the contour A-B in “Figure. 2(a)”, (d) the variation of flow rate vs. distance travelled by the cell (at z=400 µm) in the x direction when it travel from 400 -0 µm under the influence of DEP.
To estimate the flow rate, first, we calculated the DEP force on a 20µm diameter cell (or bead) in the z direction along the contour A-B (“Figure. 3(a)”). We used , and calculated the DEP force using equation (1) and plotted in “Figure. 3(c)” [18-20]. For more stringent conditions, we have calculated the critical dimensions of the device needed to capture the cells that are about 400 µm above the electrodes. We have used the DEP force at 400 µm as and assumed all other forces acting (e.g. buoyancy and weight) on the cell at 400 µm in the vertical direction are zero. We selected the particle speed to be 1.5 times faster than the flow speed of the fluid and calculated the fluid drag force [28]. Using this information, we calculated the horizontal distance travelled by the cell during trapping. Then we varied the flow rate and calculated distance travelled for each flow rate. The results are indicated in the “Figure. 3(d)”. From this calculation, at 30 µl/min flow rate, the target cell will move about 1.9 cm, which is less
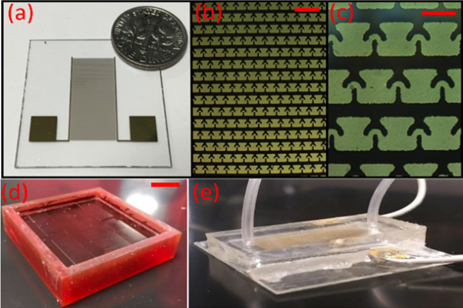
Figure 4: Fabrication of the device. (a) a picture of a fabricated electrode, (b) 10X zoomed view of the electrode under the microscope, showing the electrode array (scale bar indicates 200µm) (c) 30X zoomed image of the electrode showing individual traps (scale bar indicates 80µm), (d) Picture of the mold used for fabricating microfluidic channels (scale bar indicates 1.5cm), (e) Picture of the final version of the cell separation device.
than the length of our electrode dimension (2 cm). Therefore, theoretically, all the target cells that are below 400µm will be captured in the device.
To fabricate the microfluidics channel, we have utilized the standard microfluidics channel fabrication using PDMS (Polydimethylsiloxane) [16-17]. Briefly, microfluidics channels were designed in AutoCAD and fabricated a mold (3D printing: Proto Labs, Inc.2600 Niagara Ln N, Plymouth, MN 55447), “Figure. 4(d)” indicate the mold used in fabricating the microfluidics channel. We then mixed Sylgard 184 elastomor with curing agent (10:1) and poured over the mold. Finally, the mold with PDMS was cured by keeping on a hotplate (at 80°C) for 3-4 hours. After curing, PDMS was peeled off from the mold and inlet and outlet holes were drilled using a biopsy punch. Then, PDMS channels and electrodes were bonded using oxygen plasma [27]. Finally, the micro-bore tube with inner diameter 0.04 inches and outer diameter 0.07 inches were glued using the epoxy glue at the inlet and the outlet of the microfluidic device for the purpose of flowing the cell mixture. Final version of the device is indicated in “Figure. 4(e)”. We then used the fabricated microfluidics device in the experiments and demonstrated the DEP based cell-trapping. Details about those experiments is discussed below.
5. Experimental Setup
Our first experiment were focused on to validate the cell isolation using positive DEP and negative DEP. We then studied how these forces can be used to precisely control the number of cells in a trap. We started with polystyrene beads and determined the experimental conditions (electric field magnitude and frequency) needed to isolate beads. We then use these conditions as the starting point for isolating cells. We used 500 nm diameter green fluorescence polystyrene beads to represent the trapping of smaller cells (e.g.: bacteria) and 20 µm diameter polystyrene beads to represent mammalian cells.The bead samples were prepared in following manner. 1 ml sample was prepared with 500 nm green fluorescence beads by adding 20 µl of beads solution and 980µl of 0.01XPBS solution (conductivity= 0.03 S/m). We then mounted the microfluidics device on the fluorescence microscope stage, bead sample was directly pipetted on to the electrodes or loaded to the syringe and connected to the syringe pump (flow rate= 30 µl/min, Braintree Scientific INC, BS-300). When the beads are over the electrodes, an external electric field was applied (frequency =100 kHz, and magnitude= 5 Vpp, Tektronix AFG 3021B)
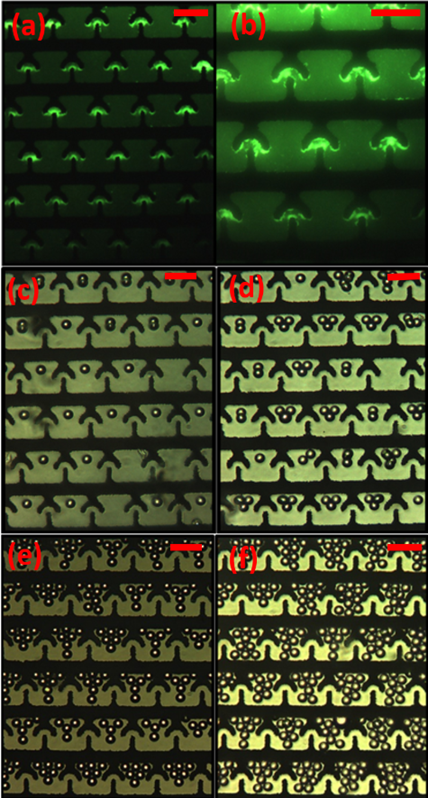
Figure 5: Experimental results. (a and b) results of the experiment with 500 nm green fluorescence polystyrene beads under the fluorescence microscope with 20X and 30X magnification respectively,(c,d,e and f) results of the experiment with 20 µm polystyrene beads under the microscope with 20X magnification. Scale bars indicate 80µm.
and observed the beads trapping. The pictures of trapped beads are shown in (“Figure. 5(a, and b)”). Similarly, we repeated this experiment for 20 µm beads and studied the beads trapping with (repulsive) negative and (attractive) positive DEP. The starting point of our experiments with 20 µm beads was 1 MHz (frequency) and 1.5 Vp-p (magnitude). For the 20 µm beads, we flowed the sample (30 μL/min), but it was unable to trap multiple beads in a single-trap. Therefore, for trapping multiple beads we use the static condition (sample flow rate=0 μL/min). The “Figure. 5(c,d,e,and f)” indicate the some of our results that demonstrate how we used DEP (negative) to vary the number of beads in a trap. We will discuss this in detail below.
6. Results
The “Figure 5(a, and b)” shows the trapping of 500 nm beads using positive DEP (100 kHz and 5 Vp.p). The Figure 5(b) is the magnified view of the Figure 5(a) that demonstrate the DEP based trapping. We then varied the frequency of the electric field from 100 kHz to 15 MHz but did not observe the trapping through negative DEP. For 20 µm beads, we observed that it is indeed possible to trap beads using only negative DEP. Further, with negative DEP, it is also possible to vary the number of beads trapped by simply changing frequency and the concentration of beads. “Figure 5(c, d, e and f)” indicates some of the results from those experiments. Briefly conditions that we used for trapping 20 µm beads are summarized in the table 1 below. Our conclusions from this study are summarized below.
| Concentration of beads(beads/ml) x103 | Applied Frequency (MHz) | Average number of beads per trap | Standard deviation |
| 90 | 1 | 1 | 0.071 |
| 180 | 8 | 3 | 1.000 |
| 540 | 15-18 | 6 | 1.035 |
| 1440 | 20-22 | 8 | 1.760 |
| 1800 | 24-25 | 10 | 2.407 |
Table 1: Trapping results of 20 μm beads using negative DEP.
7. Conclusion
We have successfully designed and fabricated an electrode for efficient cell trapping. Experiments were performed using two sizes of beads to demonstrate the usage of negative and positive DEP in trapping and clustering beads. Clustering can be used to count number of cells in the sample or culturing the trapped cells. For 500 nm beads, we did not see controllable trapping with both negative and positive DEP. For 20 µm beads, negative DEP produced controllable trapping. Our next step is to use the cells and demonstrate cell trapping with our device. Finally, we will use the device to develop assays based on cell trapping [21-22]. The results from those experiments will be published in forthcoming articles.
Acknowledgment
We are grateful for the financial support from Richard Offerdahl research grant. We would like to thank Vidura Jayasooriya, Bharat Verma, Darrin Laudenbach and Jenna Pender in the Department of Electrical and Computer Engineering at the North Dakota State University for their help in developing 3D AutoCAD models and fabrication of the microfluidic device (PDMS) molds. We also thank the staff of the Center for Nanoscience and Engineering at the North Dakota State University for their help in fabricating electrodes.
- Velmanickam, and K.Nawarathna, “Dielectrophoretic cell isolation in microfluidics channels for high-throughput biomedical applications”, in IEEE International Conference on Electro Information Technology (EIT), Grand folks, ND, USA, 2016.
- L.Doh and Y-H Cho, “ A continuous cell separation chip using hydrodynamic dielectrophoresis (DEP) process”, Sensors and Actuators A 121,2005.
- Gross, J. Schoendube, S. Zimmermann, M. Steeb, R. Zengerle, and P. Koltay, “Technologies for Single-Cell Isolation.” International Journal of Molecular Sciences, vol. 16,16897-16919, 2015.
- A. Bonner, H.R Hulett, R.G Sweet and L.A Herzenberg, “Fluorescence Activated Cell Sorting”, the review of scientific instruments, vol. 43,404-409, 1972
- Miltenyi, W. Muller, W. Weichel, and A. Radbruch, “ High Gradient Magnetic Cell Separation With MACS”, Cytometry, vol.11, 231-238, 1990.
- Fend, and M. Raffeld, “Laser capture microdissection in pathology”, Journal of Clinical Pathology, vol.53, 666-672, 2000.
- Pethig, “Dielectrophoresis: Status of the theory, technology and applications”, Bio microfluidics, vol.4, 022811, 2010.
- R.C.Gascoyne, X. B Wang, Y. Huang and F. F.Becker, “Dielectrophoresis Separation of Cancer Cells from Blood”, IEEE Transactions on Industrial Applications, vol. 33, 670-678, 1997.
- Nakano and A. Ros, “Protein Dielectrophoresis: Advances, Challenges and Applications”, Electrophoresis, vol. 34, 1085-1096, 2013.
- Demierre, T. Braschler, R. Muller, P. Renaus, “Focusing and continuous separation of cells in a microfluidic device using lateral dielectrophoresis”, Sensors and Actuators B, vol. 132, 388-396, 2008.
- Ermolina and H. Morgan. “The electrokinetic properties of latex particles: Comparison of electrophoresis and dielectrophoresis”, Journal of Colloid and Interface Science, vol. 285, 419-428, 2005.
- Zheng, J. P.Brody, P. J.Burke, “Electronic manipulation of DNA, proteins, and nanoparticles for potential circuit assembly”, Biosensors and Bioelectronics, vol.20, 606-619, 2004.
- Huang, S. Joo, M. Duhon, M. Heller, B. Wallace, and X. Xu, “Dielectrophoretic Cell Separation and Gene Expression Profiling on Microelectronic Chip Arrays”, Analytical Chemistry, vol.74, 3362-3371, 2002.
- R. Gagnon, “Cellular dielectrophoresis: Applications to the characterization, manipulation, separation and patterning of cells”, Electrophoresis, vol. 32, 2466-2487, 2011.
- Lu, M. A. Schmidt, & K. F. Jensen “A microfluidic electroporation device for cell lysis” Lab on a Chip, vol. 5, 23-29, 2004.
- H. Kim, Y. Ciu, M. J. Lee, S-W. Nam, D. Oh, S. H. Kang, Y. S. Kim, and S. Park, “ Simple fabrication of hydrophilic nano-channels using the chemical bonding between activated ultrathin PDMS layer and cover glass by oxygen plasma”, Lab Chip, vol.11, 348-353, 2011.
- Bhattacharya, A. Datta, J. M.Berg, and S. Gangopadhyay, “ Studies on Surface Wettability of Poly(Dimethyl) Siloxane (PDMS) and Glass Under Oxygen-Plasma Treatment and Correlation With Bond Strength”, Journal Of Micromechanical System, vol.14, 590-597, 2005.
- Nawarathna, T. Turan, and H. Kumar Wickramasinghe, “Selective probing of mRNA expression levels within a living cell”, Applied Physics Letters, vol.95, 083117, 2009.
- Hao Zhou, Matthew A. Preston, Robert D. Tilton, Lee R. White, “Calculation of the electric polarizability of a charged spherical dielectric particle by the theory of colloidal electrokinetics”, Journal of Colloid and Interface Science, 285, 845-856, 2005.
- Ronald Pethig, “Review Article—Dielectrophoresis: Status of the theory,technology, and applications”, BioMicrofluidics, vol.4, 022811, 2010.
- Rosenthal, A. Macdonald and J.Voldman, “ Cell patterning chip for controlling the stem cell Microenvironment”, Biomaterials, vol.28, 3208-3216, 2007.
- S. Kane, S.Takayama, E. Ostuni, D.E. Ingber, and G.M Whitesides, “ Patterning proteins and cells using soft lithography”, Biomaterials, vol.20, 2363-2376, 1999.
- J.Beebe, G.A.Mensing, and G.M.Walker, “Physics and applications of microfluidics in biology”, Annu.Rev.Biomed.Eng, vol.4, 261-286, 2002.
- L.Paguirigan, and David J.Beebe, “Microfluidics meet cell biology, bridging the gap by validation and application of microscale techniques for cell biological assays”, BioEssays, vol.30.9, 811-821, 2008.
- B.Weibel and G.M.Whitesides, “Applications of microfluidics in chemical biology”, Science Direct, vol.10, 584-591, 2006.
- Jayasooriya and D.Nawarathna, “ Design of Micro-interdigitated Electrodes and Detailed Impedance Data Analysis for Label-free Biomarker Quantification” Electroanalysis, vol 28, DOI: 10.1002/elan.201600364, 2016
- Xiong, Liangcai, Peng Chen, and Quansheng Zhou. “Adhesion promotion between PDMS and glass by oxygen plasma pre-treatment. Journal of Adhesion Science and Technology, vol.28, 1046-1054, 2014.
- Jacques Magnaudet and Dominique Legendre, “ The viscous drag force on a spherical bubble with a time-dependent radius”, Physics of fluid, Vol.10, 550-554, 1998.