A Web-Based Decision Support System for Evaluating Soil Suitability for Cassava Cultivation
A Web-Based Decision Support System for Evaluating Soil Suitability for Cassava Cultivation
Volume 2, Issue 1, Page No 42-50, 2017
Author’s Name: Adewale Opeoluwa Ogundea), Ajibola Rasaq Olanbo
View Affiliations
Department of Computer Science, Redeemer’s University, Osun State, 234, Nigeria
a)Author to whom correspondence should be addressed. E-mail: ogundea@run.edu.ng
Adv. Sci. Technol. Eng. Syst. J. 2(1), 42-50 (2017); ![]() DOI: 10.25046/aj020105
DOI: 10.25046/aj020105
Keywords: Classification Rule Mining, Cassava Cultivation, Data Mining, Decision Support Systems, Decision Trees, Machine Learning

Export Citations
Precision agriculture in recent times had assumed a different dimension in order to improve on the poor standard of agriculture. Similarly, the upsurge in technological advancement, most especially in the aspect of machine learning and artificial intelligence, is a promising trend towards a positive solution to this problem. Therefore, this research work presents a decision support system for analyzing and mining knowledge from soil data with respect to its suitability for cassava cultivation. Past data consisting of some major soil attributes were obtained from relevant literature sources. This data was preprocessed using the ARFF Converter, available in WEKA. 70% of the data were used as training data set while remaining 30% were used for testing. Classification rule mining was carried out using J48 decision tree algorithm for the data training. ‘If-then’ construct models were then generated from the decision tree, which was used to develop a system for predicting the suitability status of soil for cassava cultivation. The percentage accuracy of the data classification was 76.5% and 23.5% for correctly classified and incorrectly classified instances respectively. Practically, the developed system was esteemed a prospective tool for farmers, soil laboratories and other users in predicting soil suitability for cassava cultivation.
Received: 05 December 2016, Accepted: 15 January 2017, Published Online: 28 January 2017
1. Introduction
The process of evaluating a land for its suitability for crop cultivation is highly important for the farmers to have a pre-knowledge about the given piece of land. According to [1], the major constraints inherent in crop production in Nigeria are the imbalance and deficiencies of nutrients. There exists the urgency in the need to assess the suitability of a farmland purposefully for agricultural practice to boost crop yield. Often, the stakeholders – the farmers being negligent of the nutrient composition of a soil, do engage in cultivating the soil for agriculture. Research has shown that due to such poor management and system of agriculture specifically in most developing countries, most soils had been rendered infertile. Some due to adverse climatic condition had been negatively affected leaving them leached of nutrients. Agricultural practices in the country are immensely suffering from lack of technological method to enhance performance and productivity in crops cultivation. The manual existing system employed by major players, that is, the local farmers had proved inefficient. One of the areas where the manual methods had proved inefficient is the stage where one needs to make some cogent decision as to what to do to produce a maximum yield of a particular crop on a given piece of land. The farmers often time had been put in a state of dilemma in the place of decision making. This research work is therefore geared towards proffering a worthwhile system of decision making with a specific focus on one of the most important entity in agriculture – the soil and its suitability for cassava cultivation, as a case study.
Recently, cassava production attained some level of prominence in terms of its positive impact locally, serving as a means for staple food crop, and employment opportunities. Besides, its potential in increasing the nation’s Gross Domestic Product (GDP) cannot be over-emphasized. In the recent times, similar research works had been done to cater for some of these inefficiencies, each employing different methodology. A robust and an efficient decision support system (DSS) in this area will not only support the farmer’s decision making but also improve marginally the quality and quantity of farm produce. Reviewed literatures on the topic of soil suitability for cassava production had revealed an expanse of various analyzed soils parameters with respect to cassava cultivation. In this light, this paper focused on the development of a web-based decision support system for evaluating agricultural soil suitability for cassava cultivation using a classification mining technique. The paper is aimed at providing an improved method of soil evaluation by the farmers for cassava plantation with respect to soil nutrients. A web-based decision support system for evaluating agricultural soil suitability for cassava plantation would be developed for easy accessibility by farmers. The paper encompasses the provision of a system for alleviating challenges inherent in making decision concerning the potential yield of a piece of farmland. Through its significant influence to the agricultural practices, the application of this system will help boost the quality and quantity of cassava crop produce..
2. Literature Review
Nigeria presently has up to 79 million hectares of arable land, which has 32 million hectares under cultivation. The farm holding is quite predominant among the smallholders, which are mostly subsistence producers accounting for 80%. The potential of both crop and livestock production has remained low. The inherent problem which crops are subjected to such as poor access, uptake of reasonable and quality seeds, and the usage of fertilizer including the poor methods of production had led to this unfavorable trend in agriculture. The vast populace is dependent on the importation of foods such as rice, wheat and fish to mention a few [2]. There is an urgent need to ensure that lands used for agricultural practices be based on its inherent capacity for sustainability and optimization for soil productivity. Senjobi [3] further emphasized this need in terms of the present and generally accepted view of the precision farming which is more particular to developing countries where land is being used without knowledge of its inherent capacity. According to Aderonke and Gbadegesin [4], a major dilemma rampant in the Nigeria agriculture is the poor knowledge couple with suitability appraisal of parcels of land for agricultural practice. Consequently, we are faced with unfortunate farm management systems, minimum yield and needless high cost of production.
The importance of the adoption of a scientific method in handling land evaluation cannot be over-emphasized in respect of assessing the inherent ability of a parcel of land for agricultural production [5]. Lin et al. [6] emphasized that having a pre-knowledge on the ability of an evaluated land aids its alleviation either ahead of or during cropping period. Assessing the performance is hinged on matching features of diverse land units in specific area with the requirements of definite or possible land use types that result in lands classification in respect of their suitability for specific crops [7]. The adoption of Soil Suitability Decision Support System in the Nigeria agricultural sector/domain will help the famers to combine data, knowledge and mathematical models gotten from literature on the production of crop to enhance decision making capabilities in their quest to obtain quality and quantity of cultivated crops [8].
The agriculture sector in Nigeria has not been able to produce to expected capacity due to the irrational use of agricultural lands and the implementation of archaic methods. Consequently, the current food security challenges have been on the increase. A promising advancement in this is decision support system to evaluate soil suitability for agricultural practices. Presently, the field lacks such decision support system [4]. A specific objective of a DSS is to assist in decision processes. Rather than automating decision making, it should support and besides adapt promptly to the changing requirements of decision makers. A knowledge-driven DSS dictates or recommend actions to users. A Knowledge-driven DSS aids in handling tasks and decisions which can be taken and respectively performed by a human expert. These tasks include classification, configuration, interpretation, diagnosis, prediction and planning. Liu et al. [9] outlined that integrating the DSS aided with knowledge management function helps the performance of the decision makers by improving their quality of services especially when human experts are not available. In addition, Alvarado et al. [10] stated that the integration of a DSS aided with knowledge management function helps in the human experts to make consistent decisions.
2.1. Soil and the Measure of its Nutritional Parameters
Research has shown that for a normal functioning and growth, plants need some important nutrients. The expectancy of the plant’s nutrients measurement is done by a method called soil sufficiency range. It is described as the range interval with respect to the soil nutrients at which a specific plant will deliver potentially as required. The individual plant species and the specific nutrient therefore determine the width of this range. Nutrient levels below or exceeding the sufficiency range consequently dictates the performance of the plants respectively. The sufficiency range can either result to nutrient deficiency or toxicity. Nutrient deficiency often times signals a low percentage of the required nutrient for a healthy and quality performance of the plant. While on the other hand, the soil is toxic when the inherent nutrient requirement for the healthy growth of a plant is considered excess. There exist seventeen chemical elements that have been acknowledged as important for the growths of plants amongst which are nitrogen, phosphorus, potassium, calcium, and so on [11]. These elements are hereby classified as major elements known as macro nutrients and minor elements known as micronutrients. Plant need macronutrients in measurable quantity (>1,000 mg kg-1) and need micronutrients in low quantity (<100 mg kg-1).
2.2. Land Evaluation
In order to minimize risk in farming, land evaluation plays the role of land use to land qualities requirements matching. The use of scientifically standardized method to match the characteristics of land resources for specific uses is known as land evaluation. Hence, knowing the suitability of a piece of land is highly important to determining the use of land resources in harmony to the best carrying ability in the agricultural development. In determining the potential areas for best agricultural development,
sustainable and balanced resource data are needed in the course of land evaluation for its suitability. Different methods of land evaluation such as Land Capability Classification [12], Storie Index [13] and Land Suitability Evaluation [14] have been developed. Basically, the rule of land evaluation deals with the discovery of the features of a specific landscape, knowing the requisite for the land desired use type and matching the two to ascertain the degree to which they match. Several approaches are being adopted in land evaluation systems namely parameters totaling system, parameters multiplying system and matching system between land worth and land characteristics with crop necessities. The Storie Index for instance utilizes parameters multiplying system, whereas Land Suitability Evaluation matches land quality and land characteristics with crop necessities.
In the non-parametric evaluation, soils were foremost positioned in suitability classes by matching their characteristics with the established requirements. The cumulative suitability classes were specified by the most restrictive feature(s) of the soil. Clearly, evaluation of land has ushered result to problem of making soil analysis information helpful to farmers and other land users [15]. Land quality is the intricate feature of lands and consists of one or more land characteristics. In considering land evaluation, the soil, climate and topography are some of the noticeable land qualities which are directly related to plant requirements [16]. Nutrient retention such as the PH, action exchange capacity, drainage, erosion hazard, flood, texture, alkalinity, and soil depth are the main soil characteristics with respect to land evaluation [3 and 15].
2.3. Land Suitability Classification
Soil suitability evaluation involves characterizing the soils in a given area for specific land use type [17]. The process of measurement and classification of land units in accordance to their suitability for a specific use is known as land suitability classification [18]. The utilization of suitability systems has immensely improved agricultural land use in the recent past. These systems in terms of their abilities have shown reasonable efforts in the evaluation and assessment of proper land for a range of crops. Conversely, a major problem to land utilization is triggered when a meager knowledge of soil suitability for agricultural practice is known. In designing a proper land utilization systems and managing practices, and also for environmental knowledge, a dependable prerequisite is soil data which are highly important for a sustainable crop production. Having established the necessity and the usefulness of soil classification and mapping for broad land utilization planning, the paramount significance to the farmer is knowing the potential inherent in growing a specific crop on a piece of land, and proffering a best practice to optimize productivity of the crop [4]. The Food and Agriculture Organization (FAO) Framework [14] combined with the parametric Riquier index [19] was adopted by Aguilar and Ortiz [20] to describe the suitability classes for land ability.
2.4. Land Suitability Evaluation (LSE) for Cassava (Manihot Esculenta Grantz) Plantation
Often, the plantation of cassava is done by poor farmers in the tropics with low inputs. Depletion of the inherent soil nutrient of a soil usually sets in under continuous cultivation. A substantial measure of nutrients are taken up by cassava, mainly potassium-K and needs a huge measure of nitrogen – N and phosphorous – P [21]. Cassava performs optimally on a wider range of soils but most preferably on permeable, friable soils with some organic matter composition and depth of 30-40cm. Not suitable on a waterlogged conditions. A PH level of 6-7 is preferred and the soil clay content should be less than 18%. It has no tolerance for saline conditions. Most of the constraints predominant with soil suitability evaluation for cultivating cassava are soil fertility, poor soil texture, structure and drainage [17].
This research work shall be taking a critical look at the aspect of the most necessary requirements of soil fertility as such the PH level of the soil, available nitrogen, phosphorous, potassium and the organic matter in respect of cassava plantation as highlighted by Isitekhale et al. [17] and Vanlauwe et al. [21]. Presently, there are various well established Agricultural DSSs. An elaborate presentation and literature done by Antonopoulou et al. [22] gave examples such as FASSET (DSS for Wheat), HADSS (DSS for Wheat), EPIC (DSS for Maize and Cowpeas) and so on. Their scope revealed their exclusiveness and limitation in handling decisions. Existing in literature are diverse narrowly oriented Agricultural DSS for management of nutrients, management of pest and scheduling irrigation [23]. Mokarram et al. [24] employed RotBoost a newly proposed ensemble classifier generation technique, which is constructed by combining Rotation Forest and AdaBoost and also adopting FAO method of suitability classes for the classification of land suitability in Shavur plain, which lies in the northern of Khuzestan Province, Southwest of Iran. This provides positive evidence for the utility of machine learning methods in land suitability classification especially Multiple Classifier System (MCS) methods. The outcomes show that RotBoost can generate ensemble classifiers with notably higher prediction correctness than either Rotation Forest or AdaBoost, which is about 99% and 88.5%, using two different performance evaluation measures.
Ramesh and Vardhan [25] identified a suitable data model that achieved a high degree of accuracy and generality in terms of their capability for predicting yield in agriculture. For this purpose, different types of Data Mining techniques were evaluated on different data sets. Gholap [26] made use of dataset collected from private soil testing laboratory in Pune, India. The datasets contain different attributes and their respective values of soil samples taken from three regions of Pune District. The dataset has 10 attributes and an aggregate of 1988 instances of soil samples. It was discovered in this research that J48 demonstrated high level of accuracy in comparison with NBTree and SimpleCart classifier, hence making it a good predictive model. Sally and Geoffrey [27] worked on a classical data mining tool has been adopted in this research work to sort mushrooms by grading into quality grades and achieving a similar accuracy attainable by inspection done by humans.
2.5. Decision Trees and J48 Algorithm
One of the most widely used machine learning algorithm is decision tree. They are potentially popular due to their adaptability to any form of data type. They are classified as supervised machine learning algorithm. The algorithm works by dividing its training data into continuous smaller parts so that patterns can be identified in order to classify the data. A clearer and logical structure like a flow chart representation is then constructed through the knowledge. The algorithm is mostly well suited for many hierarchical categorical distinctions cases. A heuristic known as recursive partitioning is at play in this
algorithm. The heuristic employs a divide and conquer approach using attribute values to split the data into smaller and smaller subsets of analogous classes. Structurally, a root node which represents the whole dataset, decision nodes which do the computation and leaf nodes which generate the classification. The decisions that are to be made for the splitting the labeled training data into its classes are learned at the training phase by the algorithm. The classification of an unknown instance works by passing the data through the tree. A comparative analysis of a specific attribute from the input data with an identified constant in the training phase is done at each decision node. At each decision node, selected feature is being compared with the predetermined constant, the decision is hinged on determining if the attribute has greater or lesser degree than the constant, therefore a two splitting is created in the tree. The data haven passed through these successive decision nodes, on getting to the leaf node is being assigned a class [28].
Among others, the four most used decision tree learning algorithms are J48, ID3, CHAID and CART. J48 algorithm was used in this work. J48 is known as an optimized version of C4.5 algorithm. The classification of any specific data item allows the data item to be divided in various levels starting from the root node to the leaf; this is done in a hierarchical approach. The process continues until it gets over the terminal node which cannot be further subdivided. Decision analysis makes use of this tree such that in this tree, every non-leaf node symbolizes a test or decision on the data item. Some certain branch will be chosen depending on the output at the level. The subdivision continues even up to the last level. The simple algorithm of the process of the J48 Decision tree classifier can be found in Kalmegh and Deshmukh [29]. The general approach employed in building a classification model is shown in figure 1.
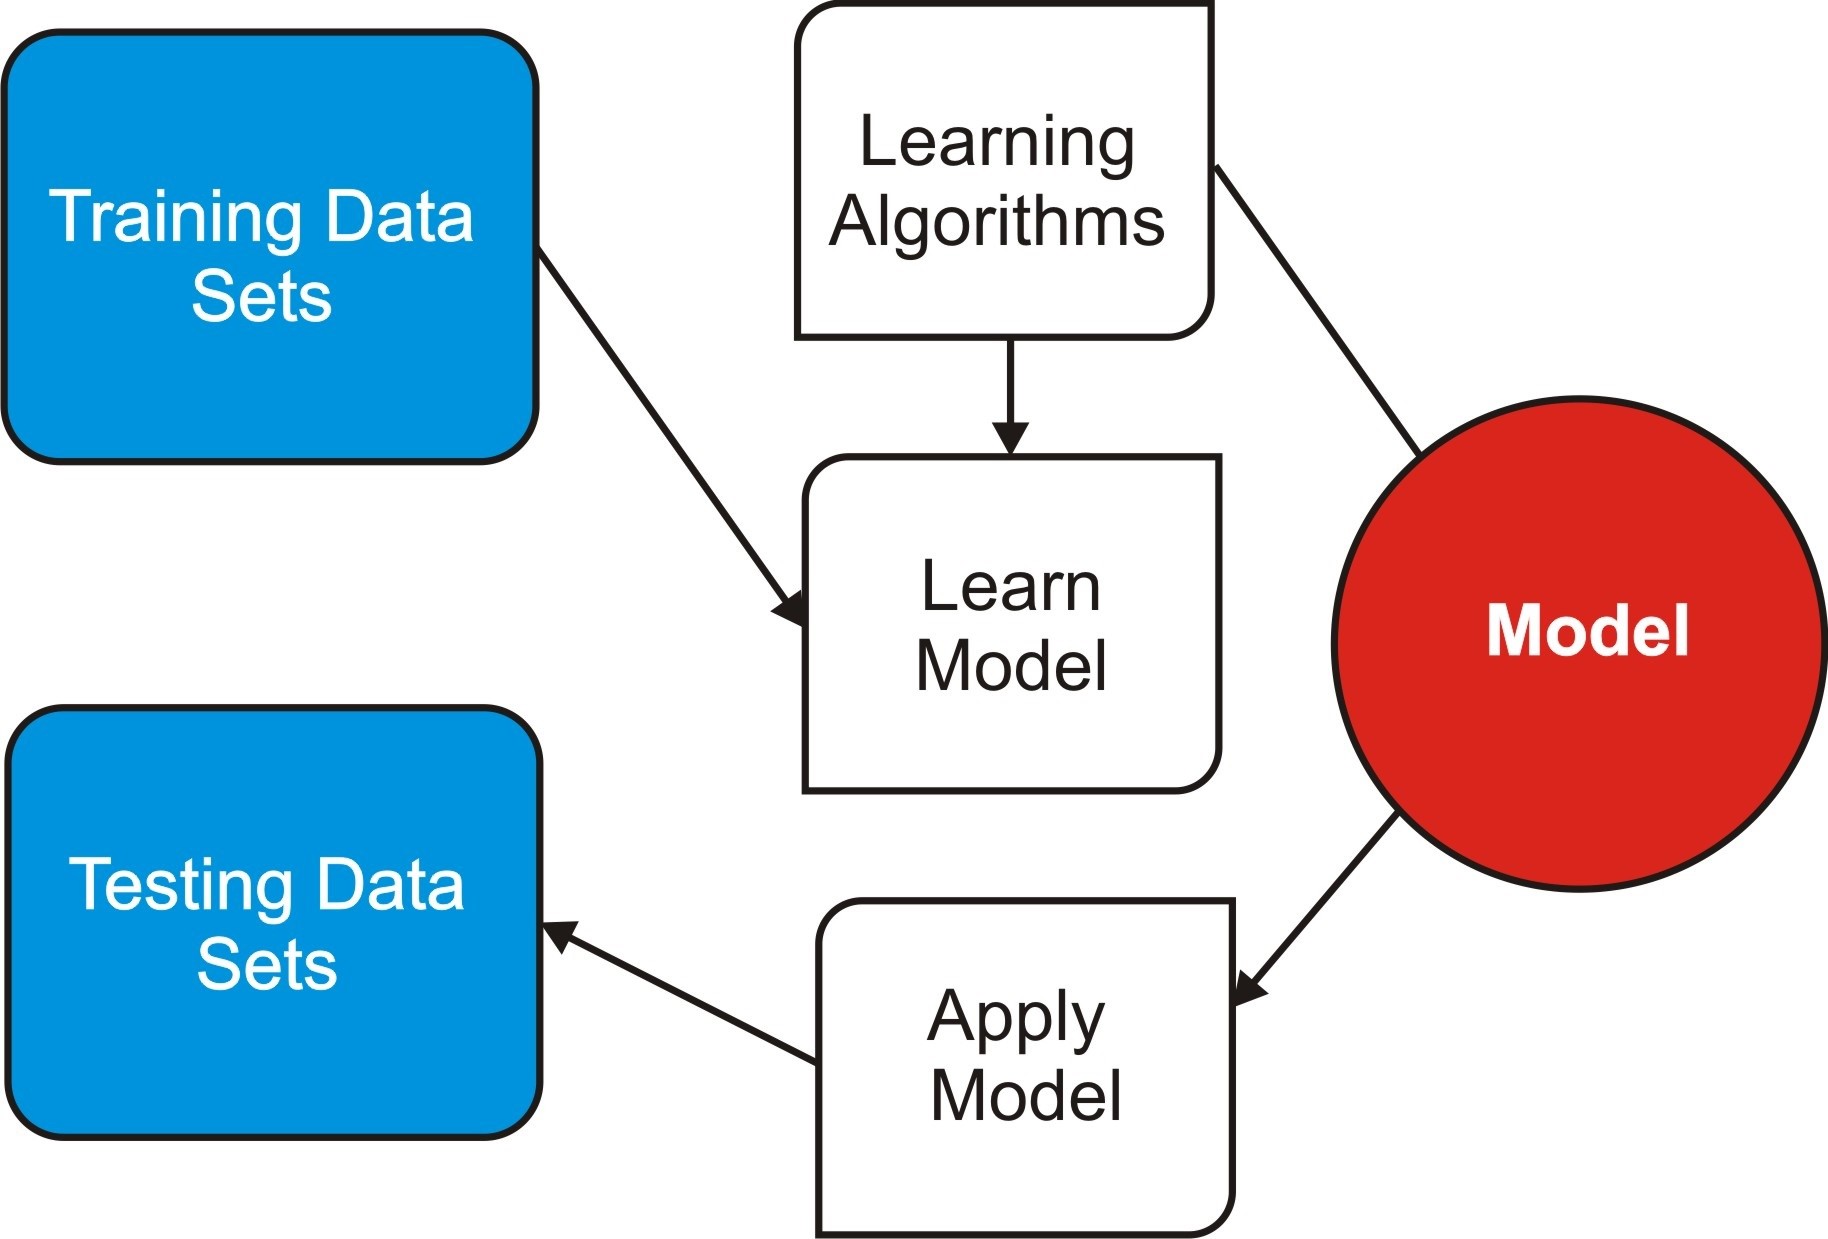
Figure 1: General approach for building a classification model
2.6. Maintaining the Integrity of the Specifications (Heading 2)
The template is used to format your paper and style the text. All margins, column widths, line spaces, and text fonts are prescribed; please do not alter them. You may note peculiarities. For example, the head margin in this template measures proportionately more than is customary. This measurement and others are deliberate, using specifications that anticipate your paper as one part of the entire proceedings, and not as an independent document. Please do not revise any of the current designations.
3. Methodology
Data used for system development was obtained from secondary sources including peer-reviewed published journals on the appropriate soil nutrient components suitable for optimal cassava cultivation. The data consisting of different soil types, cultivated under some nutritional parameters, their evaluated measure of suitability and some other factors shall be pre-processed and cleaned up to be adaptable with the J48 algorithm. The potential degree of suitability of a piece of land was predicted based on the model produced by the generated rules from the J48 decision tree learning algorithm. The system works by providing an interface for the users to input their information concerning the prospective soil. PHP Hypertext Pre-Processor was adopted to handle the server-side development due to its capability to coordinate the request – response cycle from the web browser to the server for processing.
3.1. Data Gathering, Description and Cleaning
The secondary data employed in this project were obtained from reviewed journals on soil suitability for cassava plantation [1, 30, 31 and 32]. The data contain amongst others, different type of soils, their respective chemical properties such as the nutrients composition like the NPK available, the PH values, Organic Matter, and so on. These parameters represent the most likely parameters that influence farmer’s decision concerning a given piece of land before cultivation. These data formed the basic source of data used for the analysis where each of them shows the physical and chemical properties of different farmlands. However, the nutritional requirements for cassava plantation were already presented by Howeler [33], and Sys and Debaveye [34]. In order to attain consistency, the data used in this research was calculated and converted to suit the measuring scale given by Howeler [33]. This research work basically considered some of the fundamental parameters for determining soil fertility in respect of cassava plantation. In this context, parameters such as the soil nutrient composition – available NPK, the PH value, necessary for determining crop yield in a piece of farmland. The necessary attributes such as PH, Nitrogen (N), Phosphorous (P), Potassium (K) and Organic Manure were retained for the research while other non-significant attributes were removed. The selected attributes and their possible range of values are shown in Table 1.
Table 1: Description of the featured variables for classification
(Adapted from Howeler [33])
| Variable | Description | Possible Values |
| PHV | PH Value of the soil |
P1: 4.5-7.0, P2: 3.5-4.49 P3: 0.0-3.49 P4: 7.1 – 8.0 |
| NIT | Available Nitrogen |
P1: 0.2 and Above P2: 0.1 – 0.19 P3: Less than 0.1 |
| PHO | Available Phosphorous |
P1: 10.0 and Above P2: 4.1 – 9.99 P3: 2.0 – 4.0 P4: 0.0 – 1.99 |
| POT | Available Potassium |
P1: 0.1 – 0.25 P2: 0.1 – 0.149 P3: Less than 0.1 P4 : Greater than 0.25 |
| OMA | Organic Matter composition |
P1: 2.0 – 4.0 P2: 4.1 and Above P3: 0.0 – 1.99 |
| PREDICTION | Performance Classification |
S1: Highly Suitable S2: Moderately Suitable S3: Marginally Suitable N1: Presently Not Suitable |
3.2. Data Training
In order to achieve consistency in respect of the workings of the prediction system, 70% of the collected data were used as the training data while the remaining 30% were reserved for model testing. The data was selected and converted into Attribute Relation File Format (ARFF) format using the ARFF converter plug-in in the Waikato Environment for Knowledge Analysis (WEKA) explorer. Decision trees were then generated by WEKA using the J48 algorithm. The IF-THEN rules resulting from the decision tree was inputted into the knowledge-base of the prediction system. The user on interaction via the interface simply makes a request which was utilized in matching up the in-built rules in the knowledge base, and then the prediction followed.
3.3. Design of the Prediction System
A set of rules needed for the prediction system was integrated in the knowledge base. The knowledge base was programmed to gain some domain experience; it therefore worked as an expert in that wise. The knowledge base on getting input from the user infers programmed rules, that is, rules drawn from the J48 decision tree, stored in the database and hence produces the output. The prediction system is represented in figure 2.
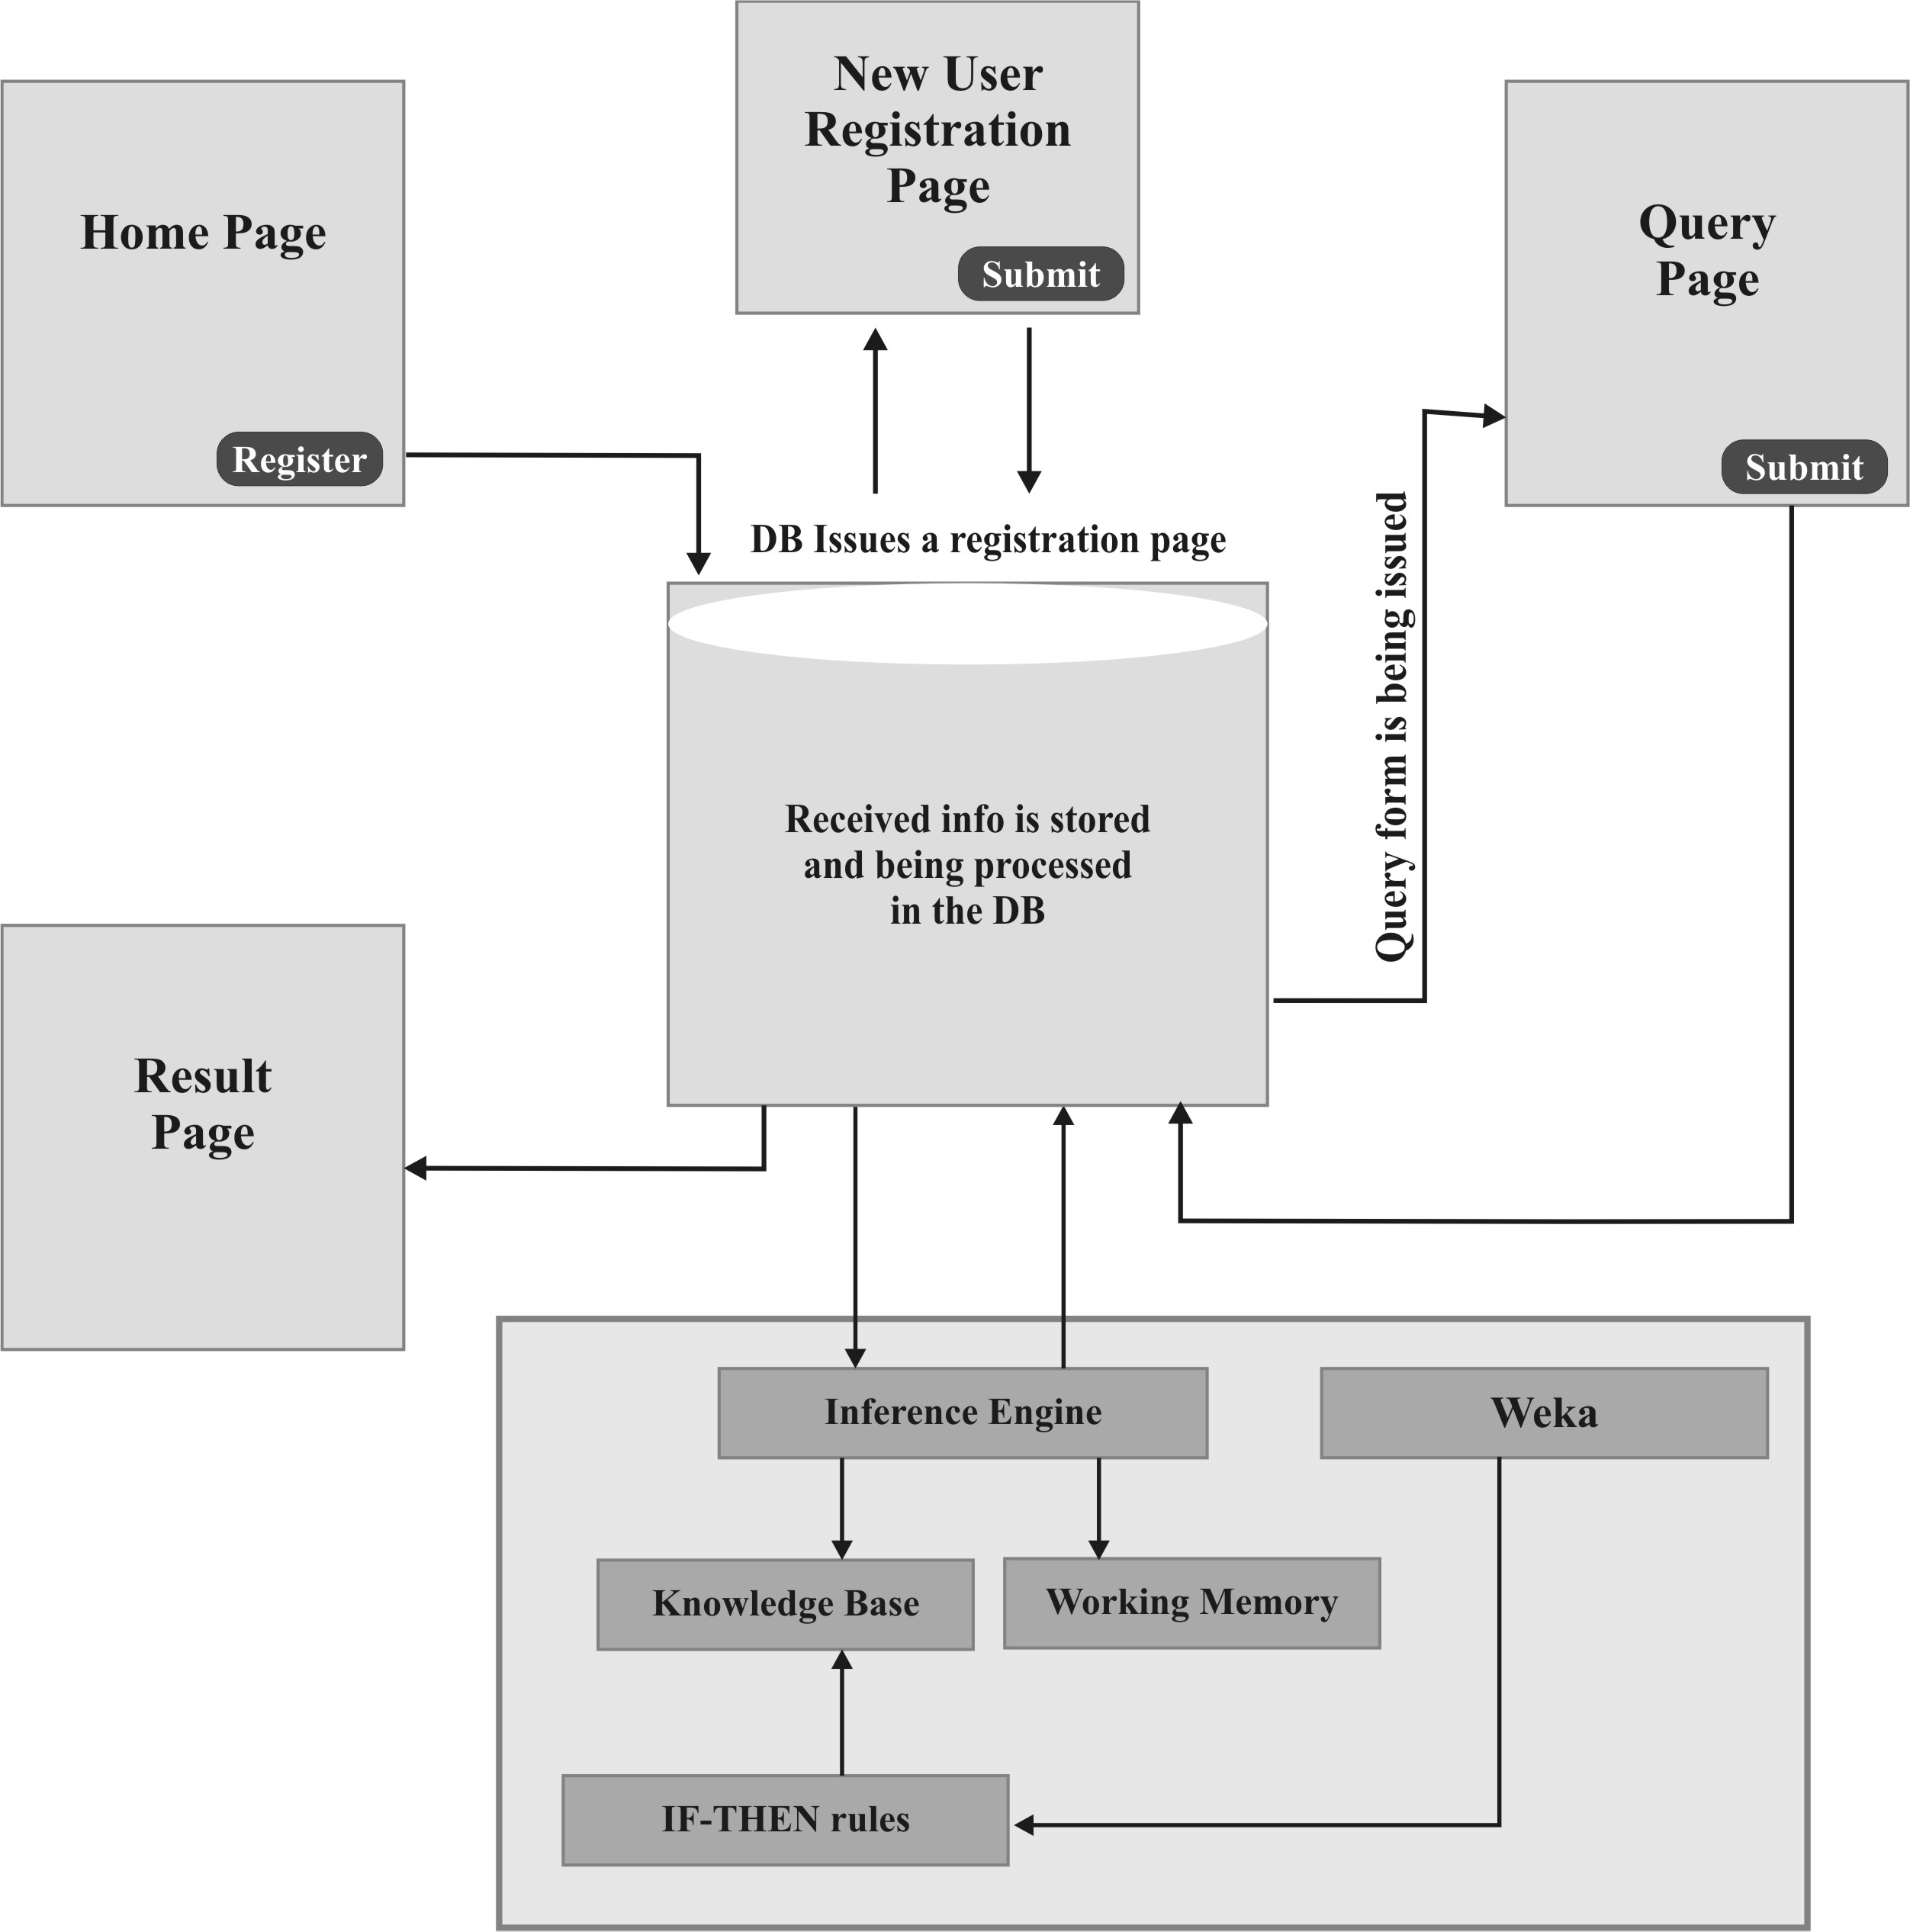
Figure 2: Architecture of the Prediction System
Explanation of major components in the system architecture is hereby provided.
Knowledge Base (KB): The repository of the prediction system domain knowledge is the KB that contains the representation IF-THEN declarative rules. The Waikato Environment for Knowledge Analysis (WEKA) is fondly suitable for the generation of these rules and contains tools for implementation of the knowledge based system.
Working Memory: This component provided the platform for the collection of information inputted by the user. The knowledge residing in the knowledge base is matched up with this information in order to infer new facts. The process continues by entering the new facts into the working memory and consequently, a conclusive fact is reached, which is also entered into the working process.
Inference Engine: This is based on the information in the working memory and the knowledge base. It goes through the rules in order to establish a match existing between their premises and information in-built in the working memory. As soon as a match is found, the conclusive fact is added to the working memory and further proceeds to search for new rules.
End-User: An individual e.g. a farmer seeking knowledge on suitability of available soil initiates a request in order to acquire advice from the prediction system.
4. Implementation and Results
In implementing the system, the following tools were employed: JDK 1.8.0, NetBeans IDE 8.1 and WEKA3.6.9 Explorer for data training and decision tree generation using J48 Algorithm. MySQL version 5.6.2 was used for data management. All algorithms take their input in the form of a single relational
table in the ARFF format, which could be read from a file or generated by a database query. The research adopted J48 algorithm from WEKA Explorer for the classification process.
4.1. Model Construction for J48 Decision Tree
The data used in this research work was first preprocessed using the ARFF converter in WEKA after which the preprocessed data was trained. The essence of this is to put the data and its attributes in a format acceptable by WEKA for the classification process. The preprocessing panel of WEKA enabled the import of a data from a database. The data which was in ARFF format was preprocessed using filtering algorithm which was usually used to transform the data from one format to another; for instance the numeric attributes in the data could be transformed into discrete ones. Instance and attributes that were discovered irrelevant were also be deleted. Figure 3 shows the results of the preprocessed data. For instance, for PH values, there are seventeen instances with fifteen distinct values. The data type is numeric with thirteen unique values. Minimum PH value is 4.5. Maximum PH value is 7.3. Mean of the PH data is 5.746 while the standard deviation is 0.696.
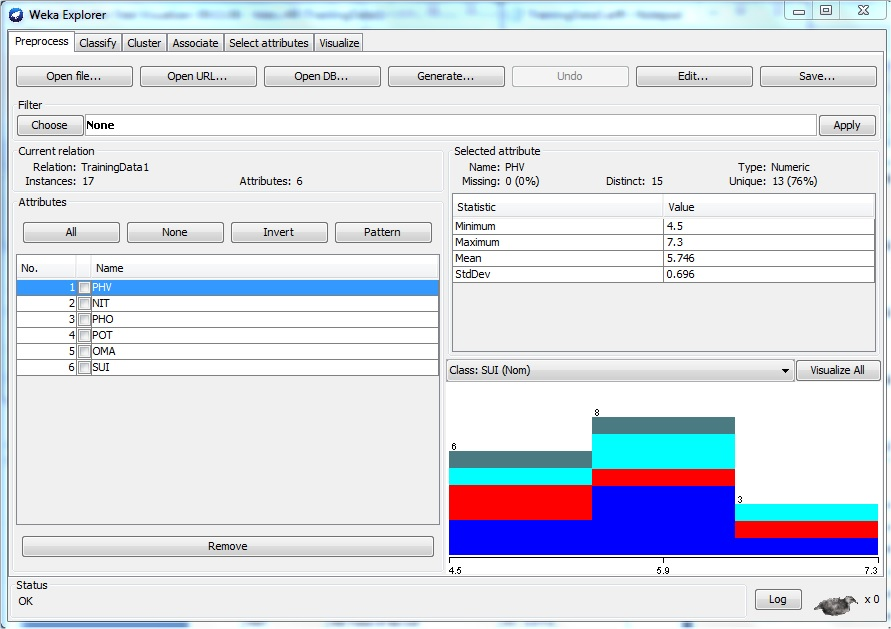
Figure 3: WEKA Interface showing the preprocessed data
After data pre-processing, classification of the data was done using J48 algorithm under the classify panel tab of the WEKA Explorer as shown in Figure 3. J48 had been found to be a very effective classifier for similar works as earlier reported in section 2.4 of this work. It is as an optimized version of C4.5 algorithm. The classification of any specific data item allows the data item to be divided in various levels starting from the root node to the leaf; this is done in a hierarchical approach. The process continues until it gets over the terminal node which cannot be further subdivided. Decision analysis makes use of this tree such that in this tree, every non-leaf node symbolizes a test or decision on the data item. Some certain branch will be chosen depending on the output at the level. The subdivision continues even up to the last level. Graphical visualization of the model was achieved with a decision tree, which is a powerful technique used in handling real world problems through classifying the problem into a tree formation and applying the control rules over the internal nodes. Two dimensional (2D) plots of current relation were visualized via the Visualize panel tab in Figure 3 in order to have a pictorial view of the model and the resulting model visualization for the six major soil attributes used is displayed in figure 4.
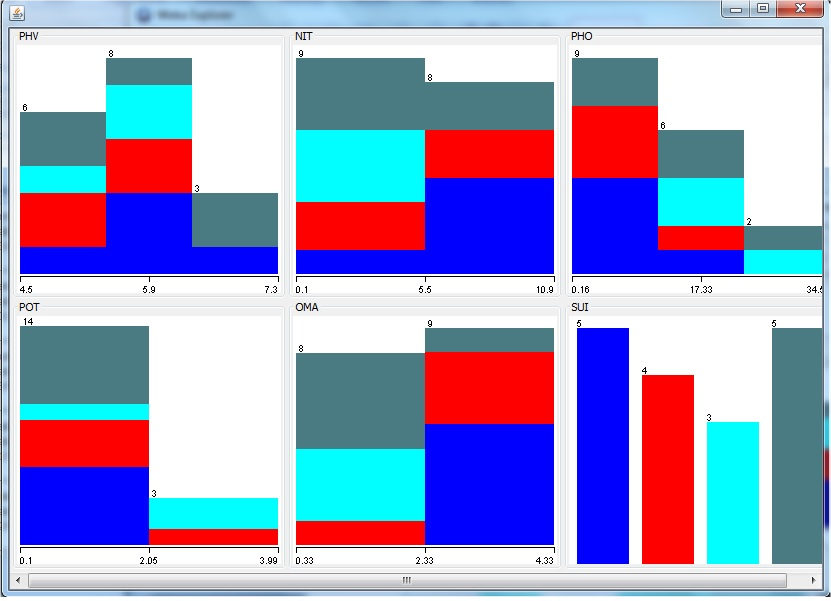
Figure 4: Model visualization of the data classification
After chosen the J48 classifier, the test options were set as user training set and the set of rules generated and the result of the classifier are shown in figures 5 and 6 respectively. Figure 5 showed that seventeen instances of the data were classified with a total of six attributes. The number of leaves was 5
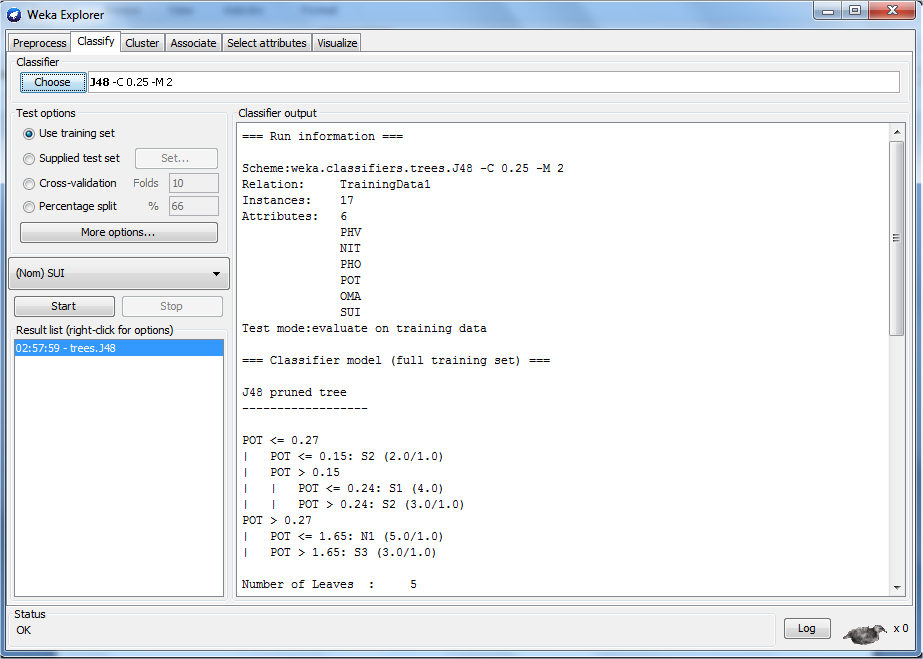
Figure 5: J48 decision rules generated
Figure 6 showed that the time taken to build the model was 0.02 seconds with 76.47% of the data reported as correctly classified instances while 23.52% were incorrectly classified. Detailed accuracy by class in terms of true positive rates, false positive rates, precision, recall, f1-measure, ROC Area, confusion matrix and others were also reported
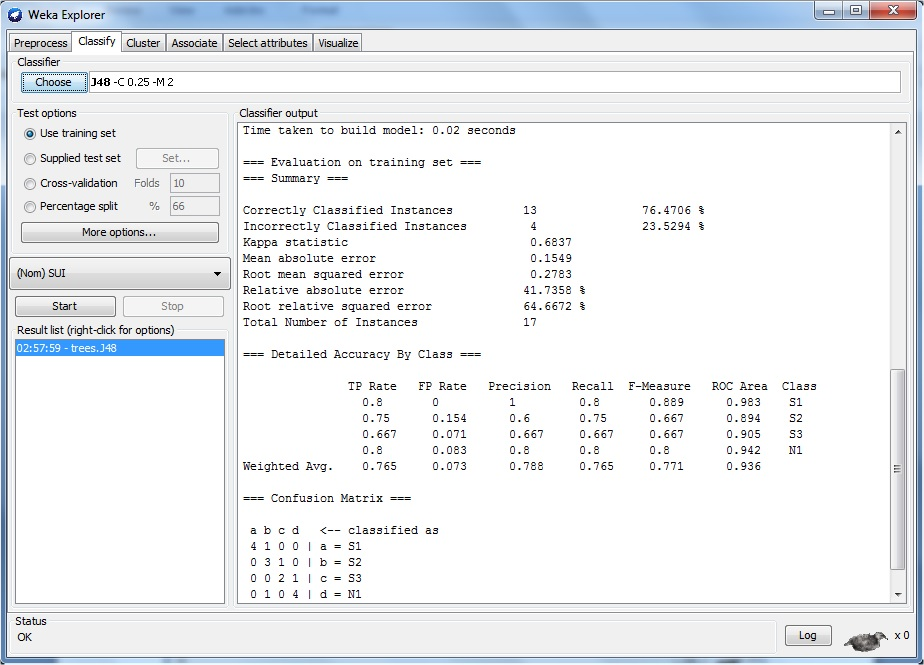
Figure 6: Result of the classifier
In figure 6, the kappa statistic was 0.6837, which showed agreement of prediction with true class. Mean Absolute Error (MAE) was 0.1549, which measured the average magnitude of the errors in the model, without considering their direction. It measured accuracy for continuous variables. It is the average over the verification sample of the absolute values of the differences between the forecasted and the corresponding observation in the model. The value meant that all the individual differences are weighted equally in the average. Root mean squared error (RMSE) was 0.2783, which was a quadratic scoring rule that measured the average magnitude of the error. It is the difference between the predicted and corresponding observed values when they are each squared and then averaged over the sample. The value gave a relatively high weight to large errors. The small errors reported by the model also confirmed that the model is predicting very well. Usually, the RMSE will always be larger or equal to the MAE; the greater difference between them, the greater the variance in the variance in the individual errors in the sample. If the RMSE is equal to MAE, then all the errors are of the same magnitude, which was not the case in this model.
The average true positive rate was 0.765; this represented the correct predictions, which were the number of sample predictions that were truly positive. Also, the average false positive rate was 0.073; this represented the number of samples predicted positive that were actually negative. Recall is the total positive rate (also referred to as sensitivity), that is, what fraction of those that are actually positive were predicted positive, which gave an average of 0.765. Precision is the fraction of those predicted positives that were actually positive, which had an average of 0.788. These very positive values reported by the model implied that the model was predicting with high level of accuracy. The F1 score was 0.771, which showed that recall and precision were evenly weighted. The ROC values and the confusion matrix also scaled very well, supporting the efficacy of the model in predicting new cases of soil suitability. After the classification of the data was done by the J48 classifier, the WEKA classifier tree visualizer was used to generate a decision tree for the model. A portion of the decision tree produced is as shown in figure 7.
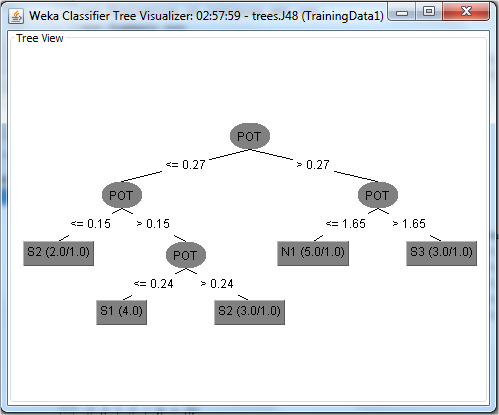
Figure 7: Part of the decision tree produced
4.2. Knowledge Representation and Interpretation of Results
The knowledge represented by the decision tree was extracted and represented in the form of IF-THEN rules as shown in Table 2. For example, the first rule means that If PH Value of the soil is between 4.5 – 7.0, and Nitrogen component of the soil is 0.2 or more, and Phosphorus component is 10.0 or more, while Potassium component is between 0.15 – 0.25, and the organic matter composition of the soil is between 2.0 – 4.0, then the system predicts that the soil is “Highly Suitable” for cassava cultivation.
Table 2: A presentation of the IF-THEN rules derived from the decision tree
| IF PHV = “4.5 – 7.0” and NIT = “0.2 and above and PHO = “10.0 and Above and POT = “0.15 – 0.25” and OMA = “2.0 – 4.0”, THEN PREDICTION = Highly Suitable |
| IF PHV = “4.5 – 7.0” and NIT = “0.2 and above and PHO = “4.1 – 9.99” and POT = “0.1 – 0.149” and OMA = “4.1 and Above”, THEN PREDICTION = “Moderately Suitable” |
| IF PHV = “4.5 – 7.0” and NIT = “0.2 and above and PHO = “10.0 and Above” and POT = “Greater than 0.25” and OMA = “2.0 – 4.0”, THEN PREDICTION = “Moderately Suitable” |
| IF PHV = “4.5 – 7.0” and NIT = “0.2 and above and PHO = “10.0 and Above” and POT = “Greater than 0.25” and OMA = “0.0 – 1.99”, THEN PREDICTION = “Presently Not Suitable” |
| IF PHV = “4.5 – 7.0” and NIT = “0.1 – 0.19” and PHO = “10.0 and Above” and POT = “0.1 – 0.15” and OMA = “2.0 – 4.0”, THEN PREDICTION = “Presently Not Suitable” |
| IF PHV = “7.1 – 8.0” and NIT = “0.1 – 0.19” and PHO = “10.0 and Above” and POT = “Greater than 0.25” and OMA = “0.0 – 1.99”, THEN PREDICTION = “Presently Not Suitable” |
| IF PHV = “4.5 – 7.0” and NIT = “0.2 and Above” and PHO = “0.0 – 1.99” and POT = “Greater than 0.25” and OMA = “0.0 – 1.99”, THEN PREDICTION = “Presently Not Suitable” |
| IF PHV = “4.5 – 7.0” and NIT = “0.2 and Above” and PHO = “10.0 and Above” and POT = “Greater than 0.25” and OMA = “0.0 – 1.99”, THEN PREDICTION = “Marginally Suitable” |
| IF PHV = “4.5 – 7.0” and NIT = “0.1 – 0.19” and PHO = “10.0 and Above” and POT = “Greater than 0.25” and OMA = “2.0 – 4.0”, THEN PREDICTION = “Marginally Suitable” |
| IF PHV = “4.5 – 7.0” and NIT = “0.1 – 0.19” and PHO = “4.1 – 9.99” and POT = “0.15 – 0.25” and OMA = “2.0 – 4.0”, THEN PREDICTION = “Marginally Suitable” |
| IF PHV = “4.5 – 7.0” and NIT = “0.2 and Above” and PHO = “10.0 and Above” and POT = “Greater than 0.25” and OMA = “0.0 – 1.99”, THEN PREDICTION = “Marginally Suitable” |
| IF PHV = “4.5 – 7.0” and NIT = “0.2 and Above” and PHO = “0.0 – 1.99” and POT = “Greater than 0.25” and OMA = “0.0 – 1.99”, THEN PREDICTION = “Presently Not Suitable” |
| IF PHV = “4.5 – 7.0” and NIT = “0.2 and Above” and PHO = “10.0 and Above” and POT = “Greater than 0.25” and OMA = “2.0 – 4.0”, THEN PREDICTION = “Marginally Suitable” |
| IF PHV = “4.5 – 7.0” and NIT = “0.2 and Above” and PHO = “2.0 – 4.0” and POT = “0.1 – 0.149” and OMA = “2.0 – 4.0”, THEN PREDICTION = “Moderately Suitable” |
4.2.1. The Prediction System
The prediction system consists of a graphical user interface that allow the users interact with the system and make necessary predictions concerning the suitability of available soil for the cultivation of Cassava. Firstly, it includes the user’s registration page, which provides a platform where new users can input their details and get registered before they can gain access to the prediction system. The user registration page also displays the registration form, which collects the users’ details. The second page is the login page, which is an interface where existing users can easily input their login details and can easily gain access to the prediction application. After the user has gained access into the system, the prediction interface then pops up. The prediction interface shows the actual page where users can input soil parameters and query the system in order to make predictions concerning the suitability of the soil for cassava cultivation. Preset values available for selection by the user in the prediction interface were already described in Table 1. The final outcome of any prediction usually includes one of the following: highly suitable, moderately suitable, marginally suitable and presently not suitable.
4.3. System Testing
The developed system was tested using 30% of the collected data to ensure that the system met the proposed objectives. The results for different runs of the system using input values from the test data set are presented showed that soil could be marginally suitable or moderately suitable or highly suitable or presently not suitable. Figure 8 is a sample case of the situation when the soil was predicted to be highly suitable for cassava cultivation.
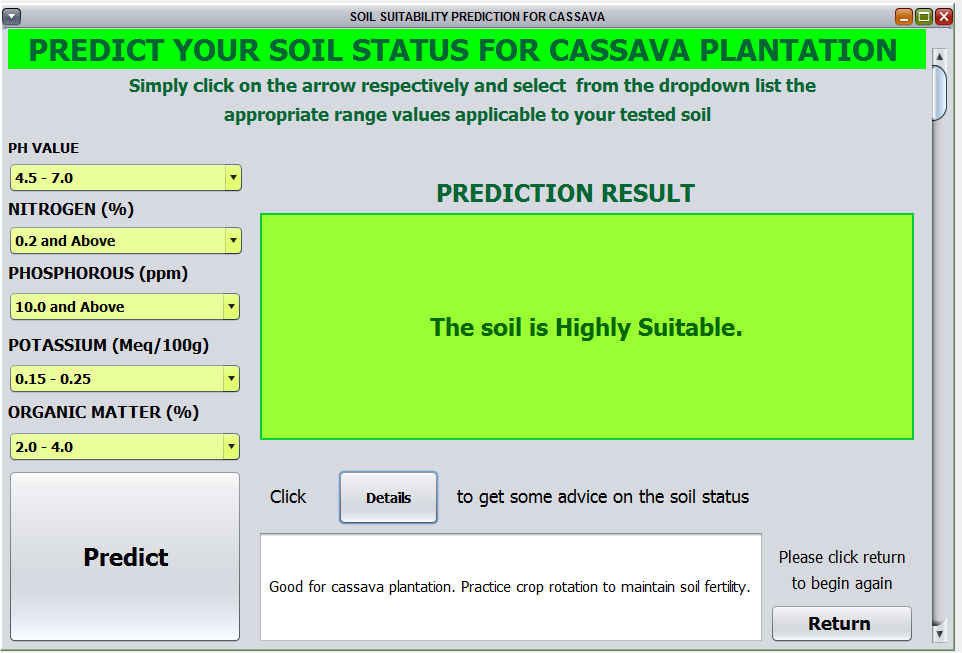
Figure 8: System predicted high suitability of soil
4.3.1. Prediction Accuracy of the System
The class wise accuracy prediction of the developed system was carried out and the results obtained from correctly classified instances and incorrectly classified instance are shown in table 3. Table 3 clearly presents the true positives, false positives and precision correctness for the four prediction classes.
Table 3: Percentage Accuracy for the four class prediction
| Prediction Class | True Positive (TP) | False Positive (FP) | Correct Precision (%) |
| Highly Suitable | 0.8 | 0 | 100% |
| Moderately Suitable | 0.75 | 0.154 | 60% |
| Marginally Suitable | 0.667 | 0.071 | 66.7% |
| Presently Not Suitable | 0.8 | 0.083 | 0% |
From the test results presented in table 3, soil types that were highly suitable in the test data were 100% correctly predicted. The soil types that were moderately suitable in the test data were 60% correctly predicted. The soil types that were marginally suitable in the test data were 66.7% correctly predicted. The soil types that were not suitable in the test data were incorrectly predicted. On the overall, correctly classified instances from the system testing were 76.5% while incorrect classified instances were 23.5%. This proved that the model is very suitable for predicting soil suitability for cassava plantation
5. Conclusions
A study was conducted on the development of a system for predicting the suitability of soil for the cultivation of cassava crop using decision trees. Secondary data was obtained from published journals relating to soil analysis of some farmlands from different geographical locations in Nigeria. The data utilized consists of the predominant parameters for determining typical soil fertility in respect of cassava cultivation. J48 classification algorithm was used to train the data, a good classification of the data was obtained and decision trees were generated. The output of the decision tree was used as the knowledge base for building the prediction system. 30% of the data was then used to test the validity and accuracy of the prediction system. It was deduced from the class-wise accuracy that the true positive rate for obtaining the suitability classes – Highly Suitable, Moderately Suitable, Marginally Suitable and Presently Not Suitable are 100%, 60%, 66.7% and 0% respectively. The percentage accuracy of the data classification was also determined as 76.5% and 23.5% for correctly classified and incorrectly classified instances respectively. In this light, the major objective of developing a web-based decision support system for evaluating agricultural soil suitability for cassava cultivation using a classification mining technique was achieved in this work. The paper provided an improved method of soil evaluation for farmers for cassava plantation with respect to selection of the best available soil for maximum productivity. The decision support system for evaluating agricultural soil suitability for cassava plantation was developed as a web application which made it to be easily accessible by farmers. The developed system had solved a major problem associated with decision making by farmers in determining the potential yield of a piece of farmland. The developed prediction system is esteemed a prospective tool for farmers, soil laboratories and other users in predicting soil suitability for cassava cultivation. Besides, it will drastically boost crop yield and instigate a worthwhile increase in the nation’s Gross Domestic Product (GDP). This will on the long run improve the economy, most especially in developing countries of the world. Prospective area of future work will cover the extension of the prediction system to include some other minor soil parameters such as the soil organic carbon, calcium, sodium, magnesium, soil texture, depth and base saturation. Climatic conditions like temperature and rainfall which could also be responsible for good productivity of cassava plantation could be considered. Finally, experiments involving other decision tree algorithms would be carried out in order to make some worthwhile comparisons.
Conflict of Interest
The authors declare no conflict of interest.
- M.A. Abua, Suitability Assessment of Soil for Cassava Production in the Coastal and Hinterland Areas of South Cross River State – Nigeria, Journal of Soil Science and Environmental Management, 2015, Volume 6 Issue 5, pp 108 – 115.
- C. Nwajiuba, Nigeria’s Agriculture and Food Security Challenges, Inaugural lecture, No.5, Imo State University, Owerri, Nigeria, 2012.
- B.A. Senjobi, Comparative Assessment of the Effect of Land Use and Land Type on Soil Degradation and Productivity in Ogun State, Nigeria, Unpublished Ph.D. Thesis Submitted to the Department of Agronomy, University of Ibadan, Ibadan, 2007, pp 161.
- D.O. Aderonke, G.A. Gbadegesin, Spatial Variability in Soil Properties of a Continuously Cultivated Land, African Journal of Agricultural Research, 2013, volume 8 issue 5, pp 475-483.
- D.G. Rossiter, Ales: A Frame Work for Land Evaluation Using Microcomputer, Soil Use Manage, 1996, 6, pp 7-20
- H. Lin, J. Bourma, J. Wilding, L. Richardson, M. Kutilek, D.R. Nielson, Advances in hydropedology, Advances in Agronomy, volume 85, pp 1-89, 2005, http://cropsoil.psu.edu/people/faculty/lin/ advances2005.pdf
- P.I, Ezeaku, Methodologies for Agricultural Land Use Planning: Sustainable Soil Management and Productivity, Great AP Express Publishers Ltd., Nsukka, FAO, 2011.
- Y. Adekunle, E.O. Bisong, O.O. Fagbemi, E. E. Obuke, J. Alao, O.D. Maitanmi, Framework Model for A Soil Suitability Decision Support System for Crop Production in Nigeria. American Journal of Engineering Research (AJER), Volume-02, Issue-06, pp-09-13, 2013.
- S.A. Liu, H.B. Duffy, R.I. Whitfield, I.M. Boyle, Integration of Decision Support Systems to Improve Decision Support Performance, Knowledge and Information Systems, 2010, 22(3), pp 261-286.
- M. Alvarado, A.R. Toral, S. Ayala, Decision Making on Pipe Stress Analysis Enabled by Knowledge-Based Systems, Knowledge and Information Systems—An International Journal, 2007, 12(2), pp 255-278.
- K.T. Osman, Soils Principles, Properties and Management, Netherlands: Springer, 2013.
- A. A. Klingebiel, P. H. Montgomery, Land Capability Classification. U. S. Dept. Agric. Handbook, 1961.
- R. E. Storie, An Index for rating the agricultural values of soils. Calif. Agric. Expt. Sta. Bull. 566, 48, 1933.
- FAO, A Framework for Land Evaluation, Food and Agriculture Organization FAO, Rome, Italy, 1976, pp 1.
- A. O. Ogunkunle, Soil Survey and Sustainable Land Management. Proceedings of the 29th Annual Conference of the Soil Science Society of Nigeria, 2005.
- S. Ritung, A.F. Wahyunto, H. Hidayat, Land Suitability Evaluation With a Case Map Of Aceh Barat District. Indonesian Soil Research Institute and World Agroforestry Centre, Bogor, Indonesia, 2007.
- H.H.E Isitekhale, S.I. Aboh, F.E. Ekhomen, Soil Suitability Evaluation for Rice and Sugarcane in Lowland Soils of Anegbetter, Edo State, Nigeria, The International Journal of Engineering and Science (IJES), 2014, volume 3 issue 5, PP 54-62.
- N. Hakim, M.Y. Nyakpa, A.M. Lubis, S.G. Nugroho, M.R. Saul, M.A. Diha, B.H. Go, H. Bailey, I.T. Dasar-Dasar, Fundamentals of Soil Science. University of Lampung. Bandar Lampung, 1986, pp 258.
- S. Riquier, D. Bramao, I. Comet, A New System of Soil Appraisal in Terms of Actual and Potential Productivity. FAO, Rome, 1970, pp 44.
- J. Aguilar, R. Ortiz, Methodology capacity of agricultural land use. III National Congress of Soil Science, Pamplona, Spain, 1992, pp 281-286.
- B. Vanlauwe, P. Pypers, N. Sanginga, The Potential of Integrated Soil Fertility Management to Improve the Productivity of Cassava-based Systems. In: Cassava: Meeting of the Challenges of the New Millennium: Proceedings of the First Scientific Meeting of the Global Cassava Partnership, Ghent, Belgium. Institute of Plant Biotechnology for Developing Countries (IPBO), Ghent University, Ghent, Belgium, 2008.
- E. Antonopoulou, S. Karetsos, M. Maliappis, A. Sideridis, Web and Mobile Technologies in a Prototype DSS for Major Field Crops, Computers and Electronics in Agriculture, 2010, 70, pp 292 – 301.
- M. Alminana, L.F. Escudero, M. Landete, J.F. Monge, A. Rabasa, J. Sanchez-Soriano, WISCHE: A DSS for water irrigation scheduling, Omega 38(6), pp 492–500, 2010.
- M.S. Mokarram, F. Hamzeh, A.Z. Aminzadeh, A.Z. Rassoul, Using Machine Learning For Land Suitability Classification, West African Journal of Applied Ecology, Volume 23, No 1, 2015, pp 63-73.
- D. Ramesh, V.B. Vardhan, Data Mining Techniques and Applications to Agricultural Yield Data. International Journal of Advanced Research in Computer and Communication Engineering, 2013, 2 (9), pp 3477-3480.
- J. Gholap, Performance Tuning Of J48 Algorithm for Prediction of Soil Fertility, Asian Journal of Computer Science and Information Technology, volume 2, issue 8, 2012, pp 251– 252.
- J.C. Sally, H. Geoffrey, Developing innovative applications in agriculture using data mining”, In the Proceedings of the Southeast Asia Regional Computer Confederation Conference, 1999..
- D. John, Twitter Sentiment Analysis, Final Project Report for Higher Diploma in Science in Data Analytics, National College of Ireland, 2014.
- S.R. Kalmegh, S.N. Deshmukh, Categorical Identification of Indian News Using J48 and Ridor Algorithm, International Refereed Journal of Engineering and Science (IRJES), Volume 3, Issue 6, 2014, pp 79-84.
- O.T. Ande, Soil Suitability Evaluation and Management for Cassava Production in the Derived Savanna Area of Southwestern Nigeria. International Journal of Soil Science, volume 2, issue 6, 2011, pp 142-149.
- J. Nwite, J.A. Nwogbaga, G.I. Okonkwo, Assessment of Productivity of Sandy Loam in Abakaliki, Southeastern Nigeria, International Journal of Agriculture and Biosciences, 2015, , 4(2), pp 59-63.
- S.H.E Tekwa, S.M. Maunde, Soil Nutrient Status and Productivity Potentials of Lithosols in Mubi Area, Northeastern Nigeria, Agriculture & Biology Journal of North America, 2011, Vol. 2, Issue 6, pp 887.
- R.H. Howeler, Cassava Mineral Nutrition and Fertilization in Cassava: Biology, Production and Utilization. CABI Publishing, Wallingford, Oson, UK, 2002, pp 115 – 147.
- C. Sys, J. Debaveye, Land evaluation and crop production and calculations. Agric publication, No. 7. General Admin for Development Corporation, Brussels, Belgium, 1991, pp 247.