Operational Efficiencies and Simulated Performance of Big Data Analytics Platform over Billions of Patient Records of a Hospital System
Operational Efficiencies and Simulated Performance of Big Data Analytics Platform over Billions of Patient Records of a Hospital System
Volume 2, Issue 1, Page No 23-41, 2017
Author’s Name: Dillon Chrimesa),1, Belaid Moa2, Mu-Hsing (Alex) Kuo3, Andre Kushniruk3
View Affiliations
1Database Integration and Management, Quality Systems, Vancouver Island Health Authority, V8R1J8, Canada
2Compute Canada/WestGrid/University Systems, Advanced Research Computing, University of Victoria, V8P5C2, Canada
3School of Health Information Science, Faculty of Human and Social Development, University of Victoria, V8P5C2, Canada
a)Author to whom correspondence should be addressed. E-mail: dillon.chrimes@viha.ca
Adv. Sci. Technol. Eng. Syst. J. 2(1), 23-41 (2017); ![]() DOI: 10.25046/aj020104
DOI: 10.25046/aj020104
Keywords: Big Data, Big Data Analytics, Data Mining, Data Visualizations, Healthcare, Hospital Systems, Interactive Big Data, Patient Data, Simulation, Usability

Export Citations
Big Data Analytics (BDA) is important to utilize data from hospital systems to reduce healthcare costs. BDA enable queries of large volumes of patient data in an interactively dynamic way for healthcare. The study objective was high performance establishment of interactive BDA platform of hospital system. A Hadoop/MapReduce framework was established at University of Victoria (UVic) with Compute Canada/Westgrid to form a Healthcare BDA (HBDA) platform with HBase (NoSQL database) using hospital-specific metadata and file ingestion. Patient data profiles and clinical workflow derived from Vancouver Island Health Authority (VIHA), Victoria, BC, Canada. The proof-of-concept implementation tested patient data representative of the entire Provincial hospital systems. We cross-referenced all data profiles and metadata with real patient data used in clinical reporting. Query performance tested Apache tools in Hadoop’s ecosystem. At optimized iteration, Hadoop Distributed File System (HDFS) ingestion required three seconds but HBase required four to twelve hours to complete the Reducer of MapReduce. HBase bulkloads took a week for one billion (10TB) and over two months for three billion (30TB). Simple and complex query results showed about two seconds for one and three billion, respectively. Apache Drill outperformed Apache Spark. However, it was restricted to running more simplified queries with poor usability for healthcare. Jupyter on Spark offered high performance and customization to run all queries simultaneously with high usability. BDA platform of HBase distributed over Hadoop successfully; however, some inconsistencies of MapReduce limited operational efficiencies. Importance of Hadoop/MapReduce on representation of platform performance discussed.
Received: 30 November 2016, Accepted: 12 January 2017, Published Online: 28 January 2017
1. Introduction
Gantz and Reinsel [1] predicted in their ‘The Digital Universe’ study that the digital data created and consumed per year would reach 40,000 Exabyte by 2020, from which a third will promise value to organizations if processed using big data technologies. In fact, global digital patient data expected to reach 25 Exabytes (1018 bytes) in 2020 [2]. Furthermore, A McKinsey Global Institute stated US healthcare that uses Big Data effectively could create more than $300 billion in value from cost savings annually [3]. At the same time in 2013, Canada Health Infoway [4] produced a white paper to solidify the meaningful use of patient
data to cut healthcare costs for each of the Provinces. However, the increase in digital data and fluid nature of information- processing methods and innovative big data technologies has not caused an increase of implementations in healthcare in Canada and abroad. Furthermore, there are very few if any of the 125 countries surveyed by the World Health Organization with any Big Data strategy for universal healthcare coverage of their eHealth profiles [5]. Conventional systems in healthcare are very expensive to implement and establish that further reduces the uptake of open source software like Hadoop/MapReduce frameworks.
Health Big Data is a large complex-distributed highly diversified patient data requiring high performance analytical tools to utilize large volume of data for healthcare application [6-8]. Big Data Analytics (BDA) is a platform with analytical technologies
frame worked to extract knowledge in real-time for evidence-based medicine, medical services and transport of inpatients in hospital wards, onset of in-hospital acquired infections, and treatments linked to health outcomes including scientific and clinical discoveries [3, 4, 9-11]. However, a BDA platform is of little value if decision-makers do not understand the patterns it discovers and cannot use the trends to reduce costs or improve processes. Subsequently, BDA research is important and highly innovative to effectively utilize data quickly for the ongoing improvement of health outcomes in bioinformatics, genome sequencing, and tertiary healthcare [12-16].
After extensive literature review, many Big Data technologies with Hadoop/MapReduce are available but few applied in healthcare (Table 1 in Appendix). BDA platform called Constellation deployed at the Children’s Mercy Hospital in Kansas City, US successfully matched patient data of children to their whole-genome sequencing for treatment of potentially incurable diseases [43]. Their big data analytics study showed that, in emergency cases, the differential diagnosis for a genetic disease in newborn patients was identifiable in 50 hours [42]. Further improvement using Hadoop reduced the analysis time for the whole genome sequencing from 50 to 26 hours [44]. Unfortunately, even with these success stories of fully functional BDA platforms in bioinformatics, there are few studies and published reporting of BDA platforms used by health providers in hospital systems.
There are many alternative solutions for databases in Big Data platforms; choice of the best solution depends on the nature of the data and its intended use, e.g., [37]. In practice, while many systems fall under the umbrella of NoSQL systems and are highly scalable (e.g., [45], these storage types are quite varied). Big Data is characterized in several ways: as unstructured [19], NoSQL [31, 36], key-value (KV) indexed, text, information-based [46], and so on. In view of this complexity, BDA requires a more comprehensive approach than traditional data mining; it calls for a unified methodology that can accommodate the velocity, veracity, and volume capacities needed to facilitate the discovery of information across all data types [4]. Furthermore the KV data stores represent the simplest model of NoSQL systems: they pair keys to values in a very similar fashion to show a map (or hashtable) works in any standard programming language. Various open-source projects provide key-valued NoSQL database systems; such projects include Memcached, Voldemort, Redis, and Basho Riak, e.g., [22]. HBase was chosen because it simplified the emulation of the columns using the metadata in each column rather than the data types and the actual relationships among the data. HBase also has a dynamic schema that can be uploaded via other Apache applications; therefore, the schema can be changed and tested on the fly. Another benefit of using HBase is that further configurations can be accomplished for multi-row transactions using a comma-separated value (.CSV) flat file [47].
The KV class of store files in databases is the heart of data storage in HBase that provides inherent encryption. Privacy mandates are a major barrier for any BDA implementation and utilization. The Health Insurance Portability and Accountability Act (HIPAA), as well as Freedom of Information and Protection of Privacy (FIPPA) Act requires the removal of 18 types of identifiers, including any residual information that could identify individual patients, e.g., [48]. Therefore, privacy concerns can be addressed using new database technologies, such as key-value (KV) storage services. For example, Pattuk, Kantarcioglu, Khadilkar, Ulusoy, and Mehrotra [49] proposed a framework for securing Big Data management involving an HBase database – called Big Secret – securely outsources and processes encrypted data over public KV stores.
In a hospital system, such as for the Vancouver Island Health Authority (VIHA), the capacity to record patient data efficiently during the processes of admission, discharge, and transfer (ADT) is crucial to timely patient care and the quality of patient-care deliverables. The ADT system is the source of truth for reporting of the operations of the hospital from inpatient to outpatient and discharged patients. Proprietary hospital systems for ADT also have certain data standards that are partly determined by the physical movement of patients through the hospital rather than the recording of diagnoses and interventions. Among the deliverables are reports of clinical events, diagnoses, and patient encounters linked to diagnoses and treatments. Additionally, in most Canadian hospitals, discharge records are subject to data standards set by Canadian Institute of Health Information (CIHI) and entered into Canada’s national Discharge Abstract Database (DAD). Moreover, ADT reporting is generally conducted through manual data entry to a patient’s chart and then it is combined with Electronic Health Record (EHR), which could also comprise auto-populate data, to conglomerate with other hospital data from provincial and federal health departments [50]. These two reporting systems, i.e., ADT and DAD, account for the majority of patient data in hospitals, but they are seldom aggregated and integrated as a whole because of their complexity and large volume. A suitable BDA platform for a hospital should allow for the integration of ADT and DAD records to query the data to find unknown trends at extreme volumes of the entire system. However, there are restrictions that limit the data that gets recorded, especially on discharging a patient a physician is legally required only to record health outcomes rather than the details of interventions. For these and other reasons, health informatics has tended to focus on the structure of databases rather than the performance of analytics at extreme volumes.
Currently, the data warehouse at VIHA has over 1000 (relational) tables that include alias pools for data integrity of patient encounters in ADT of the hospital system. Its total size estimated at one billion records or 14 Terabytes (TB), and it is one of the largest continuous patient records in Canada [51]. Huge volumes of highly diversified patient data are continuously added into this collection; this equates to annually 500 million records or five TB. Currently, at VIHA, numerous data manipulations and abstracting processes put into place via non-enterprise platforms to combine patient data from the relational databases of the hospital system customized to apply clinical and operational queries. Neither business intelligence (BI) tools nor data warehouse techniques are currently applied to both data sets of ADT and DAD at the same time and over its entire volume of data warehouse. Therefore, we propose an enterprise BDA platform with applications to query patient data of a database representing a hospital system comprised of ADT and DAD databases.
2. Interactive Healthcare Big Data Analytics (HBDA) Framework
2.1. Conceptual Framework
The conceptual framework for a BDA project in healthcare is similar to that of a traditional health informatics analytics. That is, its essence and functionality is not very different from that of
conventional systems. The key difference lies in data-processing methodology. In terms of the mining metaphor, data represent the gold over the rainbow while analytics systems represent the leprechaun that found the treasure or the actually mechanical minting of the metals to access it. Moreover, healthcare analytics is defined as a set of computer-based methods, processes, and workflows for transforming raw health data into meaningful insights, new discoveries, and knowledge that can inform more effective decision-making [23]. Data mining in healthcare has traditionally been linked to knowledge management, reflecting a managerial approach to the discovery, collection, analysis, sharing, and use of knowledge [52-53]. Thus, the DAD and ADT are designed to enable hospitals and health authorities to apply knowledge derived from data recording patient numbers, health outcomes, length of stay (LOS), and so forth, to the evaluation and improvement of hospital and healthcare system performance. Furthermore, because the relational databases of hospitals are becoming more robust, it is possible to add columns and replicate data in a distributed filing system with many (potentially cloud-based) nodes and with parallel computing capabilities. The utility of this approach is that columns are combined (i.e., columns from the DAD and ADT database). In addition, such a combination can mimic data in the hospital system in conjunction with other clinical applications. Through replication, generation and ingestion, the columns can form one enormous file then queried (while columns added and removed or updated).
BDA platform(s) should offer the necessary tools currently performed by hospitals and its managed relational databases to query the patient data for healthcare. Furthermore, the end user experience should include analytical tools with visualizations using web-based applications. To achieve this, a dynamic interactive BDA platform, and following our preliminary results from Chrimes, Moa, Zamani, and Kuo [54], established for healthcare application at the University of Victoria (UVic), in association with WestGrid, and Vancouver Island Health Authority (VIHA), Victoria, BC, Canada. Thus, our Healthcare BDA (HBDA) platform provided a proof-of-concept implementation and simulation of high performance using emulated patient data generated on WestGrid’s Linux database clusters located at UVic. Emulation consisted of reaching nine billion health records that represented the main hospital system of VIHA and its clinical reporting via its data warehouse (Figure 1). The emulated data utilized in simulation could capture the appropriate configurations and end-user workflows of the applications, while ultimately displaying health trends at the hospital and patient levels.
Our team of collaborators existed between UVic, Compute Canada\WestGrid and VIHA that thru requirements gathering, usability testing and software installations established the framework of our HBDA platform. It comprised innovative technologies of Hadoop Distributed File System (HDFS) with MapReduce’s Job/Task Scheduler, and noSQL database called HBase. The database construct was complex and had many iterations of development over the past three-four years. There were many configurations of components included such as Apache Phoenix, Apache Spark and Apache Drill, as well as Zeppelin and Jupyter Notebook web-client interfaces. Furthermore, we required a proof-of-concept to implement in simulation before applying it to real patient data after rigorously approved by research ethics with guaranteed highly secured patient data. Our aim was effectively to query billions records of patient data stored in the VIHA with health professionals and providers to reveal its fast and reliable queries, as well as unveil unknown health trends, patterns, and relevant associations of medical services with health outcomes.
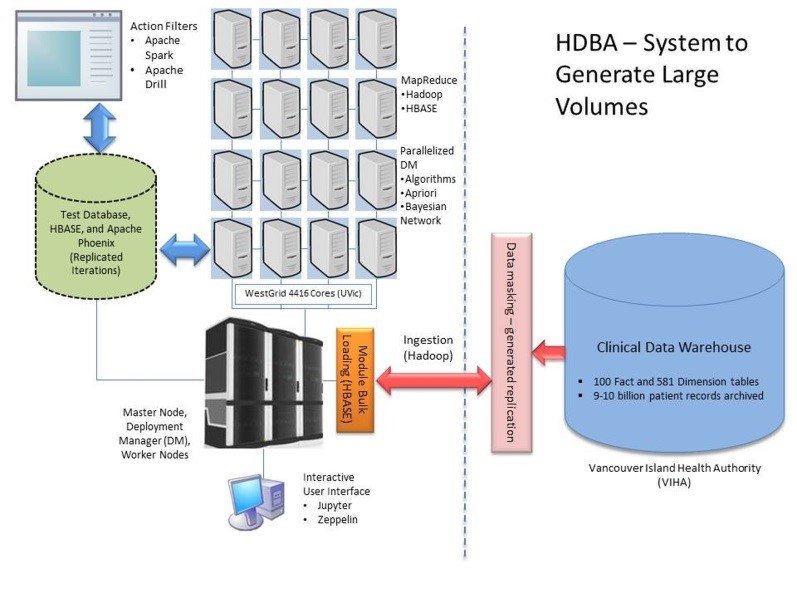
Figure 1. The proposed framework of Health Big Data Analytics (HBDA) platform with Vancouver Island health authority (VIHA) under replicated Hadoop Distributed File System (HDFS) to form noSQL database via MapReduce loads with big data analytic tools interacting under parallelized deployment manager (DB) at Westgrid, UVic, Victoria.
We constructed 50 million to nine billion patient records to form different levels of testing of our HBDA platform based on known data profiles and metadata of the patient data in the hospital system. Henceforward, our simulation should show significant improvements of query times; usefulness of the interfaced applications; and the applicability and usability of the platform to healthcare. To deal with the implementation challenges, we viewed HBDA as a pipelined data processing framework, e.g., [11], and worked in conjunction (interviewed) with VIHA experts (and potential stakeholders) to identify the metadata of important inpatient profiles (Figure 2). Additionally, the stakeholder provided the required patient data and workflow processes for both generating the reports and the application used for querying results to achieve visualizations.
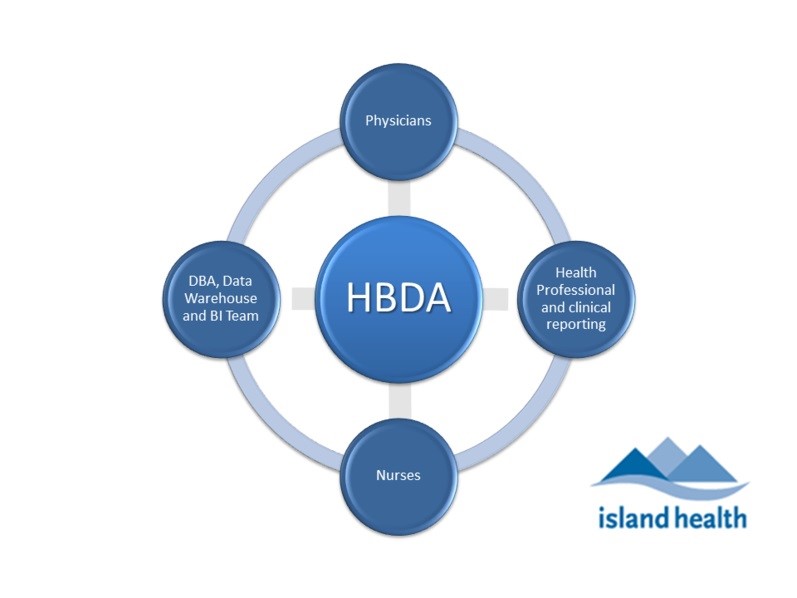
Figure 2. Main stakeholder groups of Physicians, Nurses, Health Professionals (i.e. epidemiologists and clinical reporting specialists), and Data Warehouse and Business Intelligence (BI) team (includes application platform and database integration) involved in clinical reporting at VIHA.
2.2 Overview
The objective of this platform implementation and simulated performance was to establish an interactive framework with large representative patient data aligned with front-end and interfaced applications linked to HDFS stack and noSQL database with visualization capabilities that allows users to query the data. For the implementation, advanced technologies created a dynamic BDA platform while generating emulated patient data over a distributed computing system, which is currently not in use at VIHA and many other health institutions in Canada. The implemented HBDA was big data centric and designed to make big data capabilities, including analytics using mainly SQL-like compatibilities with data warehouse team and front-end architecture for correct visualization, accessible to different stakeholders, especially physicians and healthcare practitioners (Figure 3).
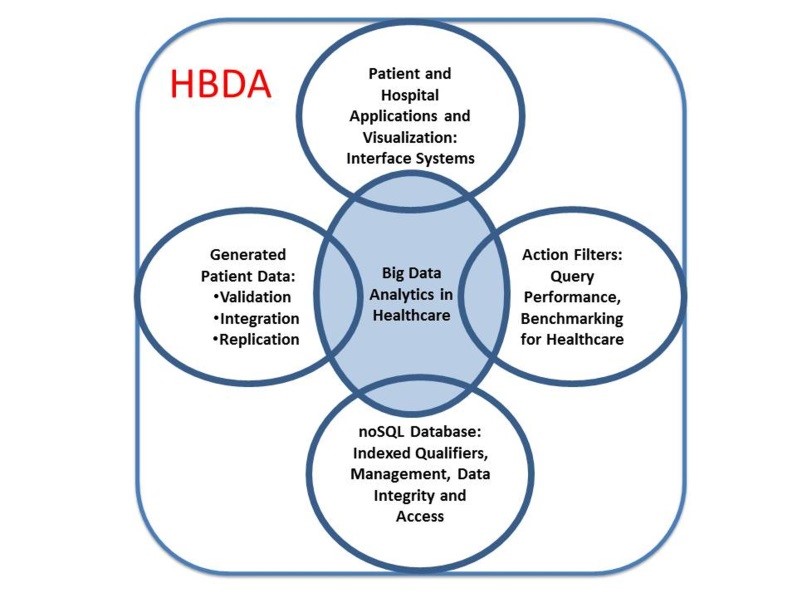
Figure 3. The main components of our Healthcare Big Data Analytics (HBDA) platform envisioned by stakeholders and derived from our team. It is important to note that the center of this diagram is truly the SQL-like code used to query the data because without it the other interconnected components would not provide any linkage to user and no meaningful use.
linkage to user and no meaningful use.
The established BDA platform allowed for testing the queries’ performance that included actions and filters that corresponded to current reporting of VIHA’s clinical data warehouse. To test performance, the first step was to emulate the metadata and data profiles of VIHA’s ADT model, which is Cerner’s (proprietary) hospital system. The metadata derived for the patient encounter(s) combined with VIHA’s hospital reporting to CIHI of its DAD formed our test database. The data aggregation represented both the source system of patient encounters and its construct, which represented patient data collected during the encounter (for different encounter types) before patient discharge. At VIHA, and its Cerner system, there are hundreds of tables that comprise the ADT and all are part of a relational database with primary and foreign keys. These keys are important for data integrity that link clinical events for that patient only. Therefore, it was necessary to use constraints in emulating data for the noSQL database.
Hadoop/MapReduce framework proposed to implement the BDA platform and analyze emulated patient data over a distributed computing system is net new to acute patient care settings at VIHA and other health authorities in Canada. Innovative technologies from Hadoop’s ecosystem with MapReduce programming, and a NoSQL database, called HBase were utilized to form a complex database construct. HBase is an open-source, distributed key-value (KV) store based on Google’s BigTable [55] ─ persistent and strictly consistent NoSQL system using HDFS for data storage. Furthermore, with all these technical components to construct the platform, the build also took into account the workflow by clinical reporting workgroups with the same metadata from hospital datasets.
2.3 Data Generation
To generate accurate representations of patient records, we originally constructed the emulated database in Oracle Express 11g using SQL to establish the column names and metadata using constrained data profiles for each randomized row of dummy patient data. For example, data for the diagnostic column was ICD-10-CA codes and set that data to those standardized characters. The data was populated for each column based on a list of metadata set in the script to generate for each of the columns. Furthermore, important data profiles and dependencies established through primary keys over selected columns. Ninety columns from DAD and ADT were eventually established, generated, and ingested into the HBDA platform. Since data warehouse team working with health professionals for clinical reporting relies on comma-separated value (CSV) formats when importing and exporting their data, we opted to use the ingested CSV files directly for analytics instead of HBase. This was carried out previously on our platform using Apache Phoenix and its SQL-like code on HBase [51, 56]. Two data sizes of 50 million and one billion records established a benchmark check on how different packages (Apache Spark and Drill) scaled with data size with an additional three billion tested.
2.4 Infrastructure
Using existing computational resources and architecture was an essential requirement. We relied on the existing WestGrid clusters at UVic to run the platform. Among ~500 nodes available on the WestGrid clusters hosted at UVic, we planned to use as many nodes as possible while benchmarking and testing scalability. Currently, we only used six dedicated nodes due to configuration issues and ongoing maintenance. Local disks had 6TB per node that then could reach ten billion records at this 36TB storage to illustrate operational platform. The PBS/Torque resource manager managed the clusters that allowed access to launch our interactive Hadoop/HBase jobs and modules for Apache Spark/Drill while loading Jupyter Notebook or Zeppelin on those nodes. The nodes had 12 cores, 24GB and three 2TB-disks each, and were similar in technical specification to the existing servers at VIHA. Thus, comparisons could be made with VIHA based on Westgrid’s high performance supercomputing (HPC), referred to architectural and technical specifications for more details [51].
Given that the WestGrid clusters are traditional HPC clusters, we had to customize our setup scripts to launch a dynamic HBDA platform that runs when the job starts and terminates when the job finishes. This allows our HBDA platform to exist within an HPC cluster and thus eliminate special treatment to the environment with extending the job wall-time when necessary.
2.5 Big Data Analytics (BDA) and Visualization
After interviews with different VIHA stakeholders, identified requirements applied to our proof-of-concept and visualization simulation: interactive, simple, SQL-like, and visualization-enabled interface. Moreover, the platform should be able to offer the necessary tools to implement new analyses and act as an expert
system when needed; this was required because clinicians were interested in answering specific scenarios. An example of a scenario was:
“Clinicians suspect that frequent movement of patients within the hospital can worsen outcomes. This is especially true of those who are prone to confusion (or mental relapse) due to physical and environmental changes in their current state that can exacerbate the confusion. If this occurs, a physician may attribute their confusion to the possible onset of an infection, a disease or a mental illness, resulting in unnecessary laboratory tests and medications. Moreover, by moving to a new location, new healthcare workers may detect subtle changes in a patient’s mental baseline and frequent patient movements can cause sepsis onset.”
For the HBDA platform to be successful it should process 1) a large number of patient records (data space) over a wide range of computationally intensive algorithms (algorithmic space); as well as 2) to easily generate visualizations (visualization space); 3) offer libraries; and, 4) application tools (tool space) to support these four spaces. Deploying our platform covered all the four of these spaces while being interactive was challenging. In previous study [51, 54], we reported that Hadoop, HBase, and Apache Phoenix provided an excellent platform to perform SQL-like queries with high performance and accurate patient results. However, the ingestion of one billion records from Hadoop HFiles bulkloaded to HBase (indexed files) took weeks, while three billion took over two months on the infrastructure before finalizing the configurations. Moreover, SQL-like queries and tools were only a small fraction of the interest and importance mentioned by stakeholders, who included other factors of their workflow and professional consideration like algorithmic, tool, visualization spaces (e.g., epidemiology versus hospitalization reporting). In our simulation, therefore, we expanded on those spaces that our first article of Hadoop and HBase did not investigate with three-nine billion records while using Zeppelin and Jupyter with Spark and Drill’s separate interface at various testing. Moreover, we investigated SQL-like capabilities of Spark and SQL-ANSI of Drill on CSV files indexed by HBase compared to Phoenix on HBase.
The data construction framework used by this study extracted the appropriate data profiles from the data dictionaries and data standard definitions for the ADT system and DAD abstract manual [57]. The data used to test performance was circumvented with the interviews with different VIHA stakeholders, several requirements and scenarios, and 17 clinical cases were outlined that were identified for a realistic proof-of-concept BDA and data visualization: the interface should be interactive, simple, ANSI-SQL or SQL-like, and visualization enabled/embedded in the browser. Moreover, the platform should be able to offer the necessary tools to implement newly advanced analytics to act as a recommendation of an expert system; this is required, as clinicians are interested in answering specific scenarios of inpatient encounters with accurate data.
2.6 Testing & Evaluation
The functional platform tested performance of data migrations or ingestions of HFiles via Hadoop (HDFS), bulkloads of HBase, and ingestions of HFiles to Apache Spark and Apache Drill. Test speed of performance to complete ingestion or queries were proof-of-concept testing using simulated data with the same replicated metadata and very large volume, but this did not consist of comparing performance of SQL (relational database) with NoSQL or different data models with real patient data. The SQL can be very similar with real data but cannot be compared at this time. Furthermore, the bulk of the methodology is generating the emulated data and queries with Hadoop configurations and other software, i.e., HBase, Spark and Drill. Most of the configurations established after installing the components, which were defaulted for the distributed filing and MapReduce in Java, Python and Scala to perform as expected; therefore, the platform established by Hadoop-MapReduce configurations to run and integrate with all other big data tools.
For SQL-like analytics, to test and evaluate Zeppelin versus Jupyter with Spark and SQL-ANSI with Drill, we selected 22 SQL query tests based on the interviews conducted and same as published in Chrimes et al., [51]. Eventhough the queries had different level of complexity; our performance results showed that all had similar times to generate the patient results or reports. An example of SQL statements used to test system was:
SELECT Count(Episode_Duration) as EDCount, Count(Anesthetistic_Technique) as ATCount, Count(Interven_Location) as ILCount, Count(Medical_Services) as MSCount, Count(Unit_Transfer_Occurrence) as UTOCount FROM DADS1 where EncounterID<1000 Group By age;
For other kinds of analytics, especially the machine learning algorithms, we performed simple tasks such as computing the correlations between different pairs of columns, such ‘age’ and the ‘length of stay at the hospital’ or LOS, as well as simple clustering. The data was synthetic or emulated; therefore, using machine learning to answer intelligent scenarios or find interesting patterns were only applied narrowly to find randomized patterns of the health outcome parameters that was already known. Nevertheless, its configurations and performance was ultimately the information attained towards using real patient data over our HBDA.
For visualization, we utilized the common set of graphs that healthcare providers would use to generate such reporting as table, pie chart, scatter plot, and histogram visualizations. In producing each graph and SQL-like query, we recorded and documented all processes and connectivity times.
3. Implementation of HBDA Platform
3.1. Overview of High Performance System(s)
The beauty of a BDA platform with open-source software in Hadoop’s ecosystem is that there are a wide range of tools and technologies for bulkloading and accessing large datasets from different sources. Sqoop, for example, is useful to ease the transfer between existing relational databases and a BDA platform [36]. For collecting and gathering unstructured data, such as logs, one can use Flume. Since the performance tests of queries on the platform relied on data emulation, it was used, as a proof-of- concept, the usual high-speed file transfer technologies (such as SCP and GridFTP) to transfer data to the HPC parallel file system (GPFS). It was then used the Hadoop and HBase as NoSQL database bulkload utilities to ingest the data.
The established BDA platform will be used to benchmark the performance of end users’ querying of current and future reporting of VIHA’s clinical data warehouse (i.e., in production at VIHA, spans more than 50 years of circa 14 TB). To accomplish this, Hadoop environment (including the Hadoop HDFS) from a source installed and configured on the WestGrid cluster, and a dynamic Hadoop job was launched. Hadoop (version 2.6.0) and its HDFS was configured by hdfs-site.xml and a MapReduce frame [26],
configured via mapred-site.xml, that was run under the Hadoop resource manager Yarn (with configuration file yarn-site.xml). The number of replicas was set to three. To interact with HDFS, command scripts were run to automate the ingestion step (generate data replication in the exact format specified by SQL script to the nodes).
The BDA platform was built on top of the available open-source database software (HBase). HBase (NoSQL version 0.98.11) is a NoSQL database composed of the main deployment master (DM) and fail-over master, the RegionServers holding HBASE data, and ZooKeeper, which contained services to allocate data locality [28], of three nodes, that orchestrated that ensemble. The xml configuration files were HBase-site.xml and the HBase-env.sh adjusted to improve the performance of HBase. HBase was chosen due to its NoSQL services and many other features, especially linear and modular scalability. In addition, it allows for SQL-like layers via Apache Phoenix configured on top of HBase big-tables.
The construction and build of the framework with HBase (NoSQL) and Hadoop (HDFS) coincided with and enforced by the existing architecture of the WestGrid clusters at UVic (secure login via LDAP directory service accounts to deployment database nodes and restricted accounts to dedicated nodes). The data were distributed in parallel on the nodes via a balanced allocation to each local disk with running part of the batch jobs in a serial computing process. Deployment of the Hadoop environment on the nodes was carried out via a sequence of setup scripts that the user calls after loading the necessary modules. These setup scripts create an initial configuration depending on the number of nodes chosen when launching the job. The user can adjust those configurations to match the needs of the job and its performance.
Making the DBA platform InfiniBand-enabled was challenging, as most of the Hadoop environment services rely on the hostname to get the IP address of the machine. Since the hostnames on a cluster are usually assigned to their management network, the setup scripts and the configuration files required adjustment. The InfiniBand was used because it offers low latency (in us) and high bandwidth (~40Gb/s) connectivity between the nodes. Yarn, Hadoop’s resource and job manager [33], unfortunately still partly used the Gig-Ethernet interface when orchestrating between the nodes, but the data transfer was carried out on the InfiniBand.
The bulk of the framework was comprised of open-source packages of Hadoop’s ecosystem. Even though several configurations were done to the Hadoop ecosystem to optimize running on the WestGrid dedicated cluster, no hardware modification was needed; possible future changes could be made to meet minimum recommended RAM, disk space, etc. requirements per node, e.g., refer to guidelines via Cloudera [58]. Hadoop provides the robust, fault-tolerant HDFS inspired by Google’s file system [55], as well as a Java-based API that allows parallel processing across the nodes of the cluster using the MapReduce paradigm. The platform was used in Python with Java to run jobs and ingestions. Hadoop comes with Job and Task Trackers that keep track of the programs’ execution across the nodes of the cluster. These Job and Task Trackers are important for Hadoop to work on a platform in unison with MapReduce and other ingestion steps involved with HBase, ZooKeeper, Spark, and Drill. There have been many contributors, both academic and commercial (Yahoo being the largest), to using Hadoop over a BDA platform, and a broad and rapidly growing user community [59].
The software stack used in the platform has at its bottom is HDFS (Figure 4). HDFS is the distributed file system of Hadoop and known to scale and perform well in the data space. Yarn was the resource manager of Hadoop and services of scheduling incongruent to running the Hadoop jobs. In addition to MapReduce component, Yarn, and HDFS constitute the main components [59]. In our platform, we built, configured and tested different versions of Hadoop, and managed the version via its respective module environment packages. The following module command lists all the available Hadoop versions:
$module avail Hadoop
Hadoop/1.2.1(default)Hadoop/2.2.0Hadoop/2.6.0 Hadoop/2.6.2
For our study, we used Hadoop2.6.2 with replication set to three in all our runs. Instead of using the MapReduce as our main service for the algorithmic space, we chose Apache Spark, as it covers larger algorithmic and tool spaces and outperforms Hadoop’s MapReduce to HBase as bulkload.
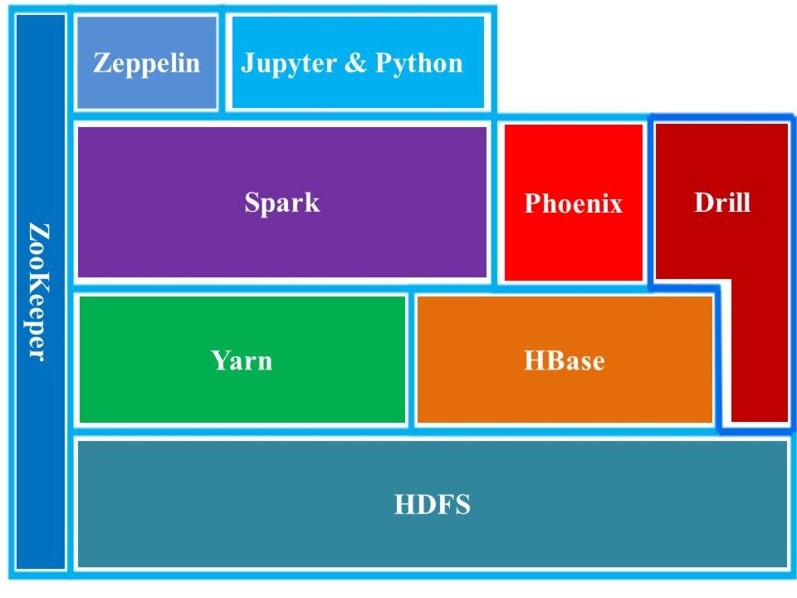
Figure 4. HBDA software stack used in our study. ZooKeeper is a resource allocator; Yarn is resource manager; HDFS is Hadoop Distributed File System; HBase is noSQL database; Phoenix is Apache Phoenix (query tool on HBase); Spark is Apache Spark (query tool with specialized Yarn); Drill is Apache Drill (query tool with specialized configuration to Hadoop via ZooKeeper); and Zeppelin and Jupyter are interfaces on local web hosts (clients) using Hadoop ingestion and Spark module.
The queries via Apache Phoenix (version 4.3.0) resided as a thin SQL-like layer on HBase. This allowed ingested data to form structured schema-based data in the NoSQL database. Phoenix can run SQL-like queries against the HBase data. Similar to the HBase shell, Phoenix is equipped with a python interface to run SQL statements and it utilizes a CSV file bulkloader tool to ingest a large flat file using MapReduce. The load balancing between the RegionServers (e.g., “salt bucket”) was set to the number of slaves or worker nodes that allowed ingested data to be balanced and distributed evenly. The pathway to running ingestions and queries from the build of the BDA platform on the existing HPC was as follows: CSV flat files generated à Module Load à HDFS ingestion(s) à Bulkloads/HBase à Apache Phoenix Queries. Under this sequence, the Apache Phoenix module loaded after Hadoop and HBase SQL code was directed and then iteratively run to ingest 50 million rows to the existing NoSQL HBase database
(see Results for details). This pathway was tested in iteration up to three billion records (once generated) for comparison of the combination of HBase-Phoenix versus Phoenix-Spark or an Apache Spark Plugin [60].
After the metadata, used in the emulated database, was verified from the existing relational database, it was established as a patient-centric SQL-like queries using Phoenix on top of the non-relational NoSQL HBase store. To establish data structure, the EncounterID was set as a big data integer (so that it can reach billions of integers without limitation) and indexed based on that integer via HBase for each unique at every iteration that followed. This indexed-value column, unique for every row, causes MapReduce to sort the KV stores for every one of the iterations that can increase the integrity of the data and increase its secured access once distributed. Once distributed, this allowed for SQL-like scenarios to be used in the evaluation of the performance of the BDA platform and accuracy of the emulated patient database.
3.2. Implementation of Apache Spark Technology System
Apache Spark (version 1.3.0) was also built from source and installed to use on HBase and the Hadoop cluster. The intent was to compare different query tools like Apache Spark over the BDA platform with Zeppelin and Jupyter then cross-compared with Drill’s ANSI-SQL and Apache Phoenix using similar SQL-like queries. Currently, Apache Spark, its action filters and transformations and resilient distributed dataset (RDD) format, is at the heart of the processing queries over the platform aligned with Hadoop [33]. It covered a substantial data space because it could read data from HDFS and HBase. Its speed can be fast because of its judicious use of memory to cache the data, because Spark’s main operators of transformations to form actions/filters were applied to an immutable RDD [32-33]. Each transformation produces an RDD that needs to be cached in memory and/or persisted to disk, depending on the user’s choice [32, 61]. In Spark, transformation was a lazy operator; instead, direct acyclic graphs (DAG) of the RDD transformations build, optimize, and only executed when action applied [32]. Spark relied on a master to drive the execution of DAG on a set of executors (running on the Hadoop DataNodes). On top of the Spark transformation engine there was a suite of tool space: Spark SQL and data frames, Machine Learning Library (MLLib), Graph library (GraphX), and many third-party packages. These tools run interactively or via a batch job. Similar to Hadoop, all of this software is available through the module environments package [54, 61]. Since the investigation was for user interactivity and usability the following was elaborated on:
- i) Spark terminal is available for users to interact with Spark via its terminal. Similar to the usual command line terminals, everything displayed as text. For Scala language (Java and Python), the user can call spark-shell to get access to the Scala (i.e., Python with Java libraries) terminal. For Python, the user should run Pyspark (module). For this study’s platform, the scale mode of use was only recommended for advanced users. For all stakeholders, selecting a terminal is not user-friendly and the platform will be viewed as too cumbersome to use; therefore, it ran the module in simulation as an administrator with the end user.
- ii) Jupyter notebook is a successful interactive and development tool for data science and scientific computing. It accommodates over 50 programming languages via its notebook web application, and comprises all necessary infrastructures to create and share documents, as well as collaborate, report, and publish. The notebook was user-friendly and a rich document able to contain/embed code, equations, text (especially markup text), and visualizations. For utilization, the simultaneous running of all queries over the fast ingestion of the entire database was a significant achievement. Furthermore, corroboration of the results, after selecting a port and local host to run over a browser, started from 50 million and extending to three billion records, and validated the queries over the time of application to display. The existing software installations of Jupyter 4.0.6 on python 2.7.9 were implemented without customization.
iii) Zeppelin was another interface used to interact with Spark. Zeppelin is a web- based notebook; it is not limited to Spark. It supports a large number of back-end processes through its interpreter mechanism [32]. In Zeppelin, any other back-end process can be supported once the proper interpreter is implemented for it. SQL queries were supported via the SparkSQL interpreter and executed by preceding the query with a %sql tag. What makes Zeppelin interesting, from the HBDA platform perspective, was the fact that it has built- in visualizations and the user can, after running an SQL query, click on the icons to generate the graph or chart. This kind of at-the-fingertip visualization was essential for the zero-day or rapid analytics. Spark 1.5.2 and Zeppelin 0.6.0 were built from source, configured with a port and local host had to run over a browser, and used for the testing and benchmarking of the platform.
3.3. Implementation of Apache Drill Technology System
Inspired by Google’s big query engine Dremel, Drill offers a distributed execution environment for large-scale ANSI-SQL:2003 queries. It supports a wide range of data sources, including .csv, JSON, HBase, etc… [62]. By (re)compiling and optimizing each of the queries while it interacting with the distributed data sets via the so-called Drillbit service, Drill showed capacity of the query with performance at a low latency SQL query. Unlike the master/slave architecture of Spark, in which a driver handles the execution of the DAG on a given set of executors, the Drillbits were loosely coupled and each could accept a query from the client [63]. The receiving Drillbit becomes the driver for the query, parsing, and optimization over a generated efficient, distributed, and multiphase execution plan; it also gathers the results back when the scheduled execution is done [19, 63]. To run Drill over a distributed mode, the user will need a ZooKeeper cluster continuously running. Drill 1.3.0 and ZooKeeper 3.4.6 were installed and configured on the framework of the platform over a port with a local host.
4. Findings and Significant Benchmarking Results
4.1. Technical Challenges
From a technical perspective, very few issues were faced during software installation of Spark and Drill. Besides the lack of documentation, a major issue with Hadoop’s ecosystem of packages was that many of them failed to include the dependencies that are local to the system, like with ZooKeeper for Spark and the version of Hadoop required with version of Python (Table 2 in Appendix).
To establish the BDA framework with different big data technologies, therefore, additional configurations had to be made in order to customize the platform without failed services and ongoing running of Hadoop at high performance (Figure 5), which was required to run ingestions and query. Additionally, for
improved efficiency, the platform used native libraries because Hadoop needs to be recompiled from source [19, 22, 23, 30, 61, 63-64]. Compression of HBase store files reduced the performance by ~100 minutes from 399 to 299 minutes on average. And it was found that many packages do not offer a profile that allowed them to be used, as local Hadoop even avoids downloading components. Moreover, given that the end users were allowed to run their Hadoop module on WestGrid’s clusters. Therefore, it was important that the configuration directories had most of the Hadoop’s ecosystem of packages built in to minimize reliance on them. Unfortunately, the configuration of Hadoop was not propagated properly to all the remote services running on the nodes, which caused the default configuration on those nodes to be used.
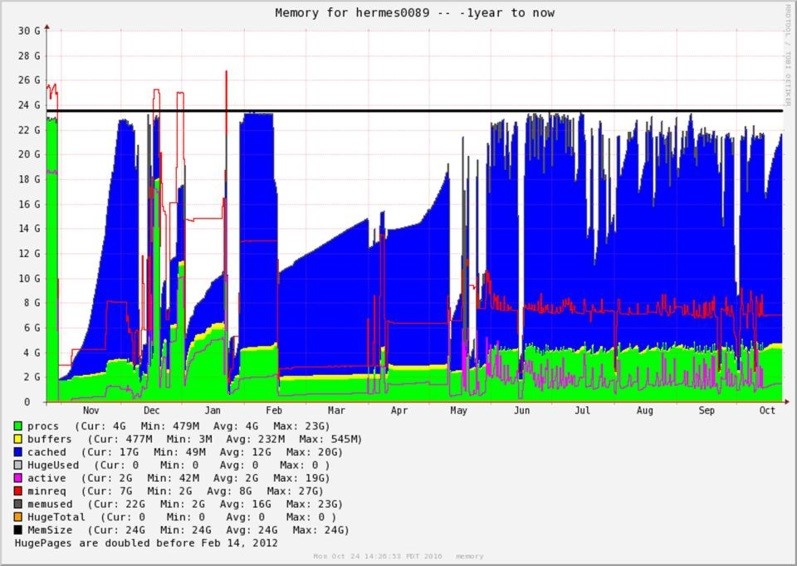
Figure 5. A month-to-month varied iteration lengths with 24GB ram consumption on Hermes89 node reported from WestGrid showing variation in the duration of the ingestion of 50 Million records over each of the iterations over an entire year (November 2015 to October 2016), with more activity mid-May to October. The graph shows the following cached memory (in blue), active passes (in green), buffers (in yellow), as well as active (in pink), minimum required (in red) and available memory (black line).
Four CSV files were ingested to HDFS: 1) one with 10 records was used for quick testing; 2) one with 50 million records was used for the actual benchmarking; and, 3) another two with one and three billion records. The results for 3 billion are shown in Table 3 (in Appendix) while the other results for 50 million and 1 billion were previously published [51]. Furthermore, the results also revealed that unbalanced nodes had slower performance compared to more balanced nodes (after manually running compression was run for 24 hours on HBase store files).
There is a tool called Hannibal available to check Regions over Hadoop/HBase and showed that the five Regions averaged ~1TB and this coincided with 176-183 Store files for each (comprised of Hadoop’s HFiles) for the entire distributed table (ingested into HBase) for three billion records. Total equals 900 Regions and 900 Store files. The slight imbalance and an initial peak in the sizes because compaction was disabled to run automatically (due to performance issues) and manually running bot minor (combines configurable number of smaller HFiles into one larger HFile) and major reads the Store files for a region and writes to a single Store file) compaction types. Furthermore, the durations of the iterations continued to fluctuate with no distinctive trend for one billion. For three billion, at more operational level at high core CPU over May-October 2016, had similar fluctuations of 299-1600 minutes with average of ~300-375 minutes for ingestions and roughly the same amount of time for compaction (major and minor) manually run before the next ingestion iteration, which accounted for 2 months to ingest files to reach three billion.
Another major challenge faced was that Apache Drill did not have any option to force it to bind to a specific network interface. As a result, its Drillbits started used the network management instead of the InfiniBand network. Zeppelin used databricks from Spark to ingest the file that was run over the interface. Similarly, it also intermittently occurred when initializing Zeppelin and this added an additional 30 minutes to the ingestion and query of 1-3 billion rows. In addition to having to move from the 0.5.0 version (as it did not support Spark 1.5.2) to the latest snapshot (0.6.0), the Zeppelin’s Pyspark timed out the first time %pyspark was run. In fact, it was found that the user has to wait for a couple of seconds and execute the cell one more time to get Pyspark working. Another challenge with Zeppelin, even though it offers a pull-down list of notebooks, was that the notebook could only be exported as a JSON file. Saving the notebook as an html page produced empty webpages and that exhibited very poor usability. Therefore, the Zeppelin notebooks can only be open under Zeppelin. There were, however, some off-the-shelf buttons to plot data as a data visualization tool for Zeppelin.
4.2. Data Size and Ingestion Time
Three CSV files ingested to HDFS: 1) 10 records and was used for quick testing, and 2) others used for the actual benchmarking: 50 million records and the other with one and three billion records. Table 4 shows results of ingestion times.
Table 4. Hadoop ingestion time (minutes) for 50 million to 3 billion records.
| Data Size | 50 Million Records (23 GB) | 1 Billion Records (451 GB) | 3 Billion Records (10 TB) |
| Ingestion Time | ~6 min | ~2 h 5 min | ~5 h 2 min |
(1)If we set equation (1) Ti ( N ) to be the time to ingest N records, then the data ingestion efficiency (IE) for 50 million (50M), one billion (1B) and three billion (3B) was therefore:
4.3. SQL Query Results
The queries were run on Zeppelin, spark-shell, and Pyspark; all took approximately the same amount of time. This was not surprising, as they all rely on Spark SQL. Therefore, it was only reported as a single time for all three. Spark was configured to run on a Yarn-client with 10 executors, four cores with 8 GB of RAM each; therefore, each node had two executors with a total of eight cores and 16 GB memory (tests using one executor with 16 GB and eight cores on each node was slightly less efficient).
The Zeppelin code snippet used was:
%pyspark
from time import time t0 = time() df=sqlContext.read.format(‘com.databricks.spark.csv’).option(‘header’,’true’).option(‘inferS chema’,’true’).load(‘hdfs://h ermes0090:54310/dad/big_dad_all.csv’) df.registerTempTable(‘DADS1’) df.cache()
%sql SELECT Count(Episode_Duration) as EDCount, Count(Anesthetistic_Technique) as ATCount, Count(Interven_Location) as ILCount, Count(Medical_Services) as MSCount, Count(Unit_Transfer_Occurrence) as UTOCount from DADS1 where EncounterID<1000 Group By age
Drill was configured to run the Drillbits on the Hadoop DataNodes (with a single Drillbit on each node). Each Drillbit was configured with a VM heap of 4 GB and a maximum direct memory of 16 GB (standard configuration). The queries were run from both the web interface of one of the Drillbits and the sqlline command line, using the code snippet below as example. Both gave the same timing.
SELECT Count(Episode_Duration) as EDCount, Count(Anesthetistic_Technique) as ATCount, Count(Interven_Location) as ILCount, Count(Medical_Services) as MSCount, Count(Unit_Transfer_Occurrence) as UTOCount from dfs.`/dad/big_dad_all.csv` where EncounterID<1000 Group By age
The results clearly showed that Drill was five to 7.6 faster than Spark, which indeed justified its use as a low latency query-engine tool. The Phoenix and HBase benchmarking reported earlier [51] showed that HBase outperformed all of them and the HBase queries were all within a second or two. This was an astonishing performance and HBase was used, when possible, as the underlying data source for the HBDA platform.
It was surprising that the query efficiency (QE) of Drill was only 76%. It was believed at the time of running both engines that this was due to a lack of binding to the InfiniBand interface. The Drill Developers were contacted about this and there was work with them to debug for an eventual break fix. Drill’s query processes, however, were still not as efficient as that of Spark with increased database size to ingest.
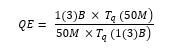 We defined Tq (N) to be the query time and its efficiency (QE) in equation (2) for 50 million (50M), one billion (1B) and three billion (3B) was defined as:
The results of the benchmarking in Table 5 clearly shows that Drill was 5 to 7.6 was faster than Spark and indeed justified its use as a low latency query engine tool.
Our Phoenix and HBase benchmarking reported earlier showed that HBase outperformed all of them and the HBase queries were all within a second or two [51]. These results were astonishing and high performance using HBase when possible, as the underlying data source for our HBDA platform. Furthermore, Spark did show improved query efficiencies from three to six billion patient records compared to less relative improvement by Drill (Figure 6).
Table 5. SQL query time (seconds) for 50 million to 3 billion records.
| SQL Engine | Spark SQL (seconds) | Drill SQL (seconds) |
| 50 Million Records | 194.4 | 25.5 |
| 1 Billion Records | 3409.8 | 674.3 |
| 3 Billion Records | 5213.3 | 1543.2 |
| Query Efficiency | 1.14-1.52 | 0.76-0.84 |
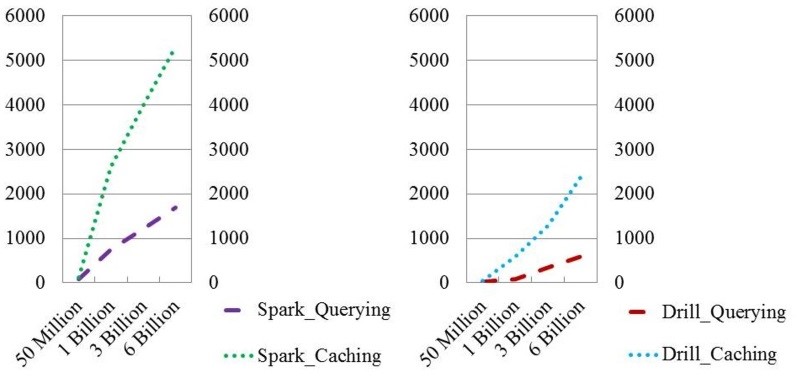
Figure 6. Projected ingestion and query results for 50 million to 6 Billion patient records using Apache Spark or Apache Drill Systems.
4.4. Usability, Simple Analytics and Visualizations
The results showed that the ingestion time of one billion records took circa two hours via Apache Spark. Apache Drill outperformed Spark/Zeppelin and Spark/Jupyter. However, Drill was restricted to running more simplified queries, and was very limited in its visualizations that exhibited poor usability for healthcare. Zeppelin, running on Spark, showed ease-of-use interactions for health applications, but it lacked the flexibility of its interface tools and required extra setup time and 30-minute delay before running queries. Jupyter on Spark offered high performance stacks not only over the BDA platform but also in unison, running all queries simultaneously with high usability for a variety of reporting requirements by providers and health professionals.
Being able to perform low latency SQL queries on a data source is not enough for healthcare providers, clinicians, and practitioners. Interacting with and exploring the data through different analytics algorithms and visualizations is usually required to get the data’s full value. A variety of functionalities and tools for expressing data was an essential quality to test over the platform.
Drill did perform well compared to Spark, but it did not offer any tools or libraries for taking the query results further. That is, Drill proved to have higher performance than Spark but its interface had less functionalities. Moreover, algorithms (as simple as correlations between different columns) were time-demanding if not impossible to express as SQL statements. Zeppelin, on the other hand, offered the ability to develop the code, generate the mark-down text, and produced excellent canned graphs to plot the patient data.
Combined with the richness of Spark and Pyspark, Zeppelin provided a canned visualization platform with graphing icons. The plots under Zeppelin, however, are restricted to the results/tables obtained from the SQL statements. Moreover, algorithms (as simple as correlation between different columns) were time demanding if not impossible to express as SQL statements. Zeppelin, on the other hand, offered the ability to develop the code, generate the mark-downed text, and produced excellent canned graphs to plot the patient data (Figure 7).
Combining with the richness of Spark and Pyspark, Zeppelin provided a canned visualization platform with graphing icons (Figure 8). The plots, however, under Zeppelin were restricted to the results/tables obtained from SQL statement. Furthermore, the results that we directly produced from Spark SQL context did not have any visualization options in Zeppelin. Generating results from queries via Zeppelin took much longer (over 30 minutes) to establish the platform to run queries on the interface compared to Jupyter.
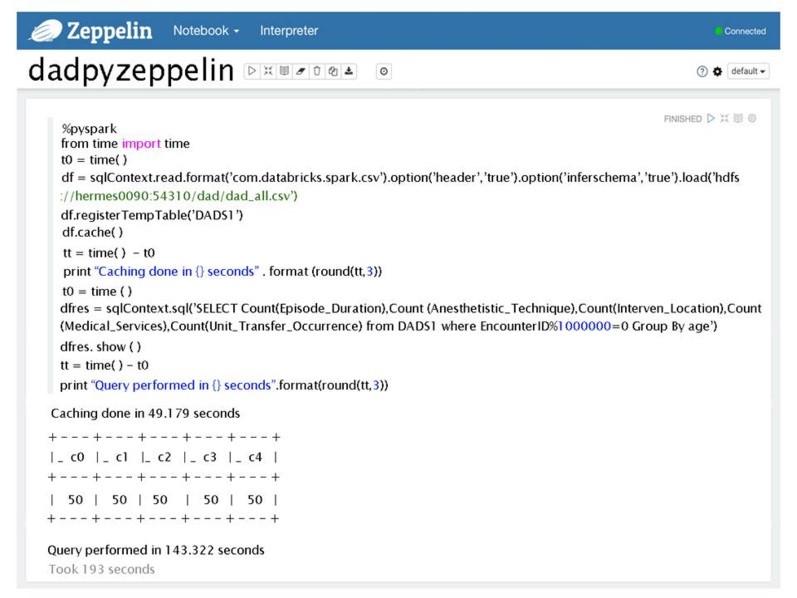
Figure 7. A web-based interface for Zeppelin showing embedded queries and the results.
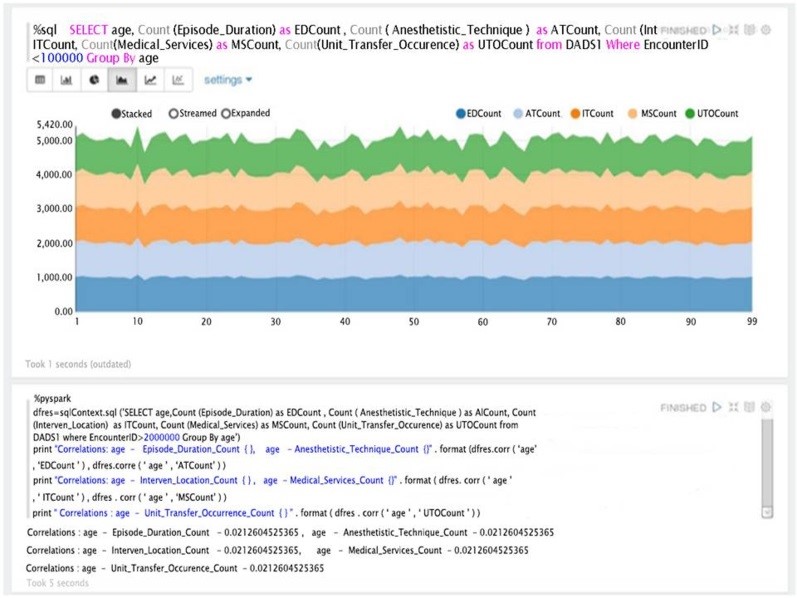
Figure 8. An example of visualization and simple correlation analytics results within Zeppelin using Pyspark.
Furthermore, the results that were produced directly from the Spark SQL context did not have any visualization options in Zeppelin. Generating results from queries via Zeppelin took much longer (over 30 minutes). Establishing the platform to run queries on the interface and generate results via Zeppelin took longer than Jupyter.
With Jupyter, more configurations with the data queries were tested. It exhibited similar code to ingest the file, same Spark databricks initialized in the interface and its SQL to query as Zeppelin (Figure 9).
At the expense of writing the visualization code, using the matlplotlib Python package in addition to other powerful tools, such as Pandas, i.e., a powerful Python data analysis toolkit. The local host was added to Hermes node to access Jupyter via the BDA platform to compensate for the lack of visualization options via the Zeppelin interface. Figure 10 shows a small snippet from the output of a Jupyter/Spark interaction that uses both matlplotlib and Java’s Pandas.
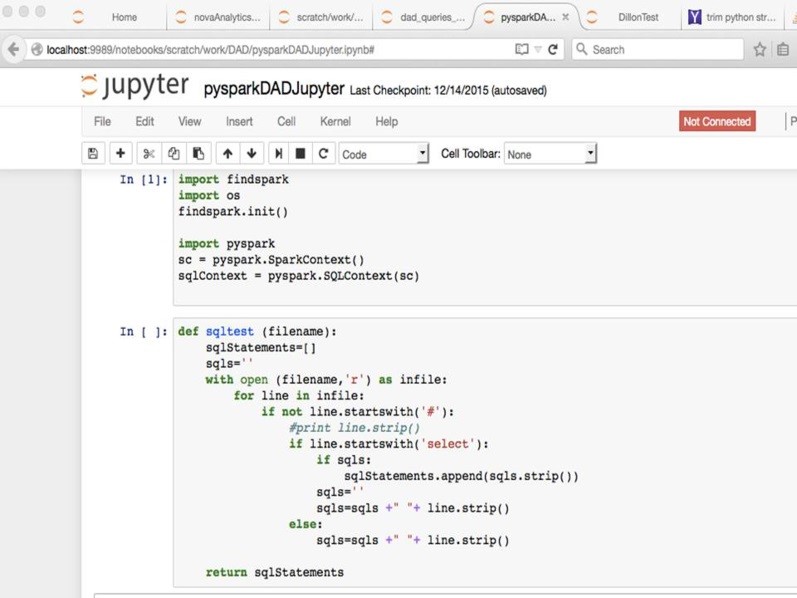
Figure 9. Spark with Jupyter and loading file before SQL is placed.
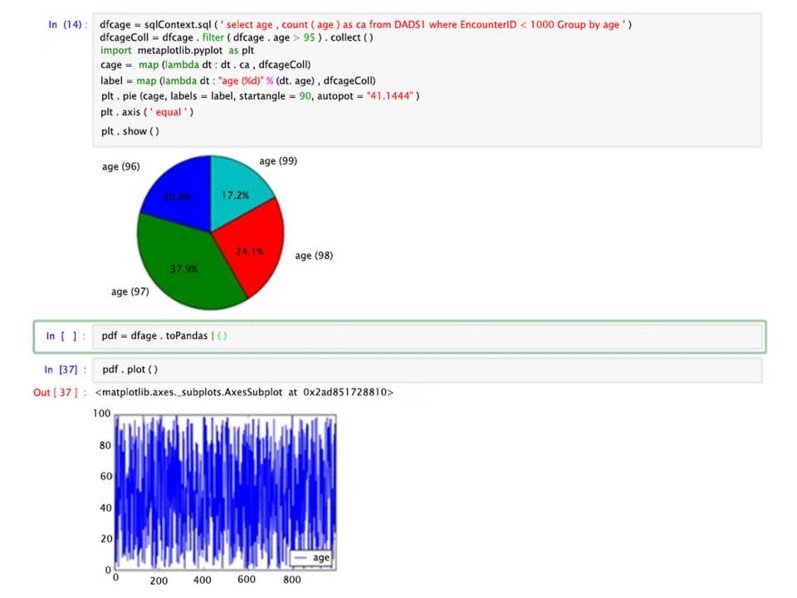
Figure 10. A simple Jupyter/Spark interaction on its web-based interface with data visualizations using Pandas and graphed results.
Usability of the platform did validate the proof-of-concept of querying patient data with high performance in generating results and visualization over the interface. Performance to generate results had the same number of sequence steps for the end users as HBase, Spark and Drill.
Running Apache Spark took the same amount of time for queries on Zeppelin and Jupyter; however, the initial setup (to start the queries) took much longer via Zeppelin than Jupyter. Drill seemed to have simplified steps to the setup interface compared to Spark and took significantly less time; therefore, it appeared to have better usability. Nevertheless, Jupyter supplied more visualization defaults and customization than Drill for its distributed mode and its interface to run the query where severely lacking any visualization.
Usability testing of our HBDA by health professionals is limited in this study. Running modules in sequence from Hadoop to Spark or Drill with web clients is too technical for most end
users and it would require additional refinements to the interface for producing clinical reports. We placed code in both Zeppelin and Jupyter Notebooks to run all queries at once over the database and Hadoop running. However, the only stakeholders that would benefit from this code change or utilization would be the data warehouse team.
5. Discussion
A Hadoop/MapReduce framework successfully formed our HBDA platform for health applications. Very few studies have applied big data technologies to patient data of hospital system for healthcare applications. Moreover, no studies have tested a variety of big data tools in Hadoop’s ecosystem of packages. The platform successfully implemented a BDA platform and tested it for healthcare applications with moderate resources and able to run realistic ANSI-SQL (Drill) SQL-like (Spark) queries on three billion records and perform interactive analytics and data visualizations. An integrated solution eliminates the need to move data into and out of the storage system while parallelizing the computation, a problem that is becoming more important due to increasing numbers of sensors and resulting data in healthcare. Furthermore, usability goals based end user computing of the Big Data technologies and leveraging the existing tools from data warehouse at a health authority is important to make a stand on to use the best Apache tools. In this case, Apache Drill and Spark with Zeppelin or Jupyter proved to be an important test over the one-three billion records because they had not only different performances but also much greater differences in their usability during operational simulation. Therefore, our study accomplished a working Hadoop ecosystem that is applicable to large volumes of patient data.
The sheer volume of 3 billion indexed and ~9-10 billion generated shows that one platform could not only be operational and productive for one hospital but many and even at a provincial scale in Canada or statewide in other countries. The volume achieved at a productive and operational level in our study can also further lead to simulations that are more rigorous. Part of the established simulations and its representation of health informatics metadata were formulated in the formation of NoSQL HBase database, as well as the ANSI-SQL (Drill) SQL-like (Spark) data queries displaying results. Few studies have produced a platform of the NoSQL database that tested ANSI-SQL and SQL-like data queries of patient data of a hospital system and this study adds to big data technologies, data simulation and healthcare applications over large volumes. Hence, this study achieved the three V’s that define Big Data [4]: high performance (velocity) over its generator of detailed data (variety) that formed extremely large volumes (volume) significantly contributed to ongoing development of Information Management and Information Technology (IMIT) in healthcare.
While ingestions in this study were extremely fast, the bulkloads of 50 million rows in iteration to one and three billion were slow and took, collectively, one week and up to two months, respectively. Ingestions beyond three billion were even slower, but these times are as fast as or faster than current data migrations (of a similar size) estimated at VIHA. The ingestion times achieved required several reconfigurations of HBase and Hadoop to increase the time to distribute the data; these involve changes in the site, yarn, and RegionServer XMLs. MapReduce was to blame for the time needed to ingest 50 million rows varied widely (from 2 to 12 hours). The corresponding Java coding, Java Virtual Machines (JVMs), and Java services were a performance bottleneck, which is common on most platforms [22, 39], especially memory loss due to Reducer process of MapReduce [65]. This demonstrated operationally that while Hadoop/MapReduce did have high performance efficiencies its clusters did break that required ongoing maintenance and this is common across Hadoop clusters (cf. [66]). However, significance of using the MapReduce programming model on top of the Hadoop cluster proved a process of large volumes of clinical data can be accomplished. More importantly, query times were less than two seconds for all queries, which is significantly faster than current estimated query times. Since there were no differences in query durations observed, and since HBase is linearly scalable, it is expected that query durations would decrease with an increase in the number of nodes and be within a few milliseconds as nodes approached 100, even at ten billion rows.
Clearly, this study showed that Drill, a software addition to Hadoop developed recently in 2015-2016 [62-63], significantly outperformed the other Apache tools. Drill outperformed Spark and Phoenix in HBase processes before queries generated. However, its interface lacked any functionality to customize and mine the data, which is what health professionals require (because of the complexity of the data and what its clinical reporting should reveal). Furthermore, running modules Spark or Drill with web clients over Hadoop cluster is far too technical for most end users to generate clinical reports. This poor usability contradicts the recommendations by Scott [62] in that in most cases Drill should be used instead of Spark in this showdown of using SQL over big data platforms. Drill had on Drill’s interface to test usability but Spark had other interfaces (like Jupyter and Spark), which no other studies have produced results on. Furthermore, this study provided new insight into more customized Java coding with the combination of Jupyter with Spark that enhanced the platform’s dynamic interactivity. It is therefore recommended that Spark with Jupyter be used with scripted coding to run ingestion and queries simultaneously. The code can be placed in both Zeppelin and Jupyter Notebooks to run all queries at once over the database. However, the only stakeholders that would truly benefit from this code change and its utilization would be the data warehouse team. Besides, Scott [62] indicated that the battlefield for the best Big Data software solutions is between Spark and Drill and that Drill can emulate complex data much more efficiently than Spark because Spark requires elaborate Java, Python and Scala coding to do so. Nonetheless, both Spark and Drill were significantly faster than HBase in ingesting files directly into Hadoop via Drillbits (Drill) with ZooKeeper and MapReduce, and RRD transformations with MapReduce (Spark). In fact, the ingestion and queries for both Spark and Drill could be run in sequence instead of having to run compaction as well. However, it is
difficult to compare since neither Spark nor Drill indexed the files. Absence of indexing increases the risk of inaccuracies (even though the framework was more fault-tolerant when running Spark and Drill). Therefore, the big data tools and inherent technologies highly influence the health informatics of the data established and resulting data from queries.
The most impactful technology of the Big Data technical components in this study was MapReduce (and Java code therein). MapReduce methodology is inherently complex as it has separate Map and Reduce task and steps in its default-programming framework as this study discovered. This study’s platform was highly dependent on the efficiency of MapReduce in ingesting files over the six nodes, using this workflow: Input à Map à Copy/Sort à Reduce à Output similar to a study by Chen, Alspaugh, and Katz [67]. The Map part of the platform showed high performance but the Reduce took more than tenfold longer to complete its schedule; however, once configurations in Yarn, ZooKeeper, and others the Reducer optimized at iterations of 50 million rows. According to blogs and technical resolutions involved enabling or disabling services or xml settings over the platform as expected to be carried because the system relied heavily on InfiniBand (IB) bandwidth at low latency over WestGrid nodes. Furthermore, there are known issue with the combination of MapReduce to HBase, although studies have shown that additional indexing and reduction processes can be added and/or modified at the reducer with an advanced programming method [22, 23, 39, 68-69]. However, a customized reduction at the Reducer level of this platform proved to be difficult to overcome and maintain at less than 3 hours for each of the iterations at only 50 million rows at file size 258GB.
The complex nature of HBase means that it is difficult to test the robustness of the data in emulations based on real data. This complexity somewhat rejects our hypothesis that noSQL database accurately simulates patient data. Nevertheless, several steps are standardized by hospitals to prepare the DAD database for statistical rendering to CIHI. Moreover, the actual columns used in this study are similar ones used by VIHA. Additionally, the DAD data also makes calculations by add columns in the data warehouse. Adding columns to a NoSQL database is much easier than adding columns to a SQL relational database, and von der Weth and Datta [70] showed good performance of multi-term keyword searches over noSQL. Therefore, it is an advantage to have a large database with row keys and column families already set up; Xu et al., [36] support this, as their middleware ZQL could easily convert relational to non-relational data.
Essentially this study is proposing a row-column key-value (KV) model to the data distributed over a customized BDA platform for healthcare application. Wang, Goh, Wong, and Montana [71] support this study’s claim in their statement that NoSQL provided high performance solutions for healthcare, being better suited for high-dimensional data storage and querying, optimized for database scalability and performance. A KV pair data model supports faster queries of large-scale microarray data and is implemented using HBase (an implementation of Google’s BigTable storage system). The new KV data model implemented on HBase exhibited an average 5.24-fold increase in high-dimensional biological data query performance compared to the relational model implemented on MySQL Cluster and an average 6.47-fold increase on query performance on MongoDB [22]. Freire et al., [40] showed highest performance of CouchDB (similar to MongoDB and document store model) but required much more disk space and longer indexing time compared to other KV stores. The performance evaluation found that KV data model, in particular its implementation in HBase, outperforms and, therefore, supports this studies use of NoSQL technology for large-scale BDA platform for a hospital system. HBase schema is very flexible, in that new columns can be added to families at any time; it is therefore able to adapt to changing application requirements [72-73]. HBase clusters can also be expanded by adding RegionServers hosted on commodity class servers, for example, when a cluster expands from 10 to 20 RegionServers, it doubles both in terms of storage and processing capacity. Sun [74] lists the following notable features of HBase: strongly consistent reads/writes; “Automatic sharding” (in that HBase tables distributed on the cluster via regions can be automatically split and re-distributed as data grows); automatic RegionServer failover; block cache and “blooming” filters for high-volume query optimization; and built-in web-applications for operational insight along with JMX (i.e., Java memory) metrics. However, HBase settings had to be purged and cleaned after each of the ingestions due to unknown tracers or remnants of transactions that then later caused failure, and compaction was run manually to improve performance; therefore, robustness of HBase needs further investigation.
The present study showed that performing maintenance and operational activities over the platform were essential for high availability. Unbalanced ingestions required removing files and starting again. Some studies have shown that Hadoop can detect task failure and restart programs on healthy nodes, but if the RegionServers for HBase failed, this process had to be started manually and other studies confirm this problem [37, 39, 75-77]. Our study showed that compaction improved the number of successful runs of ingestion; however, it did not prevent failure of the nodes, a finding that is supported by other studies [23, 24, 31, 68, 78]. If a node failed, the partly ingested file had to be cleaned up, re-run, and re-indexed. The platform, therefore, showed a single point of failure.
Data privacy in healthcare involves restricted access to patient data but there are often challenging situations when using hospital systems and attempting to find new trends in the data. For instance, on one hand there are workarounds to access patient data in critical situation like sharing passwords that goes against HIPAA and FIPPA Acts [79]. There are strict rules and governance on hospital systems with advanced protection of privacy of patient data based on HIPAA [80-81] that must take into consideration when implementing a BDA platform. It’s
processing and storage methods must adhere to data privacy at a high level and also the accessibility of the data for public disclosure [82-84]. One method of ensuring that patient data privacy/security is to use indexes generated from HBase, which can securely encrypt KV stores [36, 85-87], and HBase can further encrypt with integration with Hive [35]. Scott [62] also stated that Drill is already setup for encryption for HIPPA but we did not find this out-of-the-box and attempting to encrypt was time consuming.
There are a large number of developers working on additional libraries for Hadoop like Lucene and Blur [38]. For example, Hadoop R, in particular, provides a rich set of built-in as well as extended functions for statistical, machine learning, and visualization tasks such as: data extraction, data cleaning, data loading, data transformation, statistical analysis, predictive modeling, and data visualization. Also, SQL-like queries can be run via Hive as a data warehouse framework for ad hoc querying that can be used with HBase, although no real-time complex analyses can be performed [35]. More investigation of this study’s different libraries of a variety of packages offered in Hadoop’s ecosystem (many of have not been used in healthcare applications) is crucial to ascertaining the best possible BDA platform.
6. Conclusion
Our HBDA platform showed high performance tested for healthcare applications. With moderate resources, we were able to run realistic SQL queries on three billion records and perform interactive analytics and data visualization using Drill, Spark with Zeppelin or Jupyter. The performance times proved to improve over time with repeated sessions of the same query via the Zeppelin and Jupyter interfaces. An ingesting and using CSV file on Hadoop also had its advantages (i.e. simplicity, CSV exports and imports commonly carried out in healthcare applications, fast ingestion compared to HBase) but was expensive when running Spark. Drill offers better low latency SQL engine but its application tool and visualization were very limited to customization, and, therefore, had lower usability. Useful knowledge gained from this study included the following challenges and specific objectives:
(1) data aggregation – actual storage doubled compared to what was expected due to HBase key store qualifiers, Spark and Drill had the same procedure to ingest Hadoop file before running SQL queries;
(2) data maintenance – ingestions to the database required continual monitoring and updating versions of Hadoop-MapReduce and HBase with limitations persisting for MapReduce (ultimately Java performance in the Reducer) from one to three billion;
(3) data integration –
- combination of ADT and DAD possible with simulated patient data and followed current clinical reporting but required a data model of the row keys and column families and this needs to be further tested;
- study’s three billion indexed data at 30TB equalled six times more rows than current production and archived at most health authorities, which is said to be 500 million rows on average for a health authority with up to three billion for the entire Province;
iii. large volumes at different scales, i.e. hospital, health authority, Province, and multiple Provinces, can be achieved if ADT and DAD can be formed to flat file of CSV format
- data model was only verified via simplified analytical queries of simulated data as a benchmark test, but not fully integrated to a defined patient data model and health informatics.
(4) data analysis – high performance of 3.5 seconds for three billion rows and 90 columns (30TB of distributed files) achieved with increasing complexity of queries with high performance of Drill to run queries and high usability with customized Spark with Jupyter; and
(5) pattern interpretation of application – randomized patterns found via Spark with Jupyter interface; however, health trends cannot be found via the application and further investigation required using Hadoop’s Machine Learning Libraries (MLLib).
Conflict of Interest
Authors have no conflict of interest.
Acknowledgment
The authors would like to acknowledge WestGrid for their support. This project was partially supported by 2015-2016 Research Seed Grant Competition, VIHA. Special thanks go to Mr. Hamid Zamani for his exceptional work as research assistant.
- J. Gantz, D. Reinsel, “The Digital Universe in 2020: Big Data, Bigger Digital Shadows, and Biggest Growth in the Far East,” Study report, IDC,URL [www.emc.com/leadership/digital-universe/index.htm. (2012).
- J. Sun, C.K. Reddy, “Big Data Analytics for Healthcare,” Tutorial presentation at SIAM Inter. Conf. Data Mining, Austin, TX., (2013).
- J. Manyika, M. Chui, J. Bughin, B. Brown, R. Dobbs, C. Roxburgh, B. Hung, “Big Data: The next frontier for innovation, competition, and productivity,” URL:http://www.mckinsey.com/insights/business_tech nology/big_data_the_next_frontier_for_innovation, (2014).
- Canada Health Infoway, Big Data Analytics: Emerging Technology Series, White Paper (Full Report), Ottawa, ON, (2013).
- World Health Organization (WHO), Atlas of eHealth Country Profiles – The use of eHealth in support of universal health coverage, WHO Press, Geneva, Switzerland, ISBN 978-92-4-156521-9, (2016).
- J. Alder-Milstein, A.K. Jha, “Healthcare’s “Big Data” challenge,” Am. J. Manag. C., 19(7): 537-560 (2013).
- E. Baro, S. Degoul, R. Beuscart, E. Chazard. “Toward a literature-drive definition of big data in healthcare,” BioMed Res. Intern., ID 639021, 9 pages, (2015).
- M.-H. Kuo, T. Sahama, A.W. Kushniruk, E.M. Borycki, D. Grunwell, “Health Big Data Analytics: Current Perspectives, Challenges and Potential Solutions,” Int. J. Big Data Intel, 1(12): 114–126 (2014).
- M.M. Hansen, T. Miron-Shatz, A.Y.S. Lau, C. Paton, “Big Data in Science and Healthcare: A Review of Recent Literature and Perspectives,” Yearb. Med. Inform., 9(1): 21-26 (2014).
- R. Nelson, N. Staggers, Health Informatics: an interprofessional approach, Mosby, imprint of Elsevier Inc.; 2014. Saint Louis, MO, (2014).
- B. Wang, R. Li, W. Perrizo, Big Data Analytics in Bioinformatics and Healthcare, 1st edition, Med. Info. Sci. Ref. – IGI Global, Kansas City, MO, (2014).
- D. Agrawal, P. Bernstein, E. Bertino, S. Davidson, U. Dayal, M. Franklin, J. Gehrke, L. Hass…etc, “Challenges and Opportunities with Big Data,” Big Data – White Paper, Computing Research Association, (2012).
- H. Chen, H.L. Chiang, C. Storey, “Business intelligence and analytics: from Big Data to big impact,” MIS Q 36(4): 1-24 (2012).
- H. Demirkan, D. Delen, “Leveraging the capabilities of service-oriented decision support systems: Putting analytics and Big Data in cloud,” Decis Support Syst., 55(1): 412-421 (2013).
- L.P. Jr. Garrison, “Universal Health Coverage-Big Thinking versus Big Data,” Value Health 16(1): S1-S3 (2013).
- N.H. Shah, D. Tenenbaum, “The coming age of data-driven medicine: translational bioinformatics’ next frontier,” J. Am. Med. Inform. Assoc., 19: e2-e4 (2012).
- T. White, Hadoop – The Definitive Guide: Storage and analysis at internet scale, O’Reilly Media, San Francisco, CA, ISBN 978-1-491-90163-2, (2015).
- Hadoop, “Apache Hadoop,” [http://Hadoop.apache.org.], (2016).
- R. Jurney, Agile data science: building data analytics applications with Hadoop, O’Reilly Media, San Francisco, CA, (2013).
- R. Karim, C.F. Ahmed, B.-S. Jeong, H.J. Choi, “An Efficient Distributed Programming Model for Mining Useful Patterns in Big Datasets,” IETE Tech. Rev., 30(1): 53-63 (2013).
- P. Langkafel, Big Data in Medical Science and Healthcare Management.: Diagnosis, Therapy, Side Effects, Walter de Gruyter Verlag GmbH, Berlin/Boston, (2016).
- S. Sakr, A. Elgammal, “A. Towards a comprehensive data analytics framework for smart healthcare services,” Big Data Research, 4: 44-58 (2016).
- R.C. Taylor, “An overview of the Hadoop/MapReduce/HBase framework and its current applications in bioinformatics,” BMC Bioinformatics, 11(12): S1 (2010).
- J. Dean, S. Ghemawat, “MapReduce: A Flexible Data Processing Tool,” Comm. ACM, 53(1): 72-77 (2010).
- W. Raghupathi, V. Raghupathi, “Big data analytics in healthcare: promise and potential,” Health Info. Sci. Syst., 2:3, 10 (2014).
- E.A. Mohammed, B.H. Far, C. Naugler, “Applications of the MapReduce programming framework to clinical big data analysis: current landscape and future trends,” BioData Mining, 7(22): 23 (2014).
- T. Dunning, E. Friedman, Real-World Hadoop, O’Reilly Media, San Francisco, CA, (2010).
- ZooKeeper, “ZooKeeper – Apache Software Foundation project home page,” [http://Hadoop.apache.org/ZooKeeper/], (2016).
- HBase, “HBase – Apache Software Foundation,” [http://Hadoop. apache.org/HBase/], (2016).
- R.S. Chang, C.-S. Liao, K.Z. Fan, C.-M. Wu, “Dynamic Deduplication Decision in a Hadoop Distributed File System,” Int. J. Distrib. Sens. Networks, Article ID 630380, 14 (2014).
- A.B.M Moniruzzaman, S.A. Hossain, “NoSQL Database: new era of databases for Big Data Analytics – Classification, Characteristics and Comparison,” Int. J. Database Theo. App., 6(4): 1-14 (2013).
- H. Karau, A. Konwinski, P. Wendell, M. Zatharia, Learning Spark: Lightning-Fast Big Data Analysis, O’Reilly Media, San Francisco, CA, (2015)
- K. Sitto, M. Presser, Field Guide to Hadoop – An Introduction to Hadoop, Its Ecosystem, and Aligned Technologies, O’Reilly Media, San Francisco, CA, (2015).
- Hive, “Hive – Apache Software Foundation project home page,” [http://Hadoop.apache.org/hive/], (2016).
- Hive HBase, “Hive-HBase Integration project home page,” [http://wiki.apache.org/Hadoop/Hive/HBaseIntegration], (2016).
- J. Xu, M. Shi, C. Chen, Z. Zhang, J. Fu, C.H. Liu, “ZQL: A unified middleware bridging both relational and NoSQL databases,” IEEE 14th Int. Conf. Dependable, Autonomic and Secure Computing, Pervasive Intelligence and Computing, 2nd Intl Conf on Big Data Intelligence and Computing and Cyber Science and Technology Congress, 730-737, (2016).
- A. Lith, J. Mattson, “Investigating storage solutions for large data: a comparison of well performing and scalable data storage solutions for real time extraction and batch insertion of data,” MSc Thesis, Chalmers University of Technology, Gӧteborg, Sweden, (2010).
- W. Seo, N. Kim, S. Choi, “Big Data Framework for Analyzing Patents to Support Strategic R&D Planning.” IEEE 14th Int. Conf. Dependable, Autonomic and Secure Computing, Pervasive Intelligence and Computing, 2nd Intl Conf on Big Data Intelligence and Computing and Cyber Science and Technology Congress, 746-753 (2016).
- M. Maier, “Towards a Big Data Reference Architecturem,” MSc Thesis. Eindhoven University of Technology, Netherlands, (2013).
- S.M. Freire, D. Teodoro, F. Wei-Kleiner, E. Sundsvall, D. Karlsson, P. Lambrix, “Comparing the Performance of NoSQL Approaches for Managing Archetype-Based Electronic Health Record Data,” PLoS ONE 11(3): e0150069 (2016).
- H, Nordberg, K. Bhatia, K. Wang, Z. Wang, “BioPig: a Hadoop-based analytic toolkit for large-scale sequence data,” Bioinformatics 29(23): 3014–3019 (2013).
- N.A. Miller, E.G. Farrow, M. Gibson, L.K. Willig, G. Twist, B. Yoo, T. Marrs, S. Corder, L. Krivohlavek, A. Walter, J.E. Petrikin, C.J. Saunders, I. Thiffault, S.E. Soden, L.D. Smith, D.L. Dinwiddie, S. Herd, J.A. Cakici, S. Catreux, M. Ruehle, S.F. Kingsmore, “A 26-hour system of highly sensitive whole genome sequencing for emergency management of genetic diseases,” Genome Med. Sep 30, 7(1): 100 (2015).
- G.P. Twist, A. Gaedigk, N.A. Miller, E.G Farrow, L.K. Willig, D.L. Dinwiddie, J.E. Petrikin, S.E. Soden, S. Herd, M. Gibson, J.A. Cakici, A.K. Riffel, J.S. Leeder, D. Dinakarpandian, S.F. Kingsmore, “Constellation: a tool for rapid, automated phenotype assignment of a highly polymorphic pharmacogene, CYP2D6, from whole-genome sequences,” NPJ Genomic Med. 1, 15007, (2016).
- C.J. Saunders, N.A. Miller, S.E. Soden, D.L. Dinwiddie, A. Noll, N.A. Alnadi, et al., “Rapid Whole-Genome Sequencing for Genetic Disease Diagnosis in Neonatal Intensive Care Units,” Sci. Trans. Med. 4(154): 154ra135 (2012).
- C.J.M. Tauro, S. Aravindh, A.B. Shreeharsha, “Comparative Study of the New Generation, Agile, Scalable, High Performance NOSQL Databases,” Int. J. Comp. App. 48(20): 1-5 (2012).
- J.M Tien, “Big Data: unleashing information,” J. Syst. Sci. Syst. Eng., 22(2): 127-151 (2013).
- C. Zhang, “Supporting multi-row distributed transactions with global snapshot isolation using bare-bones HBase,” GRID, 11th IEEE/ACM Int. Conf., 25-28, Waterloo, Canada, (2010).
- K. Moselle, “Data Management in the Island Health Secure Research Environment,” Enterprise Architecture at Vancouver Island Health Authority, Working Draft 5, Victoria, BC, (2015).
- E. Pattuk, M. Kantarcioglu, V. Khadilkar, H. Ulusoy, S. Mehrotra, “BigSecret: A secure data management framework for key-value stores,” Tech. Rep. [http://www.utdallas.edu/~exp111430/techReport.pdf] [Access December 2015], (2013).
- M.K. Ross, W. Wei, L. Ohno-Machado, “Big Data” and the Electronic Health Record,” Yearb. Med. Inform., 97-104, (2014).
- D. Chrimes, M.-H. Kuo, B. Moa, W. Hu, Towards a Real-time Big Data Analytics Platform for Health Applications. Int. J. Big Data Intel., In Press, (2016).
- H. Chen, S.S Fuller, C. Friedman, W. Hersh, “Knowledge management, data mining, and text mining in medical informatics,” In: H. Chen, S.S. Fuller, C. Friedman, W. Hersh (Eds.). Medical Informatics: knowledge management and data mining in biomedicine. Springer, pp. 20-40, (2005).
- D. Li, H.W. Parl, M.I. Ishag, E. Batbaatar, K.H. Ryu, “Design and Partial Implementation of Health Care System for Disease Detection and Behavior Analysis by Using DM Techniques,” IEEE 14th Int. Conf. Dependable, Autonomic and Secure Computing, Pervasive Intelligence and Computing, 2nd Intl Conf on Big Data Intelligence and Computing and Cyber Science and Technology Congress, 781-786, 2016.
- D. Chrimes, B. Moa, H. Zamani, M-H. Kuo, “Interactive Healthcare Big Data Analytics Platform under Simulated Performance,” IEEE 14th Int. Conf. Dependable, Autonomic and Secure Computing, Pervasive Intelligence and Computing, 2nd Intl Conf on Big Data Intelligence and Computing and Cyber Science and Technology Congress, 811-818.
- F. Chang, J. Dean, S. Ghemawat, W.C. Hsieh, D.A. Wallach, M. Burrows, T. Chandra, A.E. Fikes, “Bigtable: A distributed storage system for structured data,” Seventh Symposium on Operating System Design and Implementation (ODI) Seattle, WA: Usenix Association, 205-18, (2006).
- M.-H. Kuo, D. Chrimes, B. Moa, X. Hu, “Design and Construction of a Big Data Analytics Framework for Health Applications,” IEEE Proceedings Int. Conf. on Smart City/SocialCom/SustainCom together with DataCom 2015 and SC2 2015, Chengdu, China. 631-636 (2015).
- Canadian Institute of Health Information (CIHI), “DAD Abstracting Manual: Province-Specific Information for British Columbia,” Ottawa, ON. CIHI Publishing, (2012).
- Cloudera, “Integrating Hive and HBase – Cloudera Developer Center,” [http://http://www.cloudera.com/blog/2010/06/integrating-hive-and-HBase/], (2016).
- D. Henschen, “Emerging Options: MapReduce, Hadoop,” Young, But Impressive, Inform. Week, 24 (2010).
- Apache Phoenix, “Apache Spark Plugin,” https://phoenix.apache.org/ phoenix_spark.html, (2016).
- B. Dhyani, A. Barthwal, “Big Data Analytics using Hadoop,” Int. J. Comp. App., 108(12): 1-5 (2014).
- J. Scott, “Apache Spark vs. Apache Drill. Converge Blog, Powered by MapR.,” [https://www.mapr.com/blog/apache-spark-vs-apache-drill] [accessed October 12, 2016], (2015).
- T. Dunning, E. Friedman, T. Shiran, J. Nadeau, Apache-Drill, O’Reilly Media, San Francisco, CA, (2016).
- W.K. Lai, Y.-C. Chen, T.-Y. Wu, M.S. Obaidat, “Towards a framework for large-scale multimedia data storage and processing on Hadoop platform,” J. Supercomp., 68: 488–507 (2014).
- S.M. Nabavinejad, M. Goudarzi, S. Mozaffari, “The Memory Challenge in Reduce Phase of MapReduce Applications,” J. Latex Class Files, Transactions on Big Data IEEE, 14(8) (2016).
- A. Rabkin, R.H. Katz, “How Hadoop Clusters Break,” IEEE Software, July/August, 88-95 (2013).
- Y. Chen, S. Alspaugh, R. Katz, “Interactive Analytical Processing in Big Data Systems: A Cross-Industry Study of MapReduce Workloads,” Proceedings of the VLDB Endowment 5(12): 1802–1813 (2012).
- A.L. Greeshma, G. Pradeepini, “Input split frequent pattern tree using MapReduce paradigm in Hadoop,” J. Theo. App. Inform. Tech., 84(2): 260-271 (2016).
- S.C. Yu, Q.-L. Kao, C.R. Lee, “Performance Optimization of the SSVD Collaborative Filtering Algorithm on MapReduce Architectures,” IEEE 14th Int. Conf. Dependable, Autonomic and Secure Computing, Pervasive Intelligence and Computing, 2nd Intl Conf on Big Data Intelligence and Computing and Cyber Science and Technology Congress, 612-619 (2016).
- C. von der Weth, A. Datta, “Multi-term Keyword Search in NoSQL Systems,” IEEE Internet Computing, January/February, 34-43 (2012).
- Y. Wang, W. Goh, L. Wong, G. Montana, “Random forests on Hadoop for genome- wide association studies of multivariate neuroimaging phenotypes,” BMC Bioinformatics 14(16): 1–15 (2013).
- S. Nishimura, S. Das, D. Agrawal, A.E. Abbadi, “MD-HBase: design and implementation of an elastic data infrastructure for cloud-scale location services,” Springer Science+Business Media, LLC, (2012).
- A.V. Nguyen, R. Wynden, Y. Sun, “HBase, MapReduce, and Integrated Data Visualization for Processing Clinical Signal Data,” AAAI Spring Symposium: Computational Physiology, (2011).
- J. Sun, “Scalable RDF store based on HBase and MapReduce,” Advanced Computer Theory and Engineering (ICACTE), 3rd Int. Conf., Hangzhou, (2013).
- Y.-J. Chang, C.-C. Chen, J.-M. Ho, C.-L. Chen, “De Novo Assembly of High- Throughput Sequencing Data with Cloud Computing and New Operations on String Graphs,” Cloud Computing (CLOUD), IEEE 5th International Conference, 155–161 (2012).
- W-C. Chung, H.-P. Lin, S.-C. Chen, M.-F. Jiang, Y.-C. Chung, “JackHare: a framework for SQL to NoSQL translation using MapReduce,” Autom. Softw. Eng. 21: 489–508 (2014).
- H. Dutta, J. Demme, Distributed Storage of Large Scale Multidimensional EEG Data using Hadoop/HBase, Grid and Cloud Database Management, New York City: Springer, (2011)
- J. Dean, S. Ghemawat, MapReduce: Simplified Data Processing on Large Cluster, OSDI, (2004).
- R. Koppel, S. Smith, J. Blythe, V. Kothari, “Workarounds to computer access in healthcare organizations: you want my password or a dead patient?” Stud. Health. Tech. Inform., 208: 215-20 (2015).
- Canada Health Infoway and Health Information Privacy Group, Privacy and EHR Information Flows in Canada (Version 2.0), (2012).
- S. Kumar, A. Henseler, D. Haukaas, “HIPAA’s effects on US healthcare, Int. J. Health C. Q. Assurance,” 22(2): 183–197 (2009).
- J Erdmann, “As Personal Genomes Join Big Data Will Privacy and Access Shrink?” Chemistry & Biology, 20(1): 1-2 (2013).
- S. Spiekermann, C.F. Cranor, “Engineering privacy,” IEEE Trans. Soft. Eng. 35(1): 67-82 (2009).
- K.T. Win, W. Susilo, Y. Mu, “Personal health record systems and their security protection,” J. Med. Syst., 30(4): 309–15 (2006).
- N.V. Chawla, D.A. Davis, “Bringing Big Data to Personalized Healthcare: A Patient- Centered Framework,” J. Gen. Intern. Med., 28(3): S660–5 (2013).
- Z. Chen, S. Yang, S. Tan, L. He, H. Yin, G. Zhang, “A new fragment re-allocation strategy for NoSQL database systems,” Front. Comp. Sci., 9(1): 111–127 (2015).
- S. Wang, I Pandis, C. Wu, S. He, D. Johnson, I. Emam, F. Guitton, Y. Guo, “High dimensional biological data retrieval optimization with NoSQL technology,” BMC Genomics 15(8): S3 (2014).