Dynamic detection of abnormalities in video analysis of crowd behavior with DBSCAN and neural networks
Dynamic detection of abnormalities in video analysis of crowd behavior with DBSCAN and neural networks
Volume 1, Issue 5, Page No 56-63, 2016
Author’s Name: Hocine Chebia),1, Dalila Acheli2, Mohamed Kesraoui3
View Affiliations
1Doctoral student (Automatic and Industrials informatics), Faculté des hydrocarbures et de la chimie (FHC), Laboratoire d’automatique appliquée, University M’hamed Bougara Boumerdès, Algeria.
2Professor, Faculté des sciences (FS), Laboratoire d’automatique appliquée, University M’hamed Bougara Boumerdès, Algeria.
3HDR, Faculté des hydrocarbures et de la chimie (FHC), Laboratoire d’automatique appliquée, University M’hamed Bougara Boumerdès, Algeria.
a)Author to whom correspondence should be addressed. E-mail: chebi.hocine@yahoo.fr
Adv. Sci. Technol. Eng. Syst. J. 1(5), 56-63 (2016); ![]() DOI: 10.25046/aj010510
DOI: 10.25046/aj010510
Keywords: Visual analysis, Crowd behavior, Neural networks, DBSCAN, Occlusion, Shades, Intelligent video Surveillance, Classifications, Anomaly

Export Citations
Visual analysis of human behavior is a broad field within computer vision. In this field of work, we are interested in dynamic methods in the analysis of crowd behavior which consist in detecting the abnormal entities in a group in a dense scene. These scenes are characterized by the presence of a great number of people in the camera’s field of vision. The major problem is the development of an autonomous approach for the management of a great number of anomalies which is almost impossible to carry out by human operators. We present in this paper a new approach for the detection of dynamic anomalies of very dense scenes measuring the speed of both the individuals and the whole group. The various anomalies are detected by dynamically switching between two approaches: An artificial neural network (ANN) for the management of group anomalies of people, and a Density-Based Spatial Clustering of Application with Noise (DBSCAN) in the case of entities. For greater robustness and effectiveness, we introduced two routines that serve to eliminate the shades and the management of occlusions. The two latter phases have proven that the results of the simulation are comparable to existing work.
Received: 03 September 2016, Accepted: 03 October 2016, Published Online: 27 October 2016
1. Introduction
Recently, computer vision in the analysis of densely crowded environments has been very interesting. Problems such as segmenting, estimating, and determining the goal of individuals’ crowd components have all been subjects of research [1-4]. This field of research is an important application in the video surveillance intelligences and visual crowd behavior analysis. In many of these researches, the purpose is not to analyze normal crowd behavior but to detect deviations and abnormal events.
The approach suggested in this paper differs from the existing approach [5-7] by relying on detection of dynamic anomalies, which makes the detection of anomalies possible for both cases (a group or a single person).
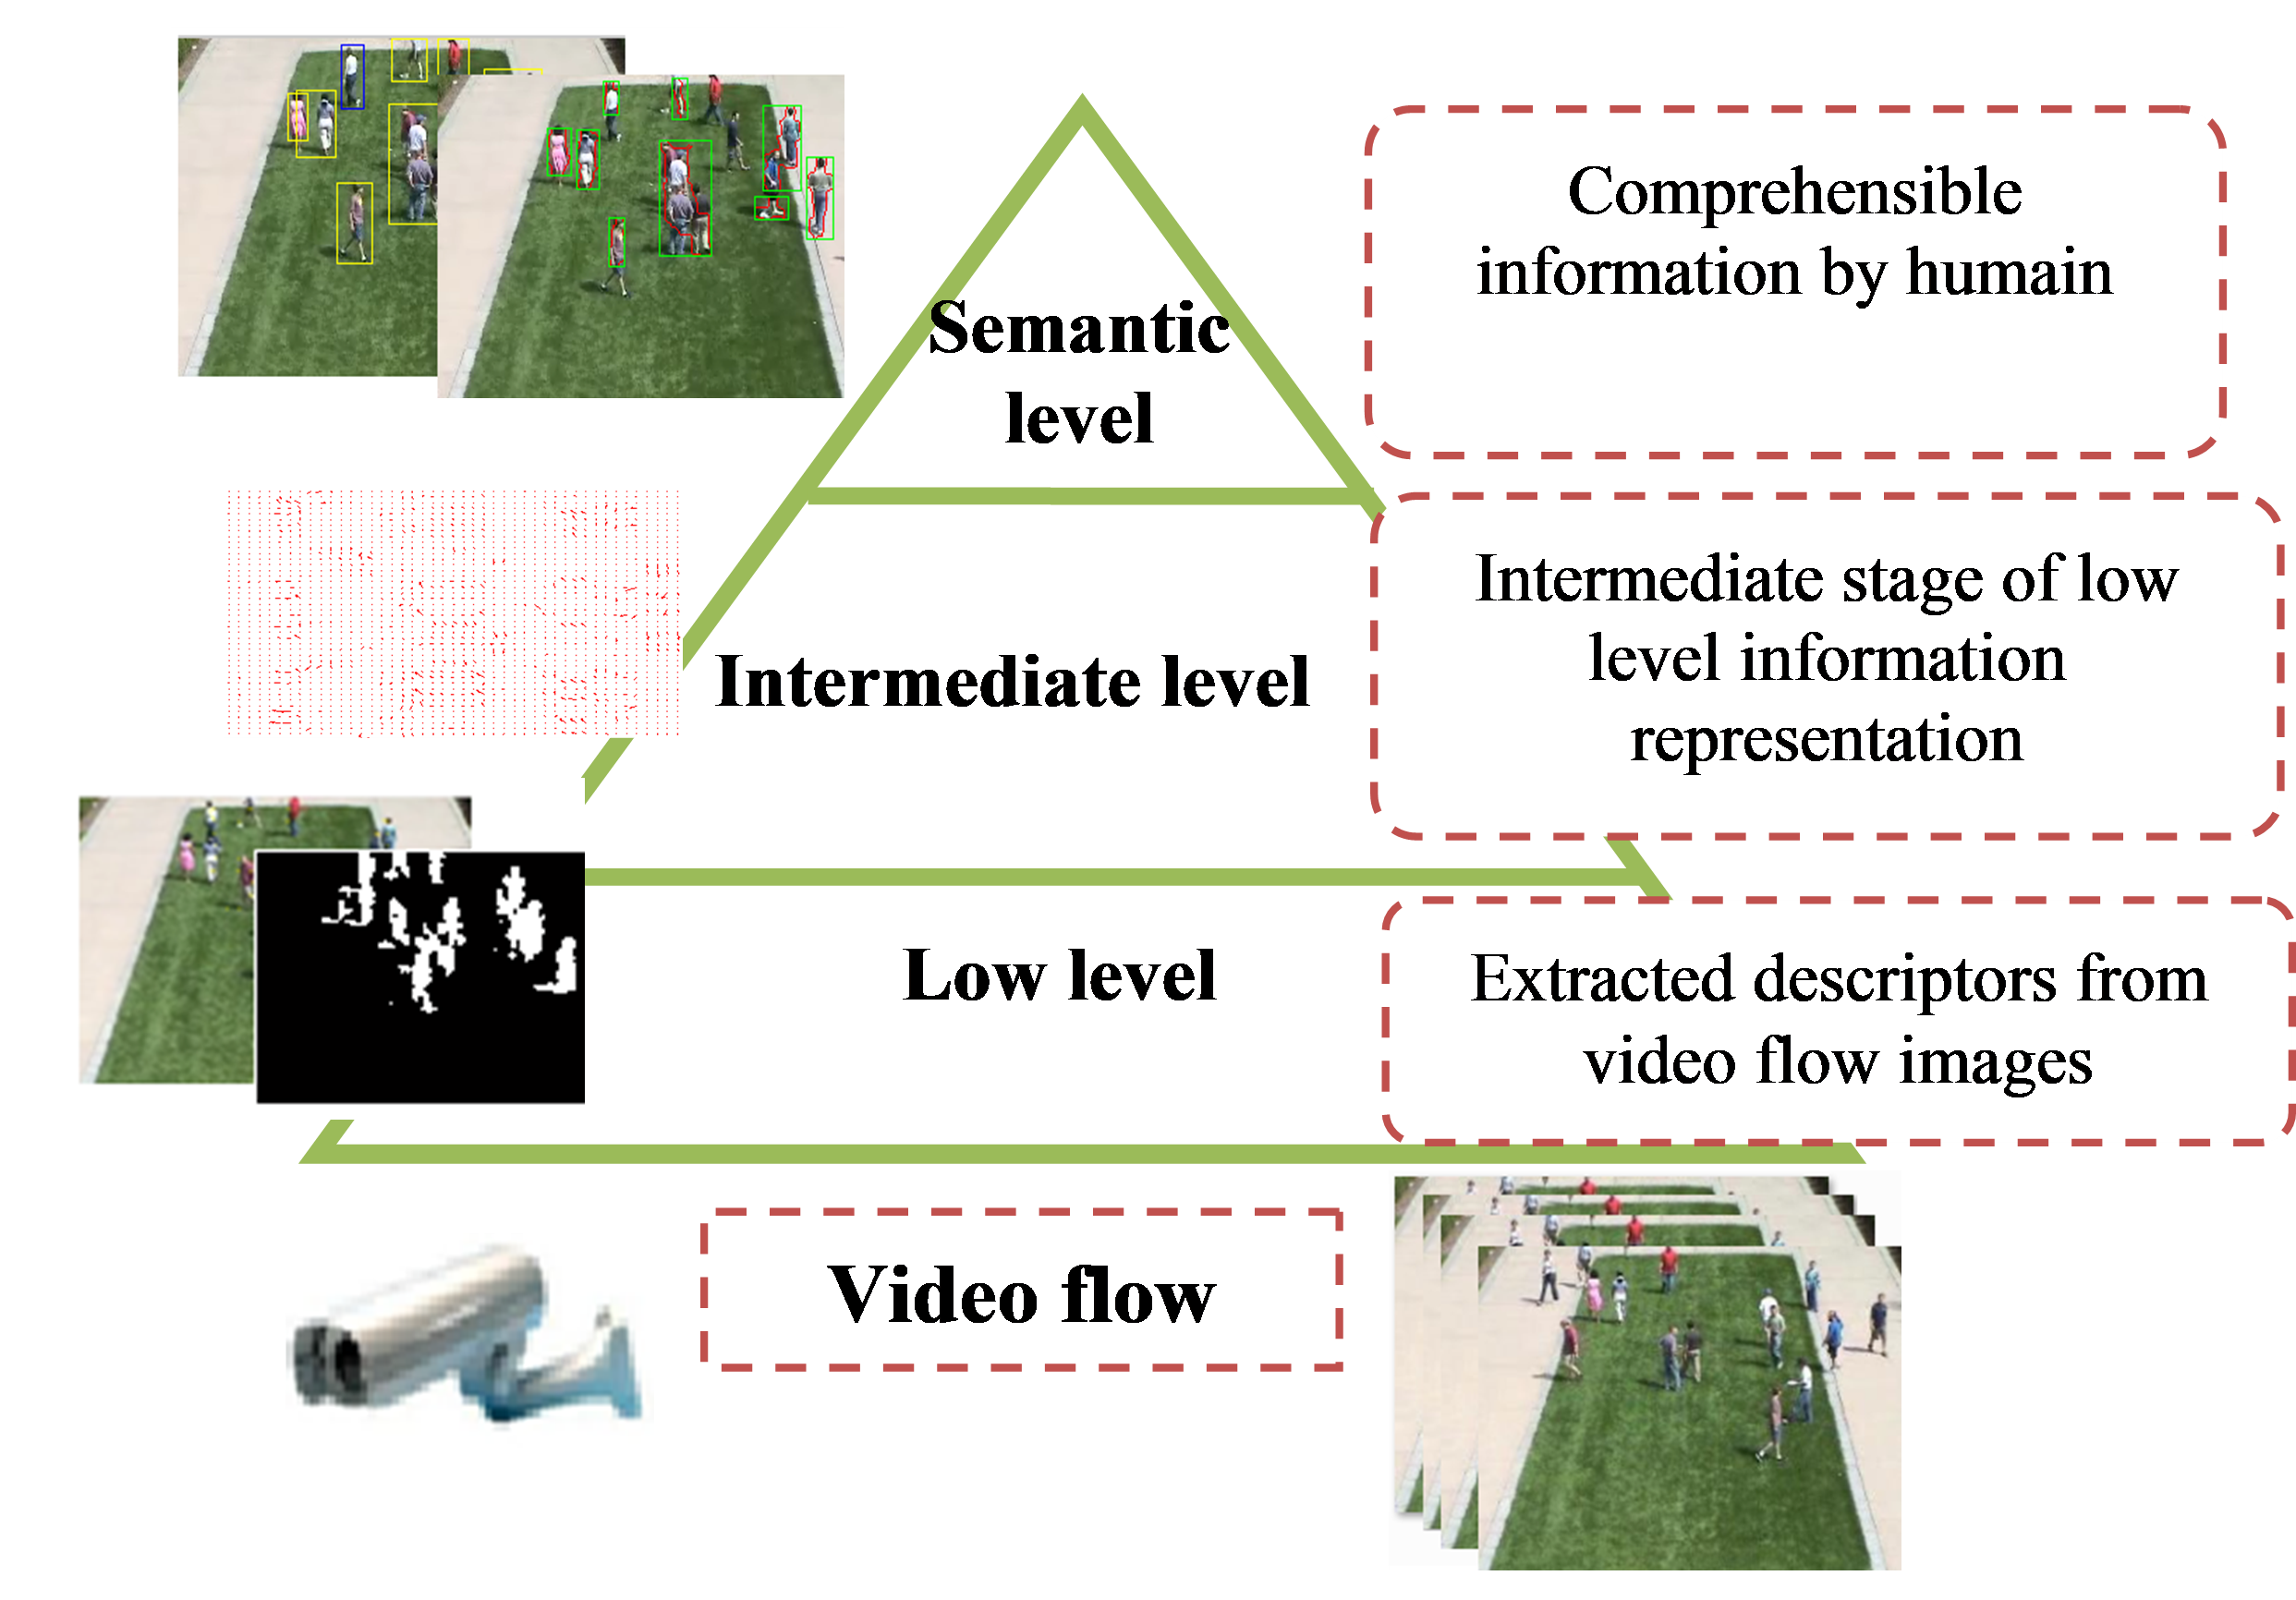
It can be divided into three sublevels: the bottom level (the estimate of optical flow), the intermediate level (construction of the model magnitude) and the semantic level (the notification of operators).
The goal of this approach is to illustrate the detection of anomalies in very dense scenes based on the speed of the individuals and that of the group. The various anomalies are detected automatically by dynamic switching between two approaches which are the artificial neural networks for the management of anomalies in a group of people, while the DBSCAN method is used to detect the entities [8, 9]. For greater robustness and effectiveness, we have introduced two routines allowing the elimination of the shades [10, 11] and the management of occlusions [11].
|
|
The rest of this paper is organized as follows: in section 2 we present a brief background on the various approaches as well as the works related to this field, and our suggested approach in order to overcome certain problems encountered in the literature. Section 3 presents the mathematical formulation of the various methods used in order to detect anomalies of the race type and walk type in a crowded scene. Finally, the results are presented in section 4 and we can conclude that new prospects for future work are provided.
2. State of the art and approach description
Crowd behavior is classified in two categories: the first one consists of estimating the density of the crowd and the second of extracting motives for movement or detecting events in a scene of a crowd and following the abnormal behavior.
In the first category we distinguish the methods based on the analysis of behavior [7-11]. These methods supply an interesting static analysis of the surveillance of the crowds but do not detect abnormal events. There are also some techniques based on optical flow [1-4] that detect stationary crowds.
In the second category the purpose is to detect abnormal events in a crowd by basing itself on the motives for movement. The principle of extraction of the motives for movement is to model the most frequent behavior and to consider the abnormal events as absurd cases. The deviation from typical behavior is used to characterize the abnormality. Several techniques were proposed for this category [12]. Combine hidden Marcov models with analysis of the main vector components of the optical flow to detect scenarios of emergencies. However, the experiments concerned simulated data. Using the dynamics of tracking behavior one can recognize and locate present objects in a temporal sequence of images [13]. Within the framework of human crowds there is a particular interest in video surveillance where the follow-up of individuals allows checking automatically the comings and goings in a space. Just like in image recognition, a follow-up can be based on graphic properties such as colors or outlines [14, 15]. The added temporal dimension allows the possibility of a continuity of the presence and the position of the person in the scene, in spite of the occlusion. The temporal and spatial consistency of the followed characteristics can be obtained in certain cases by means of methods of clustering [16].
The proposed approaches contribute to the detection of major anomalies arising in a complex scene. They also contribute to the detection of events in the crowd by following groups instead of following every person individually which facilitates the detection of events occurring in crowds.
The approaches usually used for the analysis of crowd behavior in video sequences generally comprise four essential stages: detection of movement, segmentation, classification and tracking.
In our work we propose the use of the detection movement technique by optical flow [12-15]. The latter makes it possible to detect groups which move in the same direction and to extract the reasons for movement. The major advantage of this method is that it doesn’t need to be modeled, [4, 5], because it consists of detecting the movement by calculation in any point of the image of a mathematical quantity which is a function of the intensity or the color of the whole of the pixels and which is supposed to reflect the importance of the visible movement in the scene. Therefore we propose that the segmentation [16] be done by regrouping the areas with the aim of providing a more precise cutting of the borders of the areas. Afterwards, we propose to use a technique of classifying anomalies by a dynamic switching between the two approaches of artificial neural networks [17] for the management of anomalies in a group of people, and the DBSCAN [9] method for detecting the entities. Then we propose that the improvement of the results be obtained by adding techniques of elimination of shades and of occlusion which is due to position and the orientation of the camera and the degree of influence of the occlusion. Lastly, we propose the use of a particle filter, which is well adapted to follow disturbed trajectories with abrupt changes of movement, or a KALMAN filter [7] for the tracking.
|
|
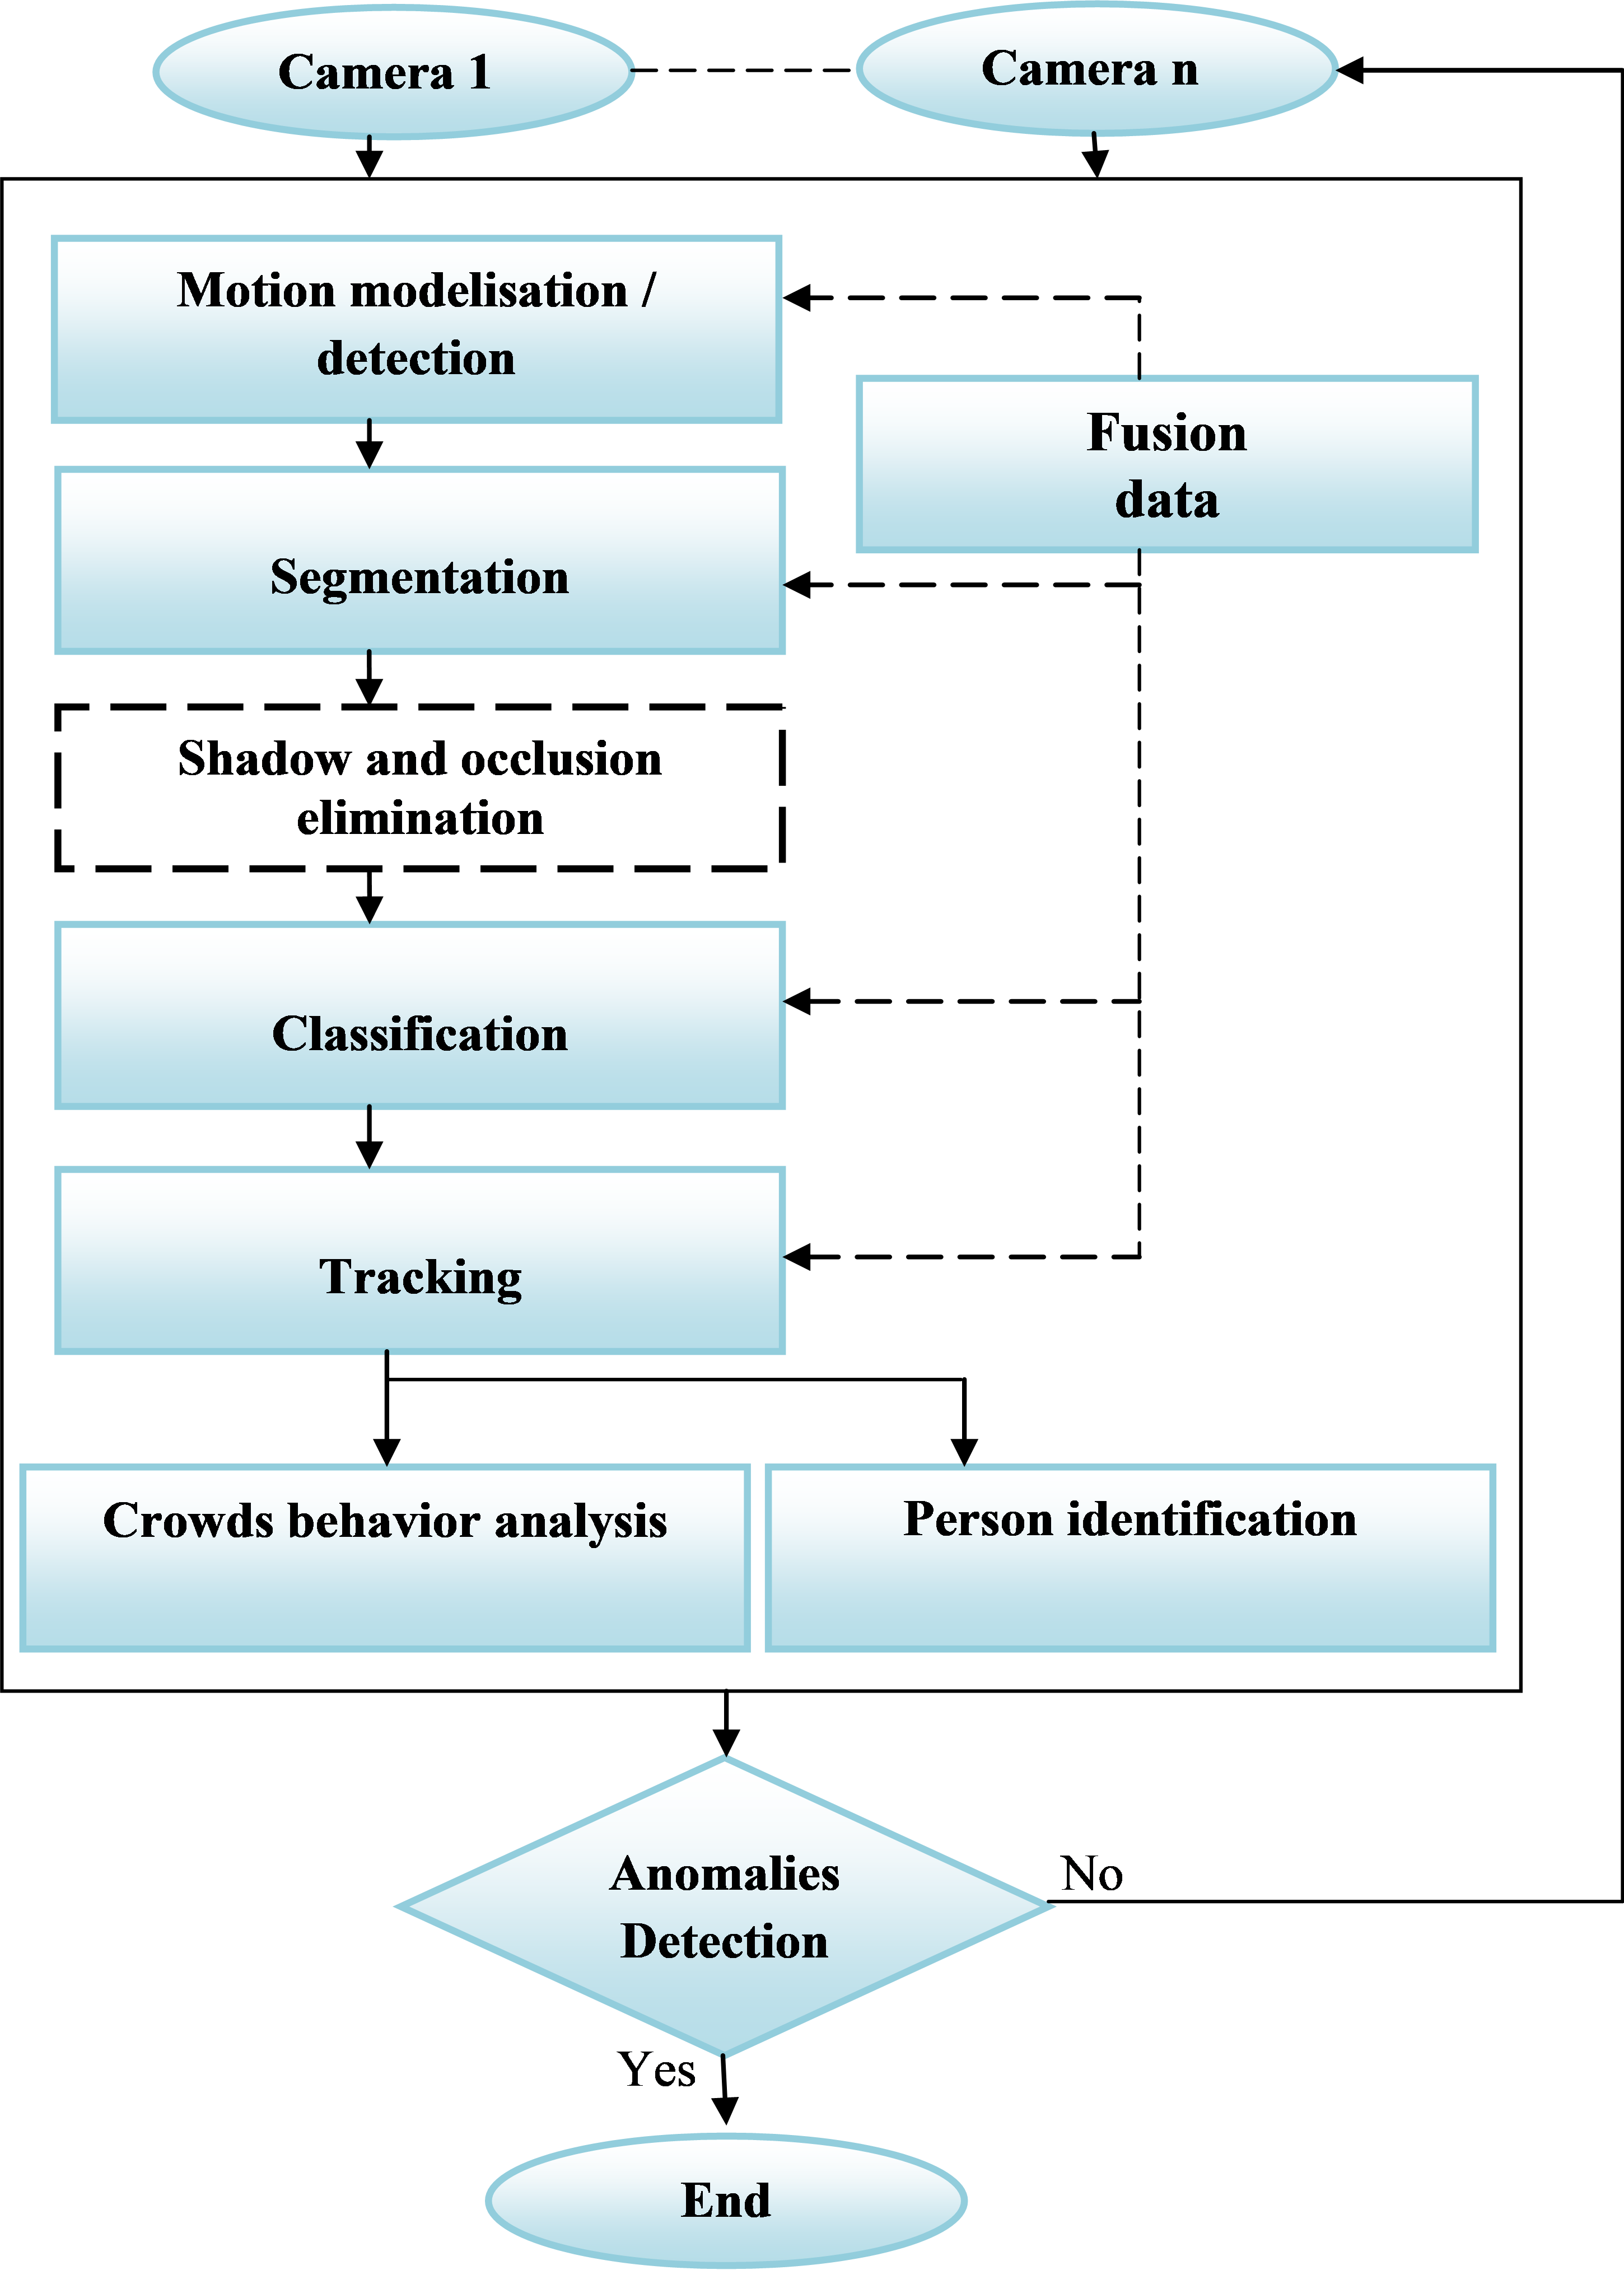
According to the state of the art, the proposed approach is illustrated in the flow chart in (Figure 2). The first stage is for acquiring the image to be treated by the means of a camera. After that, we carried out detection by the optical flow; segmentation of the movements and classification, the last of which represents the new approach for the detection of abnormalities in very dense scenes while being based on the speed of the individuals and of the group. The various anomalies are first detected to be handled automatically without training by the DBSCAN method to detect the entities. The next stage is the tracking of the abnormalities. Finally a test is carried out in order to enable us to extract some comprehensible information detecting normal and abnormal crowd behavior.
3. Mathematical formulation
The general architecture used will be detailed by the following sections:
3.1. Motion vector extraction
The investigated crowd activities are characterized by the movement of people. The examination of motion dynamics of crowds is based on the so called motion vectors obtained by the method of optical flow which is applied to each pair of subsequent video frames.
Applying optical flow returns a set of motion vectors in the form:![]()
Where is the motion vector at frame , represented by the feature point at the coordinate , the magnitude and the orientation angle .
3.2. Elimination of shade
The stage of the shades removal was achieved by a simple passage of colorimetric space RGB towards space HSV “for Hue / Saturation / Value”, while eliminating the component brightness V. This space highlights the chromatic properties due to its components H, S and V.
The chromaticity of pixel could be obtained by color normalization. For example the red channel: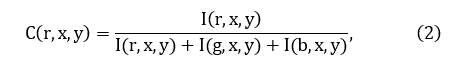
where are respectively the intensities of the channels red, green and blue.
It is the same for the two other channels green and blue. The chromaticity of a pixel is then![]()
The difference in chromaticity ΔC, between the current chromaticity of the pixel and its chromaticity in the model of the background makes it possible to measure the Mahalanobis distance represented as follows:![]()
Where the chromaticity covariance matrix of the pixel Then, for each new image and each pixel, the Mahalanobis distance is calculated.
3.3. Management occlusion
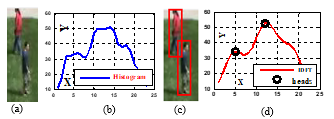
The position and orientation of a camera influences the degree of occlusion. If the camera’s optical axis is horizontal, then occlusion will occur in the segment parallel to the horizontal axis of the image plane. Occluded blobs will be indistinguishable due to overlap in depth. We developed a hybrid segmentation methodology to split occluded blobs using a histogram-based approach for horizontal occlusion and an ellipse-based approach for vertical occlusion (Figure 3).
|
|
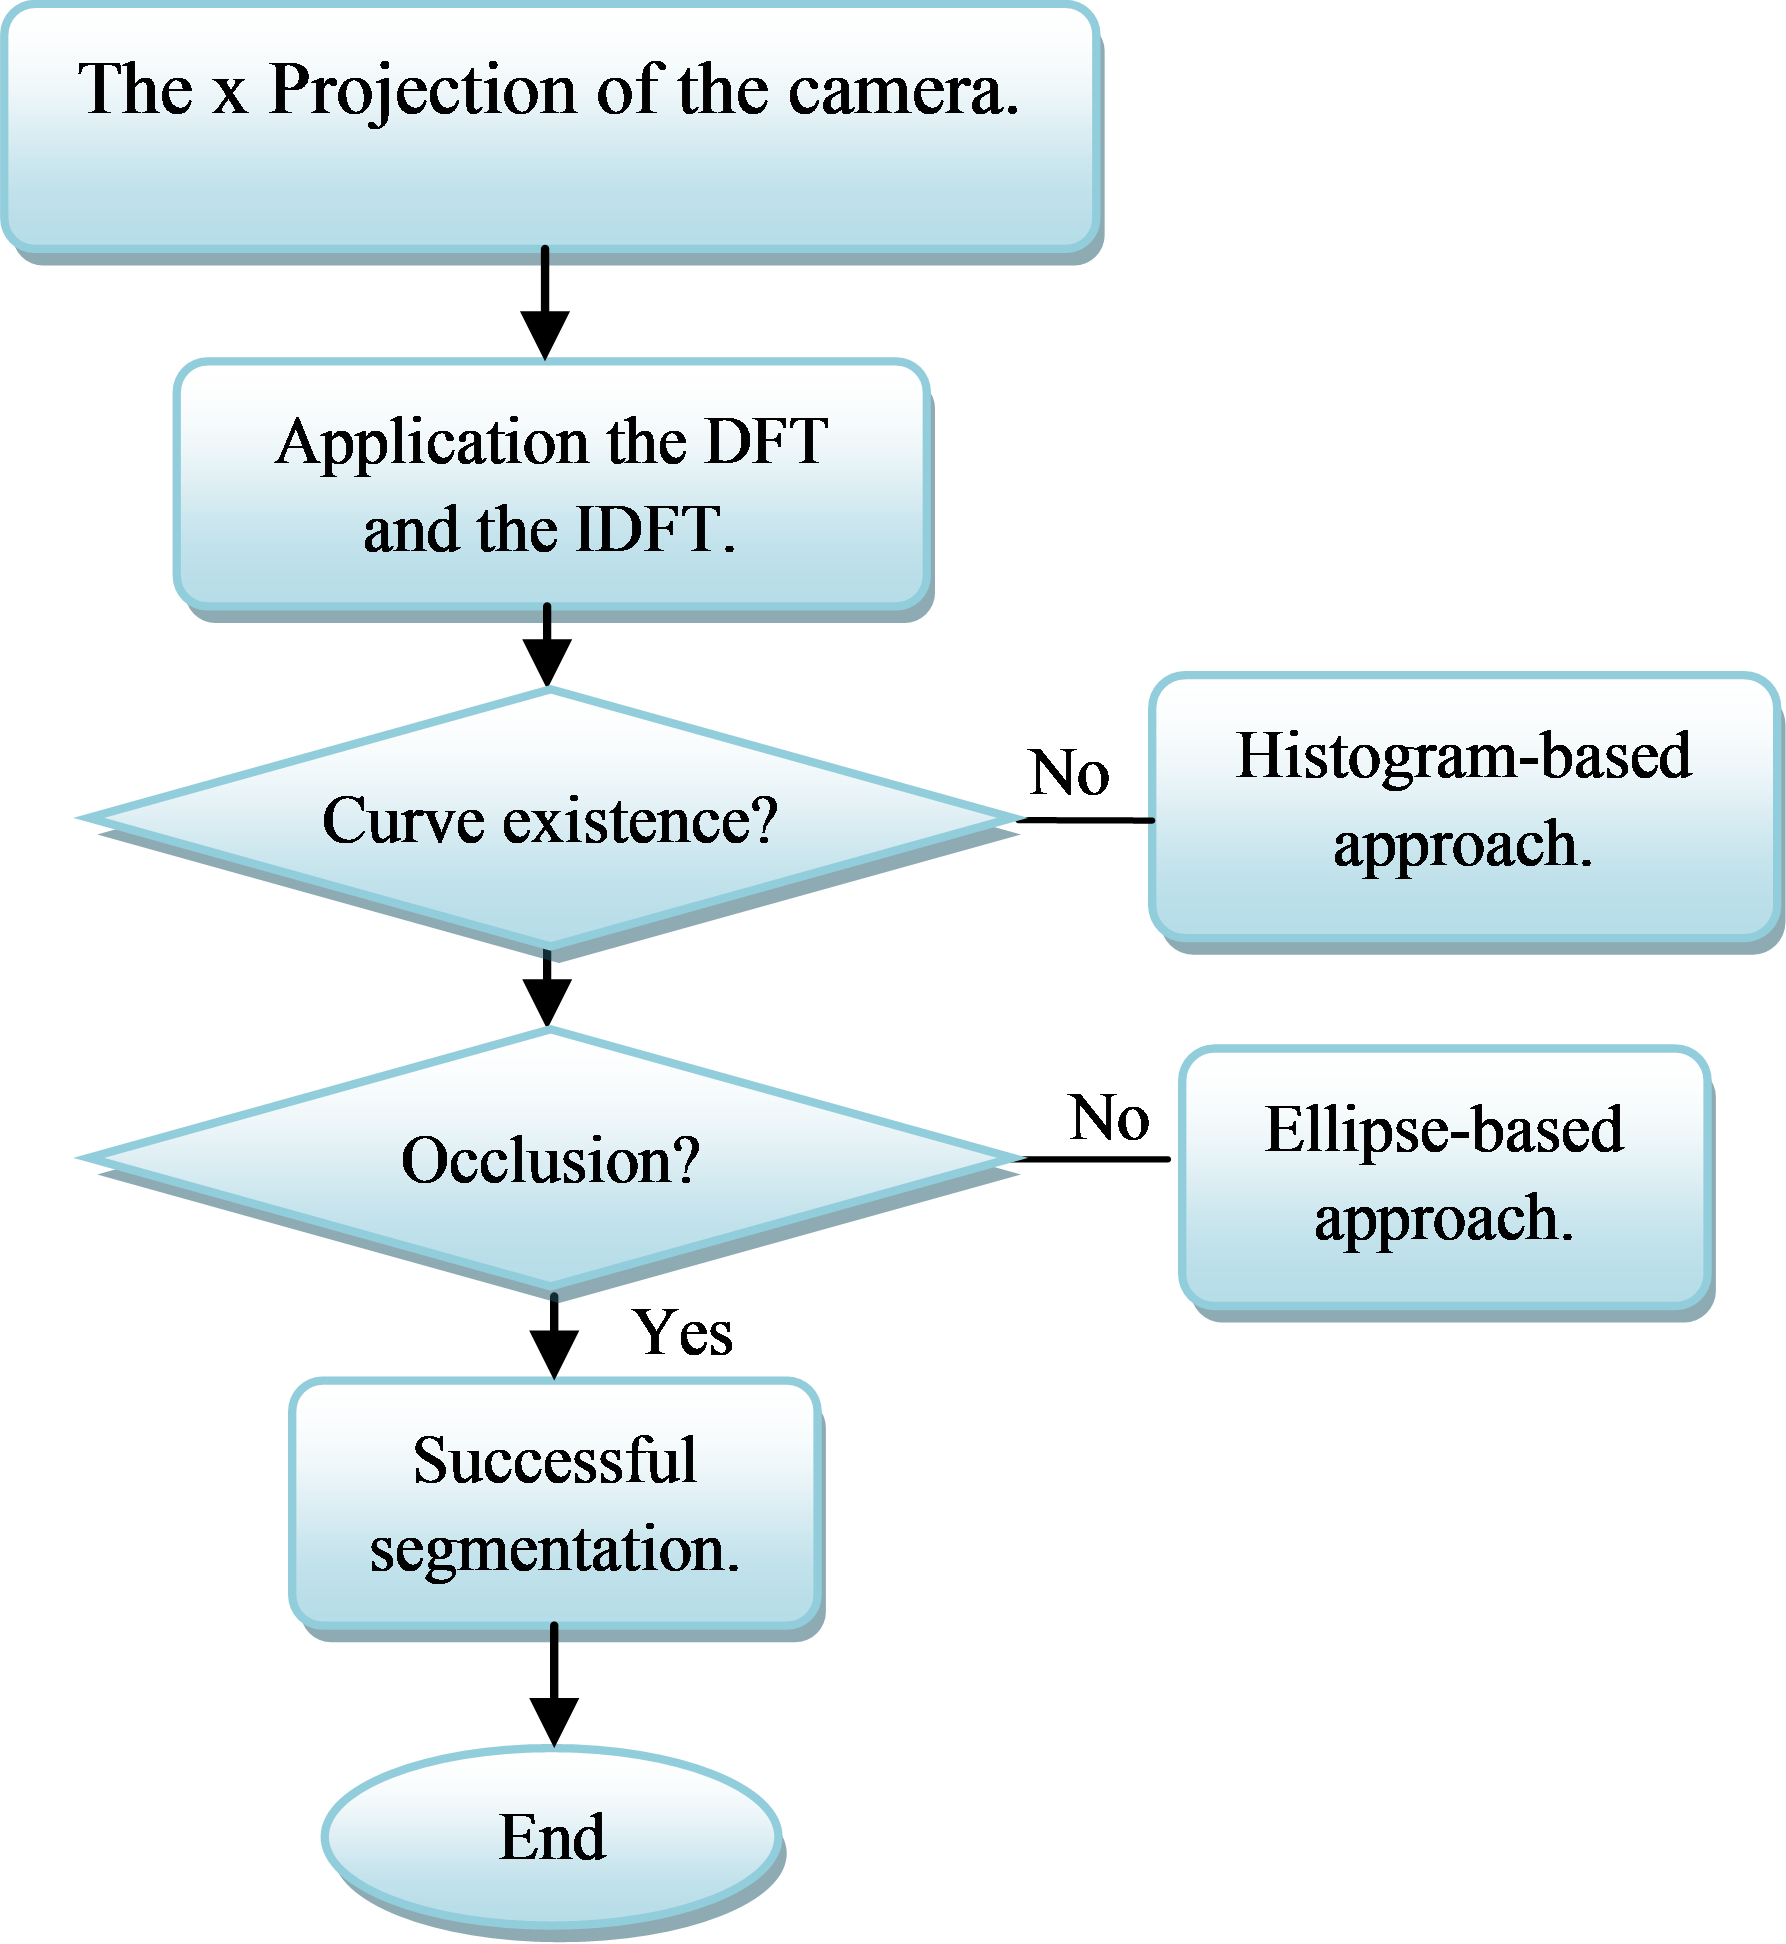
Blobs, which become slightly occluded at the same depth such as these, usually have special shape-based features. When projected vertically onto a horizontal line the blobs change into the shapes shown. The curve is similar to a signal in the time domain where the horizontal line is the time axis, and thus discrete Fourier transformation “DFT” can be employed to transform the line into a frequency domain. Thereafter, the lowest frequency components are retained and the rest are set to zero by a filter. Using inverse discrete Fourier transformation “IDFT” they are then transformed back into the time domain. This process smoothes the original curve and benefits the following segmentation. On the smooth curve, the significant peaks are usually located at the horizontal position of the head, whereas the significant valleys are usually located at the effective cut points for segmenting the occlusion.
3.4. Motion vectors clustering
Among the many algorithms proposed in data mining field, DBSCAN is one of the most popular algorithms due to its high quantity of noiseless output clusters. It discovers clusters with arbitrary shape with minimal number of input parameters.
The input parameters are the radius of the cluster “Eps” and minimum points required inside the cluster “Minpts”. Complete algorithm of DBSCAN is given by [18].
In order to determine the membership of each element to a cluster and make decisions we need a measure function. Minkowski distance is widely used: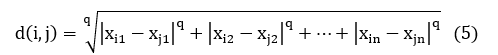
Many variants are used, mostly with q=1 or q=2. In our case, we have used q=2, which represents the Euclidean distance. From the latter distance, we have derived the next equation. Using a simple difference between the position coordinates, and the magnitudes: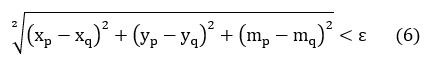
Where: and are the coordinates of the point’s p and q; ” ” and ” ” are magnitudes of the motion vectors at the point’s p and q;
As using DBSCAN by one of these three distance measurements, we can cluster motion vectors into diverse groups of data points which have similar coordinates, similar magnitudes and similar orientation. Each group of motion vectors represents a motion pattern.
3.5. Motion vectors clustering
The neuronal network is used to classify the crowd behavior. Classification is made for each sequence of images in order to detect the various behaviors of a group of people. The classifier is based on a set of neurons which contain three layers. Each type of behavior is individually detected by a network. The structure of each network is defined so that the number of neurons in the input layer is equal to the number of input parameters, and the number of neurons in the hidden layer can be experimentally determined. In this work, two classes of behavior are considered, the normal and abnormal classes, each type of behavior is represented by a neuron in the output layer. Neurons in the hidden layer are represented by a sigmoid function. The model is represented by the following equation: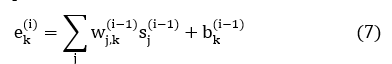
In output, we have which is related to the applied activation in the network. The value is a skew added to the entry of the kth neuron. The function of error, which represents the Euclidean distance between the output of the network and the target, is given as follows: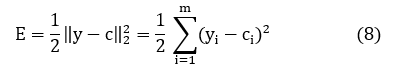
It is now necessary to minimize the average of the errors given by the function E on the whole of the data provided in input , Where N is the number of couples given and represents the t-th error of training.
3.6. Detection of events
In this section, we describe the detection of anomalies in a dense scene. The selected scenarios belong to the events described in the video [19, 20].
Run and walk behavior: The principal idea consists of calculating the average magnitude of the movement vectors in each image. A high magnitude means the event runs, while low magnitude means the event goes.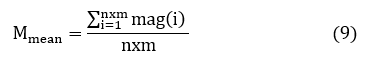
With and numbers it points to movement in the image, and is the magnitude of each point of movement.
Where and are the real and imaginary components of the movement vector.
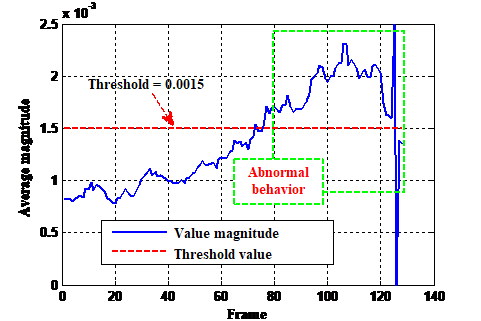
We considered that the characteristic of the state of a collapse situation is a signal of sudden change with a high peak height of duration. If there is such a signal then there is an abnormal event. The decision for normal or abnormal events is to be taken by comparing the calculated and normalized measure with a specific threshold defined by:![]()
|
|
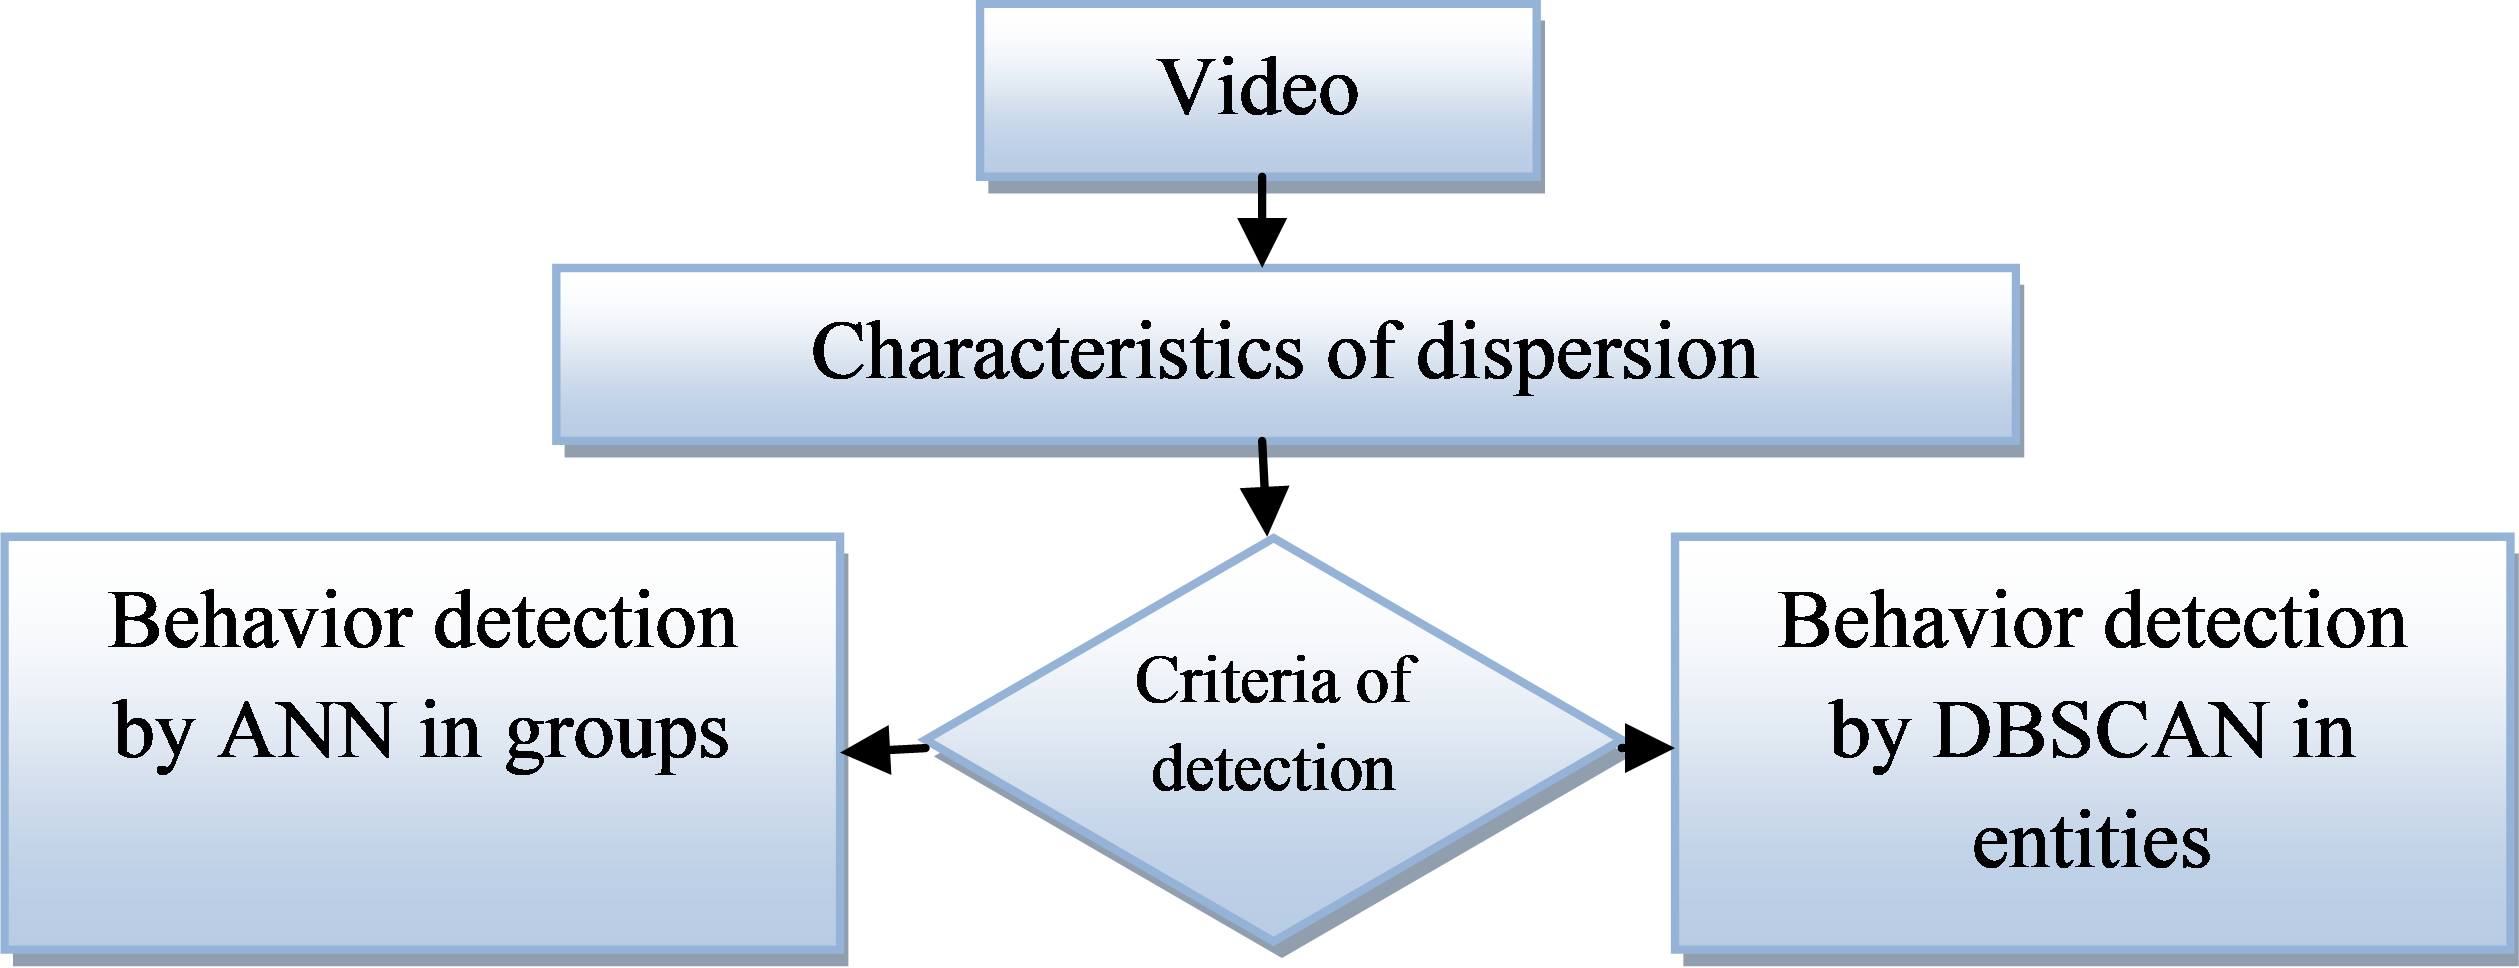
The strategy of detection in (Figure 4) represents the unusual way of detecting crowd behavior by two approaches (DBSCAN and ANN). This dynamic strategy is always in the case of entity and group of people. The results of simulation of this new approach will be presented in the following section.
|
|
4. Results
In this section, the proposed method of detection by switching in a dynamic way between two approaches, the artificial neurons networks (ANN) for the management of group anomalies of people, and the Density Based Spatial Clustering of Application with Noise (DBSCAN) in the case of entities. The videos are mainly collected from the UMN dataset [19]. The BEHAVE video dataset and the PETS2009 dataset [20] for performance evaluation are adopted in anomalous frame behavior detection experiments.
The proposed approach is based on computing the magnitude of the motion vector which presents the optical flow in the Cartesian frame. The point is the position of its interests point at time , where is the position of the same point at time , we use the Euclidean distance.
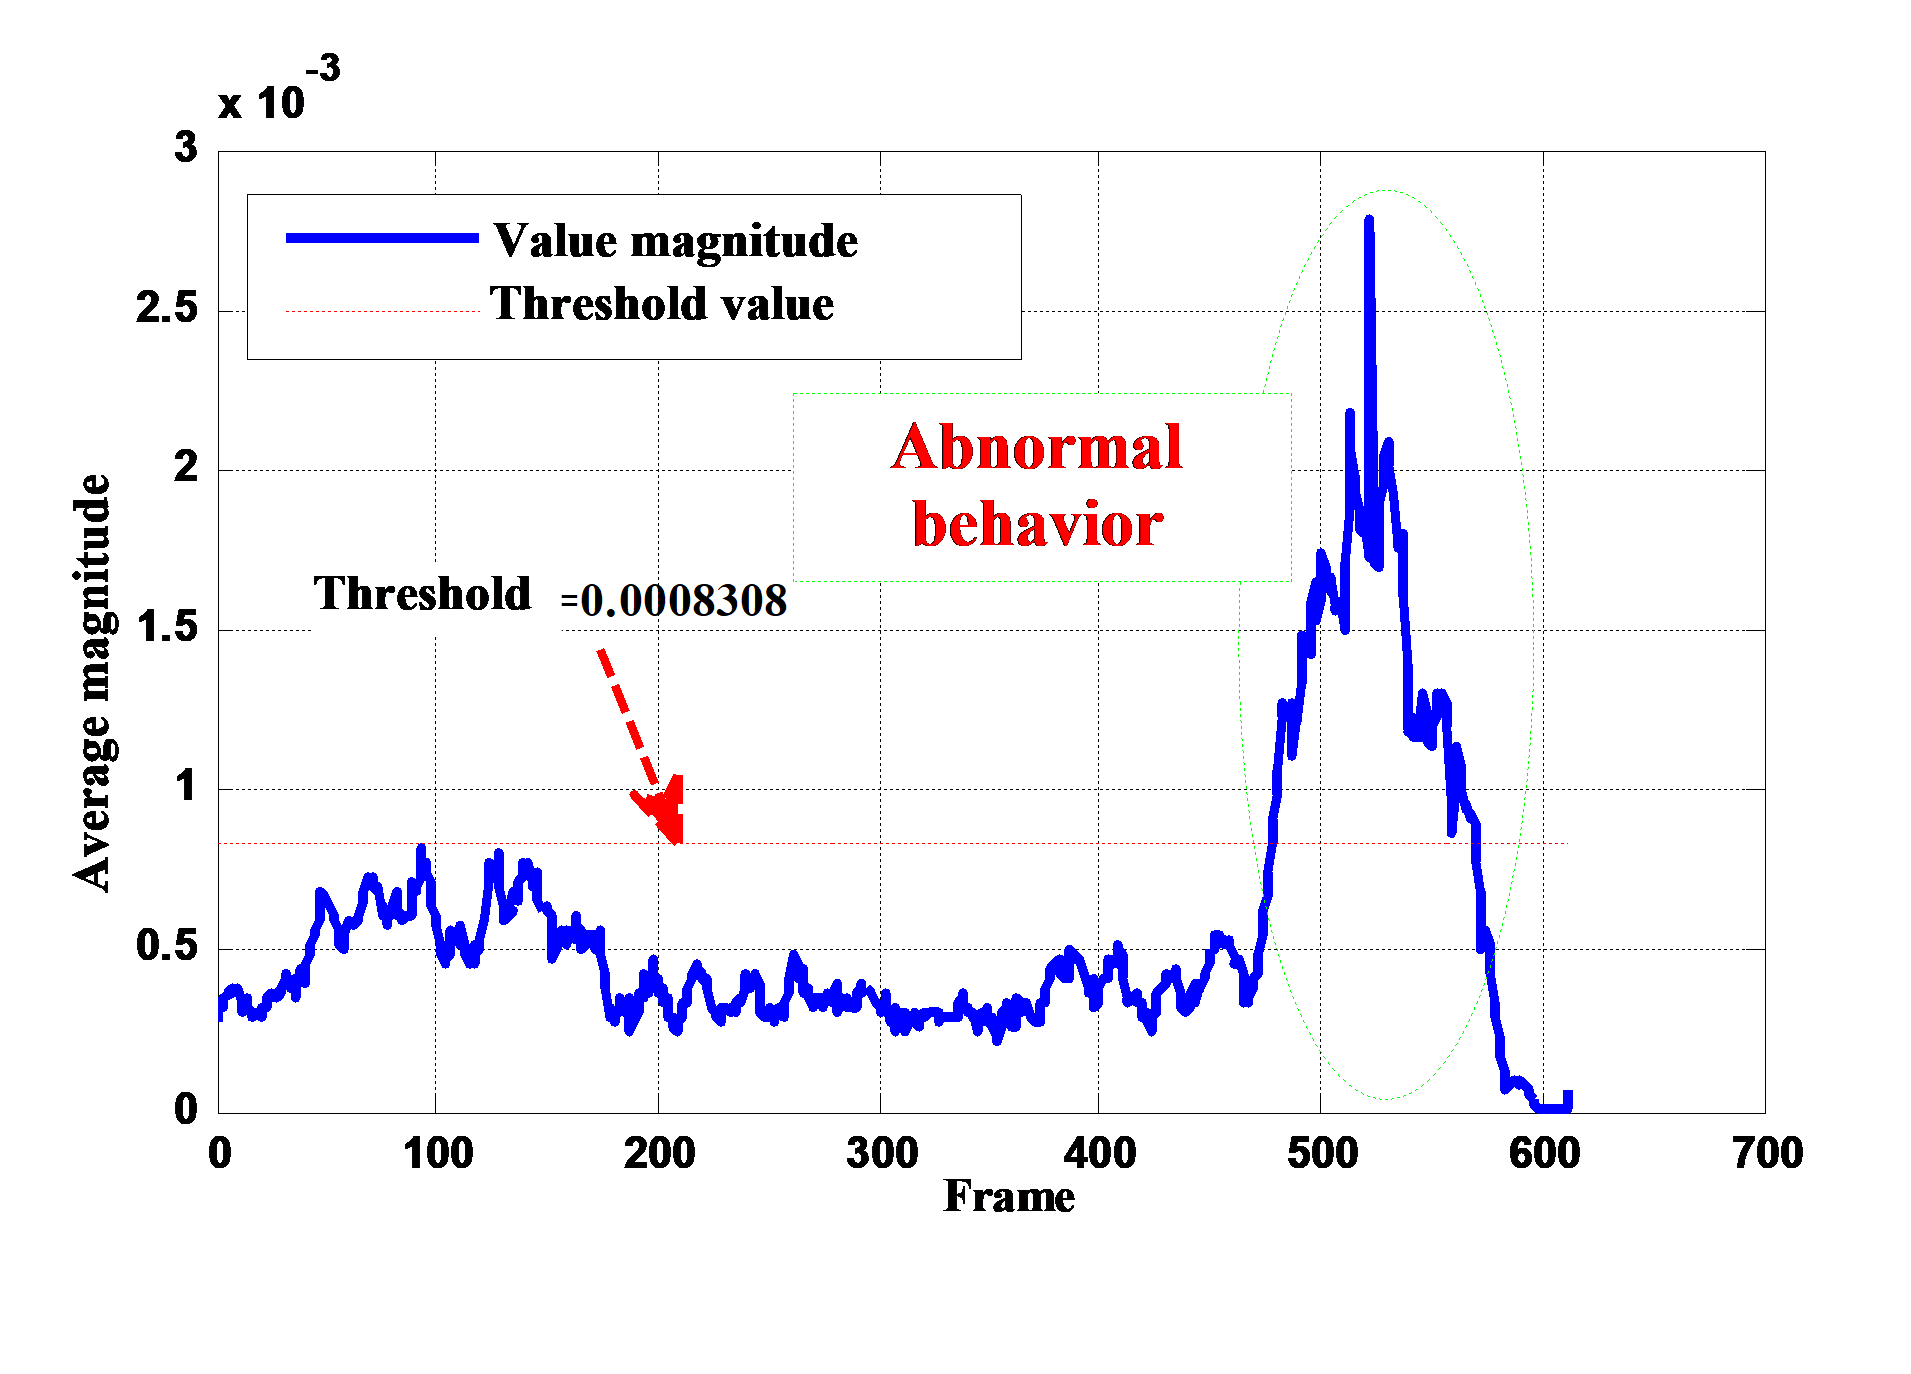
We calculate the average magnitude of each sequence of images with an aim to determine the running and walking events (Figure 5). These events can be identified by using the magnitude of the vectors of optical flow. Therefore the principal idea consists of calculating the average magnitude of the movement vectors in each image. A high magnitude indicates a running event while low magnitude indicates a walking one. The detection is performed using DBSCAN in the case of entities, and ANN for the management of people in a group, the classifiers based on the average speed as criteria. The results of the approach suggested are represented in (Figure 6) and (Figure 7).
|
|
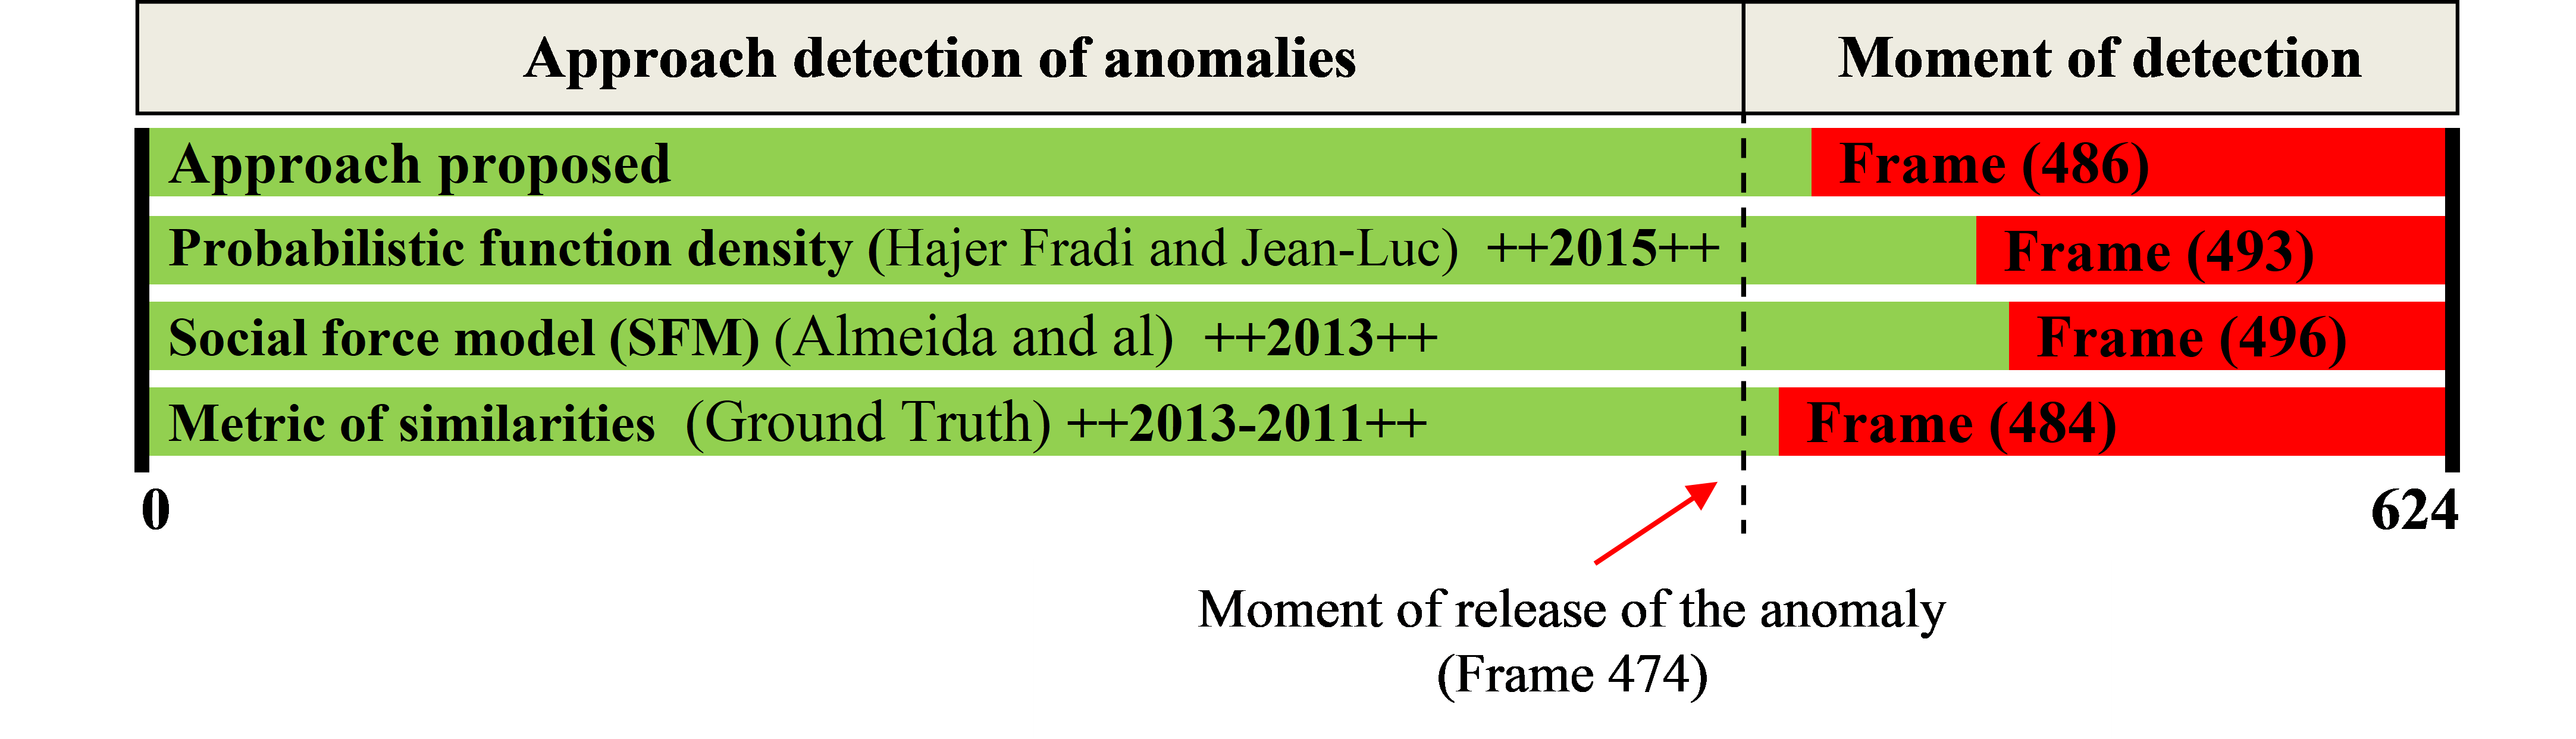
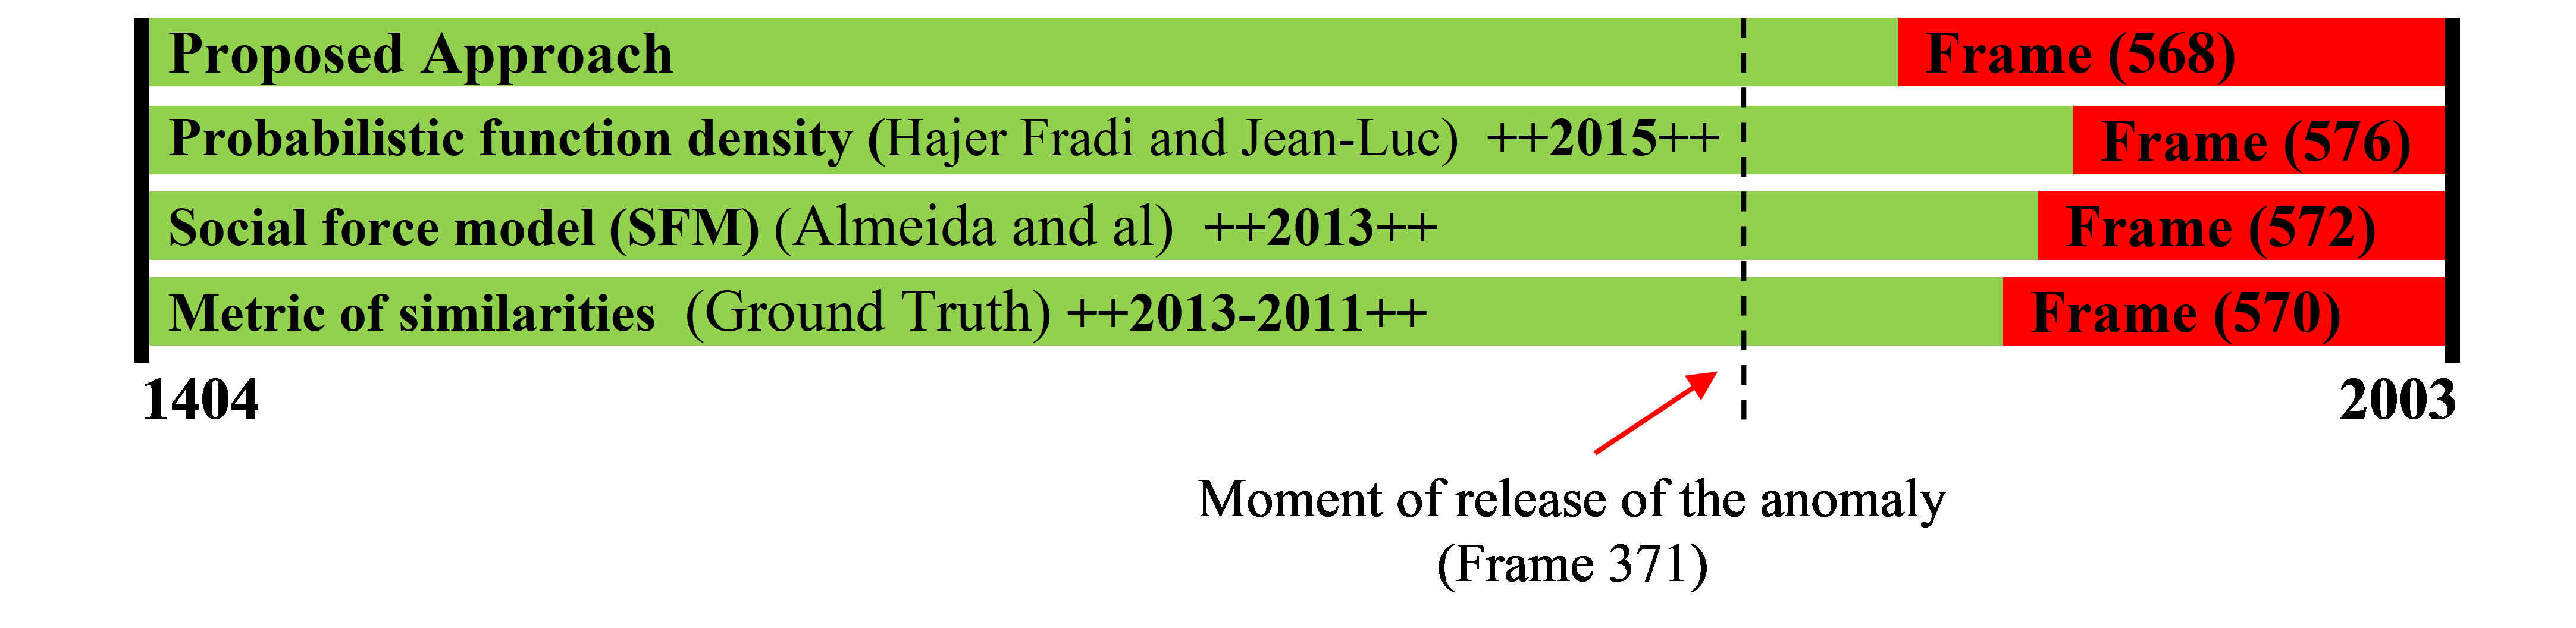
In our work, we suppose that the number of people in an occulted group is not limited. Moreover, we compare our results with other methods (Figure 8), such as the function of probabilistic density [21] and [22], the social force model (SFM) [23], and the metric ones of similarities based on the speed and the orientation of decoupling 2D of histograms [24] and [23]. The obtained results are encouraging when the automatic detection of anomalies is close to the real time measurement. The approach suggested shows a great robustness against false alarm detection since the automatic detection of anomaly occurs after the real release of the anomaly.
These results prove that our method gives the satisfactory results comparable to ones concerning the other three methods (Figure 8).
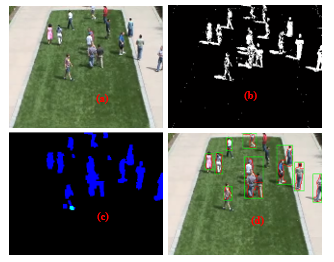
In (Figure 9) and (Figure 10) is present some results that illustrate the case of occlusion management and elimination of shades. Our approach has some advantages as it presents a positive contribution for the detection of the movement in a complex environment. However it requires the estimation of temporal time for each sequence of image and at every moment of the video sequence which makes it very greedy in computing power consumption. Moreover the optical flow occupies only about 84 % of movement surface detection in opposition to the advection of particles of social forces model which is used to locate a large surface (more than 96 %). Our approach reached a flow of 4 images per second on an INTEL Pentium 2.16 GHz processor (which can be seen as a weak processor) simulated under MATLAB “R2014a”.
|
|
|
|
|
|
|
|
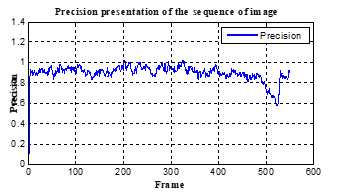
We have some illustrative results in (Figure 11) expressing the case of elimination of shade. We note that our described approach favors as it presents a positive contribution for the detection of the reasons for movement in a complex environment. The results of (Figure 11) show that our system has a good robustness with a precision of more than 0.75.
|
|
To clarify other advantages of the algorithm we simulated the video according to:
The blue colored curve below (Figure 12) presents the output of the algorithm proposed previously. Different sequences from the image in the normal and abnormal situations were differentiated by a label from one or zero respectively, according to classification by neural networks.
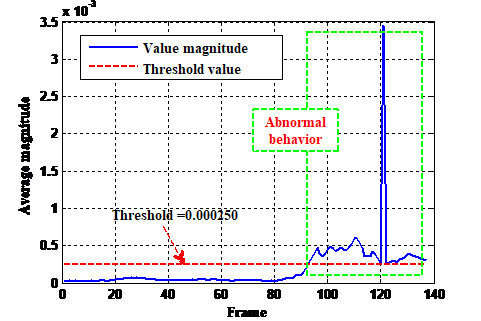
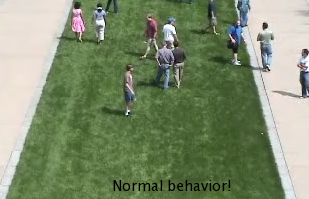
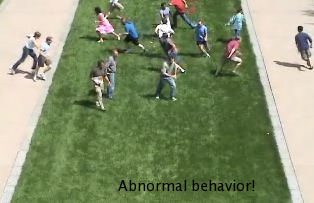
To show the effectiveness of the method ran a simulation using the data from [20] which showed satisfactory results in another behavior situation i.e. in the case of the presence of a vehicle, unusual crossing of a road at a faster pace (Figure 13).
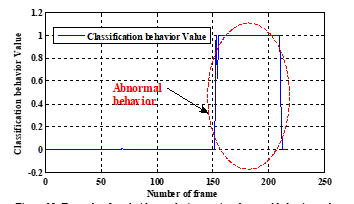 Figure 12: Example of total video analysis contains abnormal behavior and classification by neural networks
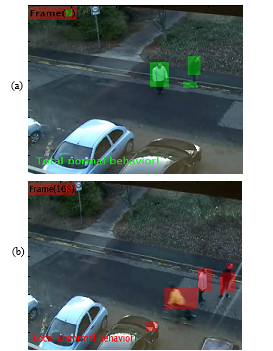 Figure 13: Detection of behavior by NNA in data [20], (a) normal behavior, (b) abnormal behavior.
|
||||||||||||||||||||||||||||||
For the identification of events of crowd evaluation, we examine the calculation of the performances of the strategy and we obtain these following results:
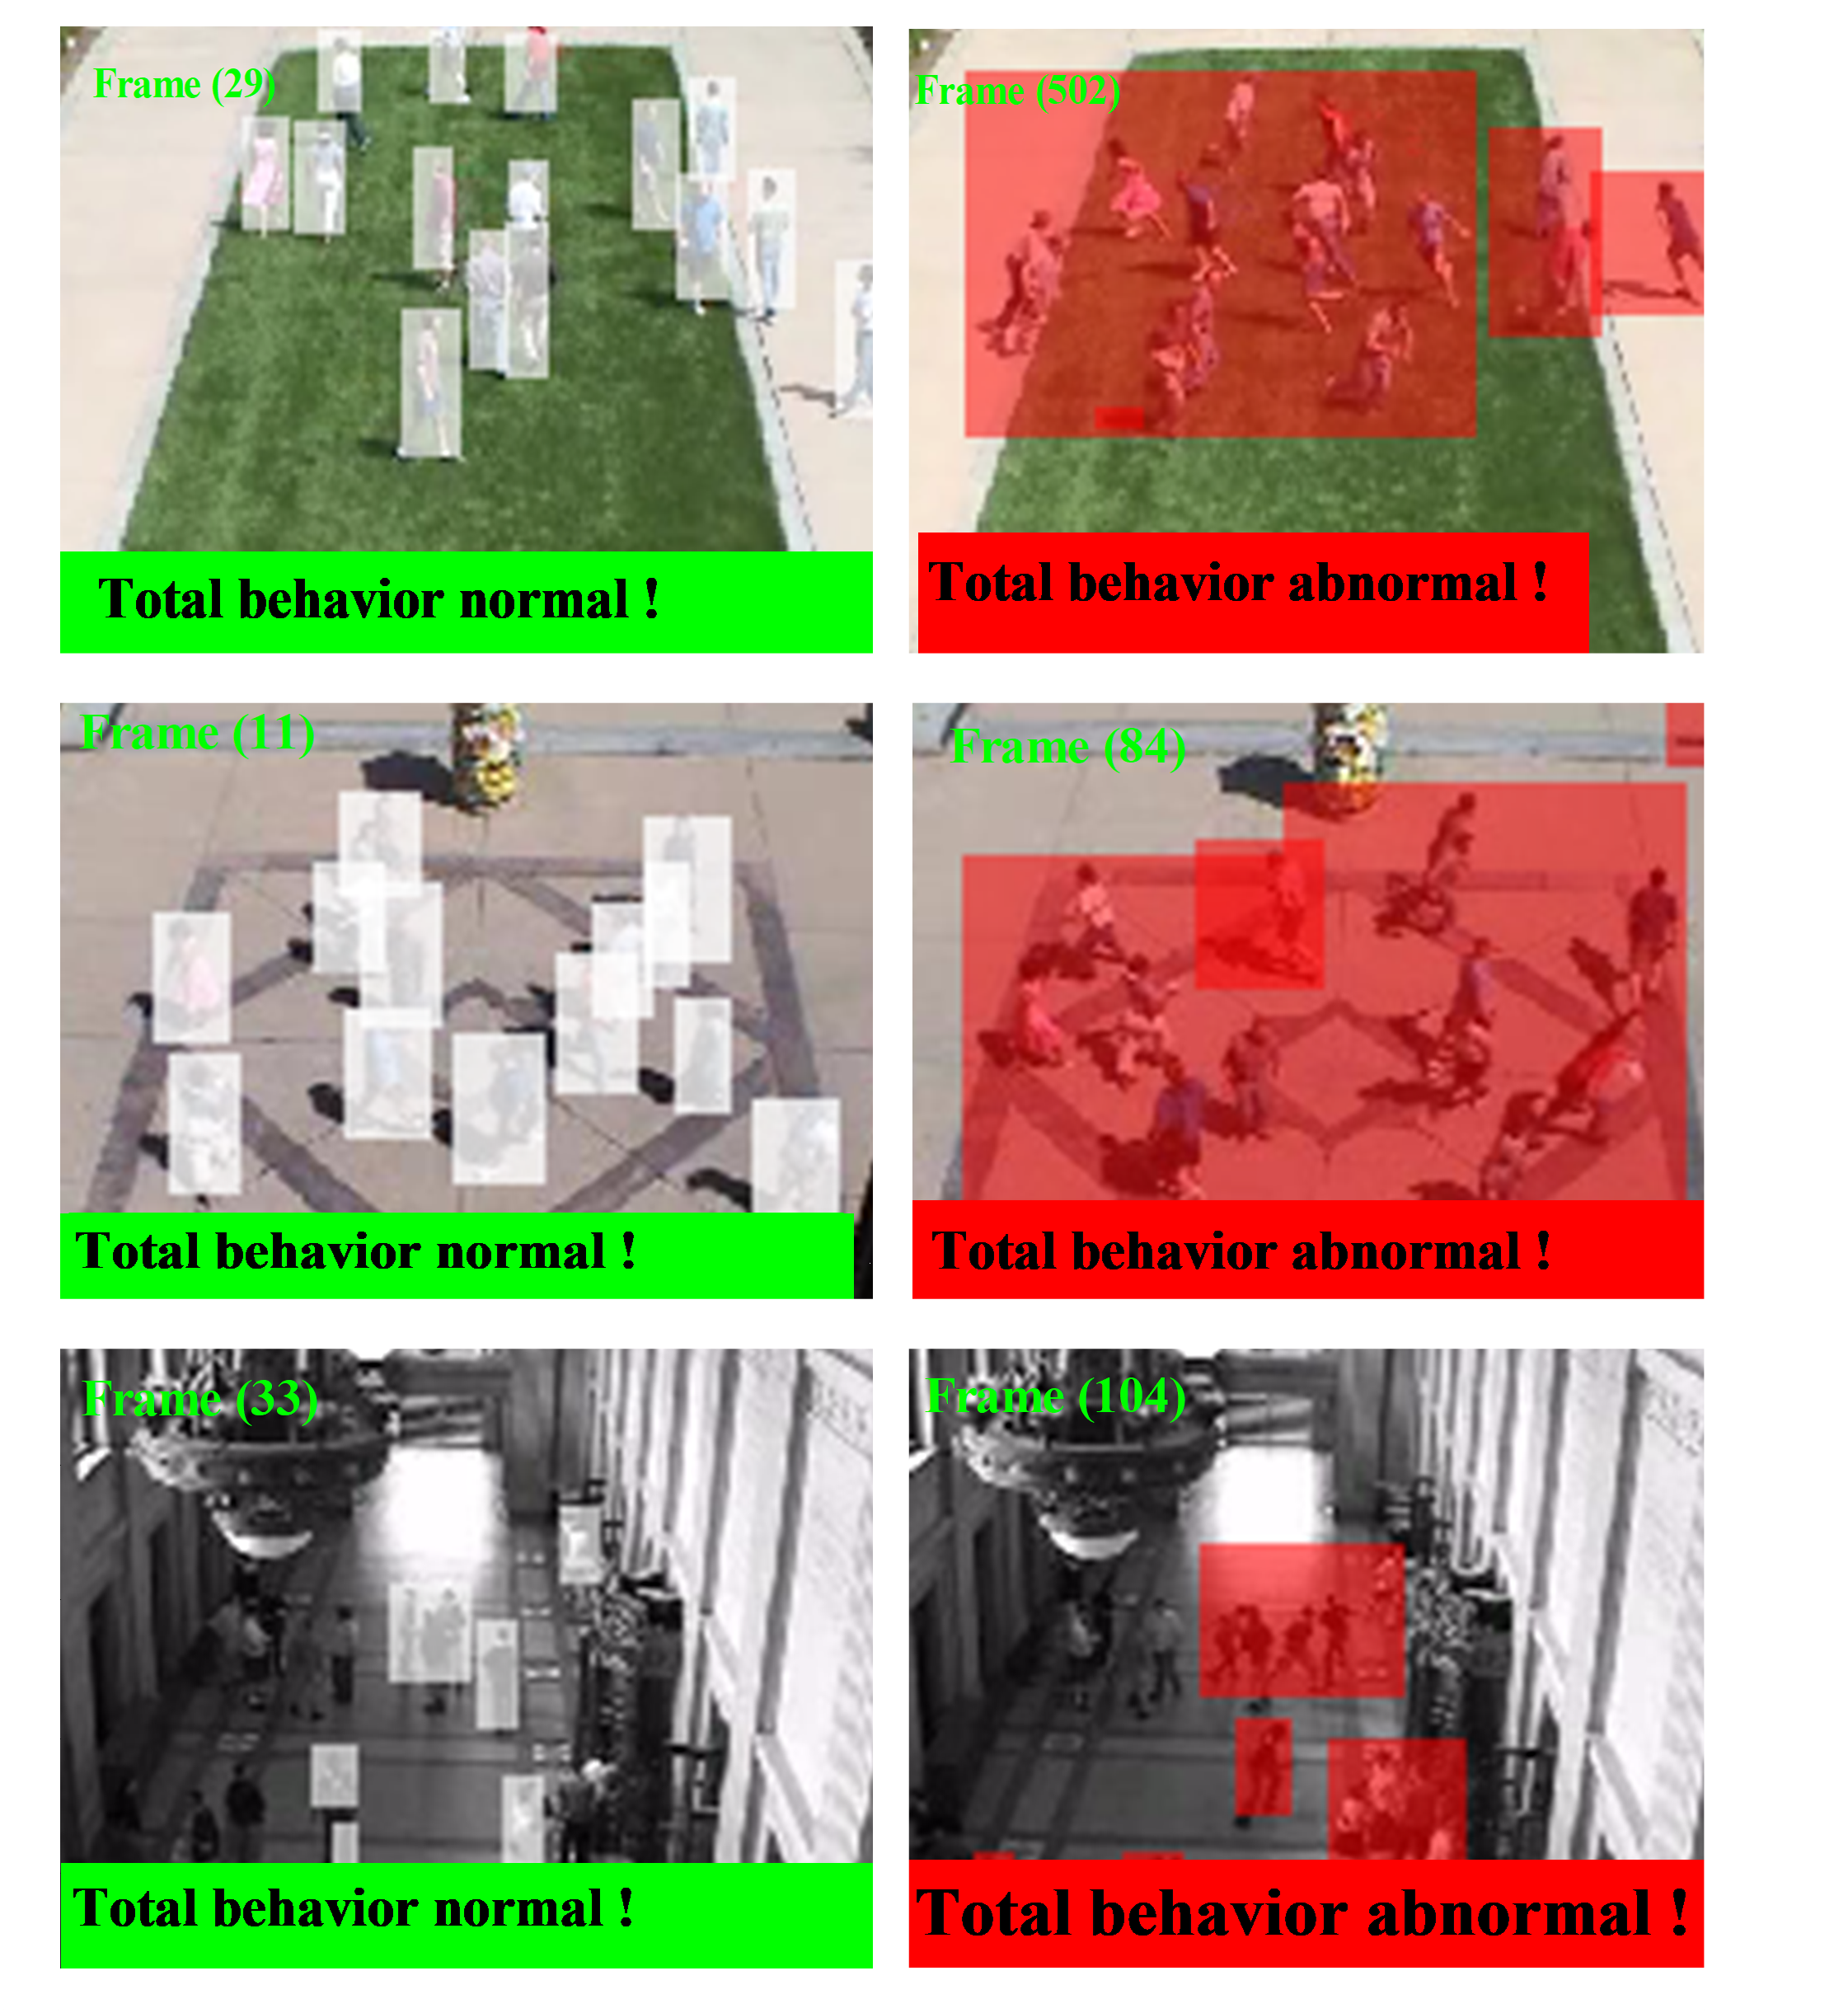
The results of our experiments show that with time the execution by contribution with the number of points of DBSCAN is close to the quadratic equation as seen in Table 1, and the numbers of the points on top is almost linear as seen in (Figure 14). The Figure 14 illustrates the efficiency of DBSCAN. Figure 15 is the following different watch examples of the images with behavior abnormal.
We noticed that the adopted algorithm manages to detect an abnormal behavior when it appears. This algorithm functions in the majority of cases. Nevertheless, in certain cases it shows its imperfections. It is judged sufficiently effective to supervise the behavior of crowds where there is movement of the crowd in a linear direction like the example of a population crossing the road.
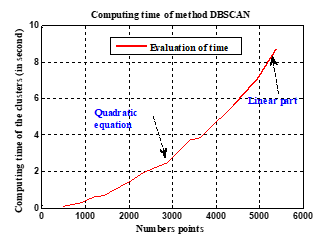 Figure 14: Results of computing time by the DBSCAN method.
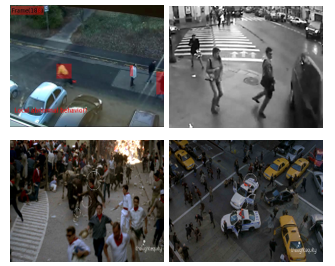 Figure 15: Another examples of the images with behavior abnormal.
5. Conclusion
In this article, we described a new method based on dynamics of the detection of abnormal crowd behavior. We are interested in the analysis of crowd behavior and its entities in a dense scene. The approach is composed of two components: the calculation of the dispersion parameters and the behavior classification. The various anomalies are detected while dynamically switching between two approaches: artificial neural networks (ANN) for the detection of anomalies of a group of people, and the Density Based Spatial Clustering of Application with Noise (DBSCAN) in the entities case. In order to examine the effectiveness of the detection algorithm proposed, several synthetic and public scenes are employed. In conclusion, the experiments prove that the algorithm proposed in detection was examined on several scenes depending on the successful detection of abnormal behaviors.
The method suggested is applied to detect the abnormal crowd behavior to imply the dynamics of detection. Behaviors of escape from the crowd in the low ones or average crowd scenes density can be identified remarkably, but the results in the scene with high crowd density can be insufficient. The method suggested can be estimated exactly only for the strongly distinguishable areas. And one of the main problems of the method suggested is an execution in weak real time. As an element of future work the authors’ aim is to study the factors affecting the speed of the algorithm and improve the execution of the algorithm in real time and its exactitude.
Acknowledgment
I express my sincere gratitude to Pr ACHELI DALILA for giving me the opportunity to take part in his team, and I also thank all the people who encouraged me finish this work.
- Chebi, D. Acheli, “Dynamic detection of anomalies in crowd’s behavior analysis”, International Conference on (ICEE’2015), Algeria, (2015).
- Zhang; L. Qin; R. Ji; S. Zhao; Q. Huang; J. Luo, “Exploring Coherent Motion Patterns via Structured Trajectory Learning for Crowd Mood Modeling,” in IEEE Transactions on Circuits and Systems for Video Technology , PP(99): 1-1.
- Zhou, H. Dong, D. Wen, X. Yao and X. Sun, “Modeling of Crowd Evacuation With Assailants via a Fuzzy Logic Approach,” in IEEE Transactions on Intelligent Transportation Systems, 17(9): 2395-2407 (2016).
- Yi, H. Li and X. Wang, “Pedestrian Behavior Modeling From Stationary Crowds With Applications to Intelligent Surveillance,” in IEEE Transactions on Image Processing, 25(9): 4354-4368 (2016).
- Wang, Z. Miao, “Anomaly detection in crowd scene,”2010 IEEE 10th International Conference on Signal Processing (ICSP), 1220-1223 (2010).
- S. Pathan, A. Al-Hamadi, B. Michaelis, “Crowd behavior detection by statistical modeling of motion patterns,” 2010 International Conference ofSoft Computing and Pattern Recognition (SoCPaR), 81,86 (2010).
- Ko, “A survey on behavior analysis in video surveillance for homeland security applications,”37th IEEE Applied Imagery Pattern Recognition Workshop, 2008. 1-8 (2008).
- Szczodrak, J. Kotus, K. Kopaczewski, K. Lopatka, A. Czyzewski, H. Krawczyk, “Behavior Analysis and Dynamic Crowd Management in Video Surveillance System”, 2011 22nd International Workshop on Database and Expert Systems Applications (DEXA), 371-375 (2011).
- El Maadi, M.S. Djouadi, “Suspicious motion patterns detection and tracking in crowded scenes,”2013 IEEE International Symposium on Safety, Security, and Rescue Robotics (SSRR), 1-6 (2013).
- Li, G. Wang, “A shadow detection method based on improved Gaussian Mixture Model”, 2013 IEEE 4th International Conference on Electronics Information and Emergency Communication (ICEIEC), 62-65 (2013).
- Qian, X. Wu, Y. Ou; Y. Xu, “Hybrid algorithm for segmentation and tracking in surveillance”,IEEE International Conference on Robotics and Biomimetics, 395-400 (2009).
- Shi, C. Tomasi, “Good features to track”, Computer Vision and Pattern Recognition, 1994. 1994 IEEE Computer Society Conference on Proceedings CVPR ’94., 593,600 (1994)
- Atcheson, W. Heidrich, I. Ihrke, “An evaluation of optical flow algorithms for background oriented schlieren imaging” Experiments in Fluids, vol. 46, pp. 467-476, 2009.
- Burt, E. Adelson, “The Laplacian Pyramid as a Compact Image Code,” IEEE Transactions on Communications, 31(4): 532, 540 (1983).
- K. Horn, B.G. Schunck. “Determining optical flow.” 1981 Technical Symposium East. International Society for Optics and Photonics, (1981).
- Demonceaux, “Etude du mouvement dans les séquences d’images par analyse d’ondelettes et modélisation markovienne hiérarchique. Application à la détection d’obstacles dans un milieu routier”. Diss. Université de Picardie Jules Verne, (2004).
- A. ROWLEY, S. BALUJA, “Takeo KANADE: Neural network-based face detection”. IEEE Transactions on Pattern Analysis and Machine Intelligence (TPAMI), 20:23–38 (1996).
- Parimala, D. Lopez, N.C. Senthilkumar: “A Survey on Density Based Clustering Algorithms for Mining Large Spatial Databases”, International Journal of Advanced Science and Technology, 31: (2011).
- UMN, Minneapolis, MN, USA. (2006). Unusual Crowd Activity Dataset of University of Minnesota. [Online]. Available: http:// mha.cs.umn.edu/movies/crowd-activity-all.avi.
- J. Blunsden, R. B. Fisher, “The BEHAVE video dataset: ground truthed video for multi-person behavior classification”, Annals of the BMVA, Vol 4:1-12 (2010), http://groups.inf.ed.ac.uk/vision/BEHAVEDATA/INTERA CTIONS/.
- Fradi, J. L. Dugelay, “Towards crowd density-aware video surveillance applications”, Contents lists available at ScienceDirect, Information Fusion 24: 3–15 (2015).
- MEHRAN, A. OYAMA, M. SHAH. “Abnormal crowd behavior detection using social force model”. In IEEE Conference of Computer Vision and Pattern Recognition, 935-942 (2009).
- R. DE ALMEIDA, C.R. JUNG. “Change detection in human crowds”. In 2013 26th SIBGRAPI-Conference on Graphics, Patterns and Images (SIBGRAPI), 63-69 (2013).
- Y. CHEN, P.C. HUANG, “Motion-based unusual event detection in human crowds”. Journal of Visual Communication and Image Representation, 22(2): 178-186 (2011).