FenceBook a Geofencing based Advertisements Application Using Android
FenceBook a Geofencing based Advertisements Application Using Android
Volume 1, Issue 5, Page No 27-33, 2016
Author’s Name: Owais Qayuma), Tahreem Sohail
View Affiliations
Electronics Engineering Department, University of Engineering and Technology, Peshawar, 25000, Pakistan
a)Author to whom correspondence should be addressed. E-mail: Qayum.insaane@gmail.com
Adv. Sci. Technol. Eng. Syst. J. 1(5), 27-33 (2016); ![]() DOI: 10.25046/aj010506
DOI: 10.25046/aj010506
Keywords: Geofencing, Location Based Systems, Geotargeting, Geo Location, Geofence, Customer Recognition, Online advertising

Export Citations
Geo-fencing (geofencing) is a great feature in a software program that uses Global Positioning System (GPS) or radio frequency identification (RFID) to define the geographical boundaries feature. Actually geofence is a virtual barrier. Geofencing is an innovative technology, an online marketplace for proactive contextual services that allows users to easily find interesting services, can easily subscribe to it and to allow providers offer their services for a variety of applications such as electronic toll collection, contextual advertising or tourist information systems, even without additional infrastructure. The main objective of this research was to understand how the use of spatial data can improve advertising performance for customers. Tracking systems and monitoring, based on global navigation services by satellite, and include geofencing function, could also contribute to the exact location of an institution or company and increase sales and business perspective efficiently. Instead of large billboards they can now advertise on smartphones which is economically and accurately tested. Therefore, we have developed a concept for a market that offers geofence, which can be applied by all and increase the use and integration of proactive services based on location in everyday life.
Received: 08 September 2016, Accepted: 16 October 2016, Published Online: 27 October 2016
1. Introduction
The location-based services (LBS) have recently undergone a massive shift in popularity. While the first generation of LBS has not attracted much attention in recent years, the markets will create a wide range of LBS demanding second-generation applications, for example, in the areas of tourism information, navigation, asset tracking, mobile games and mobile marketing, to name just a few. Those above the LBS were under full control over the mobile network of the user operator. As a result, most of these principle LBS do not meet the requirements of users in terms of whether they are limited to rudimentary functions built with less creativity, or was use too expensive or both, see [1], [2]. This is in contrast to current LBS based on a value chain focused on the user where the position of the user is given by the GPS-enabled mobile phone and transmitted to the respective service provider over the network 3G data service either on request or an update- Strategy to meet the needs of users.
The emergence of GPS receivers on the mobile devices has now made it much possible for the first time that proactive monitoring LBS’s has permanently involved the user(s) with the option of just triggering an action of default position event execution. In many situations in our daily lives, proactive LBS’s that are more affordable than the reactants, in which the user have to specifically request for the data based on the location. There are several types of GPS position location point events that can be tested. For example, if the user is in the vicinity of a point of interest (POI) or to user. In the recent past, the concept of geofencing, which represents a subset of LBSs, and which sometimes are also called Zone-based LBSs [3], is gaining momentum. Geofences helps in describing the geographic area (i.e. geographic barrier) a POI, for example, in terms of a circle or a polygon, and combine the area with location events and actions. Typical location events are entering and leaving the geographic region enclosed by the geofence or staying inside or outside for a certain amount of time.
Examples for the actions associated with a geofence or geofences are the presentation of information, an audible notification (music file) when another user sojourns nearby, or the download of a multimedia presentation.
Still, users have to face serious problems in finding the desired services or having to install many different applications for the same type of LBS’s. On the other hand, providers often do not have the knowledge or resources needed since the efficiency of the evaluation of spatial events is quite complex [4], [5]. Our approach solves these problems by providing a common language to describe geofence services GFS’s by introducing an application “Fencebook”.
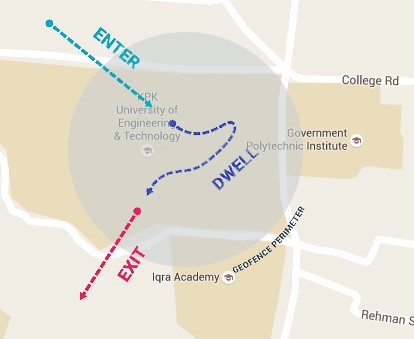 Figure 1: Overview of Geofencing
In the near future, it is expected that for a given local region, for example, a street, a city or a suburb of a city, there will be a multitude of geofencing, which are offered by many vendors to serve application areas as mentioned above. In these multi-vendor environments, some providers may limit their services Geofence a local region, while others interact on a national or even global basis, making the efficient distribution of essential geofences. Our concept will help to minimize the amount of data transferred by only the transfer of the relevant geographic data and current between users and providers. In this paper, the concept of Geofencing is grown by giving a formal definition of geofencing and its characteristics and demonstrating its usefulness in different application scenarios. Furthermore, the paper presents the idea of a geofence market, where suppliers are able to offer their geofences and users can search for and subscribe to geofences interested and relevant to your current local region. Moreover, this approach is compatible specifying provider, hosting, and representing their GFS’s without putting additional infrastructure, providing a common language to describe our market GFS’s and to register, find and recover services. Therefore, a market of this kind can be seen as an intermediary between supply and demand of geofencing; suppliers can export the GFS’s market, while users can search conveniently in one place and import.
2. Methodology
In many markets, companies need to invest in advertising to raise awareness of new products, prices and special offers (see informative advertising). Until recently, advertising strategies are primarily for the companies to adapt the traditional media and mass audiences. Today, companies can take advantage of new opportunities to offer specific ads targeted market segments, such as
- Mobile coupons and sophisticated forms of advertising based on location, including geofencing and geoconquesting.
- The use of such advertising techniques greatly increases the possibility of targeted advertising and discrimination.
- Price in real markets, not all consumers are equally valuable for companies. While some consumers may have a relative preference for the product (hard segment) of a company other consumers may have a relative preference to competing products (weak segment). Therefore, companies in these markets need to choose the intensity of advertising and price that fits every market segment.
Objective:
The objective of this paper will be cleared by explaining the flow chart and algorithmic description.
2.1. Algorithmic:
The algorithm on the basis of which we created our application and the number of customers were almost of the same rate as per our calculations:
Z = [Nr.p/y *y]/p
Where,
Z = No of Expected Customers
r = Radius of Geofence (km)
p = Total No of People
N = No of advertisements
y = Time consumed
So the total number of customers who will be receiving the notification of advertisement completely depend on the No of ads, the time consumed, total no of people in that geofence and the radius of the geofence. We named this algorithm as “owais’s algorithm” Let’s take an example, lets no of to be displayed are two so there are two categories of ads now (one sports related and one business related), the time consumed is 120 seconds and the radius of the geofence is 500m. Total number of people living inside the geofence are lets say 3000. So number of customers be 231.707 which are almost the same with respect to our survey.
2.2. Flowchart:
- Query Operating System for General Location and Accuracy: First of all, the current location of the user/customer will be checked and recorded.
- Send Location and Accuracy to Server: After that the location of the customer will be sent to the database where it will be compared with the Latitude and longitude values of the geofence.
- Receive Set of Nearest geofences: The location’s latitude and longitude values will be compared will all the nearest geofences.
- Receive Location Update Event from Operating System: Geographic coordinates are continuously updating and when ever a user/customer enters a geofence the coordinates are automatically compared with the geofence.
- Query Operating System for General Location and Accuracy: Its like the first step the locations are stored and compared continuously in to the data base.
- Compare New Location to Set of Nearest geofences: The process will be repeated again and the extracted coordinates will be compared with the nearest geofences.
- Is new location near geofence: If there is any new location near geofence then the process will go further, else the process will be repeated again from step (c).
- Obtain location at higher resolution: If there is new location near the geofence then a high resolution means the zoomed version of the location will be obtained.
- Is New(HR) Location near Geofence: Then the application will check for the new location (in the zoomed Version) near the geofence if there is no such Location then the process will be repeated again from step (c), otherwise the application will go further.
- Is Location in Geofence Not Previously Entered: As the user/customer enters the geofence, a question will arise that is the location in the geofence previously entered or not?
If yes, then (K) will be implemented else (M) will be implemented.
- Mark Geofence as entered: if the geofence is not previously entered so a function will be called.
- Send Message to Server Indicating Geofence Entry: So if the user is not entered before the specific geofence, the message(ad) related to that geofence would be sent to the Server which will indicate the Entry of the user.
The m, n, o, p is behaving exactly the same just in the opposite direction of the geofence entry. In this case it’s the exiting from the geofence.
This paper shows that how geofencing play its role and the results also shows that it is extremely beneficial. First of all, the shop keeper or retailer will signup to the account and would set the desired location on map. After that he will be asked to set the radius as well. By clicking the “New tag” one would be prompted to set the desired geofence. Tag name would be generated automatically with respect to the location. Now its time to define a specific message for the created geofence, so that when the customer enters the location or leave the location they are been notified. The message will be based on the choice of the retailer either he wants to display the ad by entering the geofence or exiting the geofence.
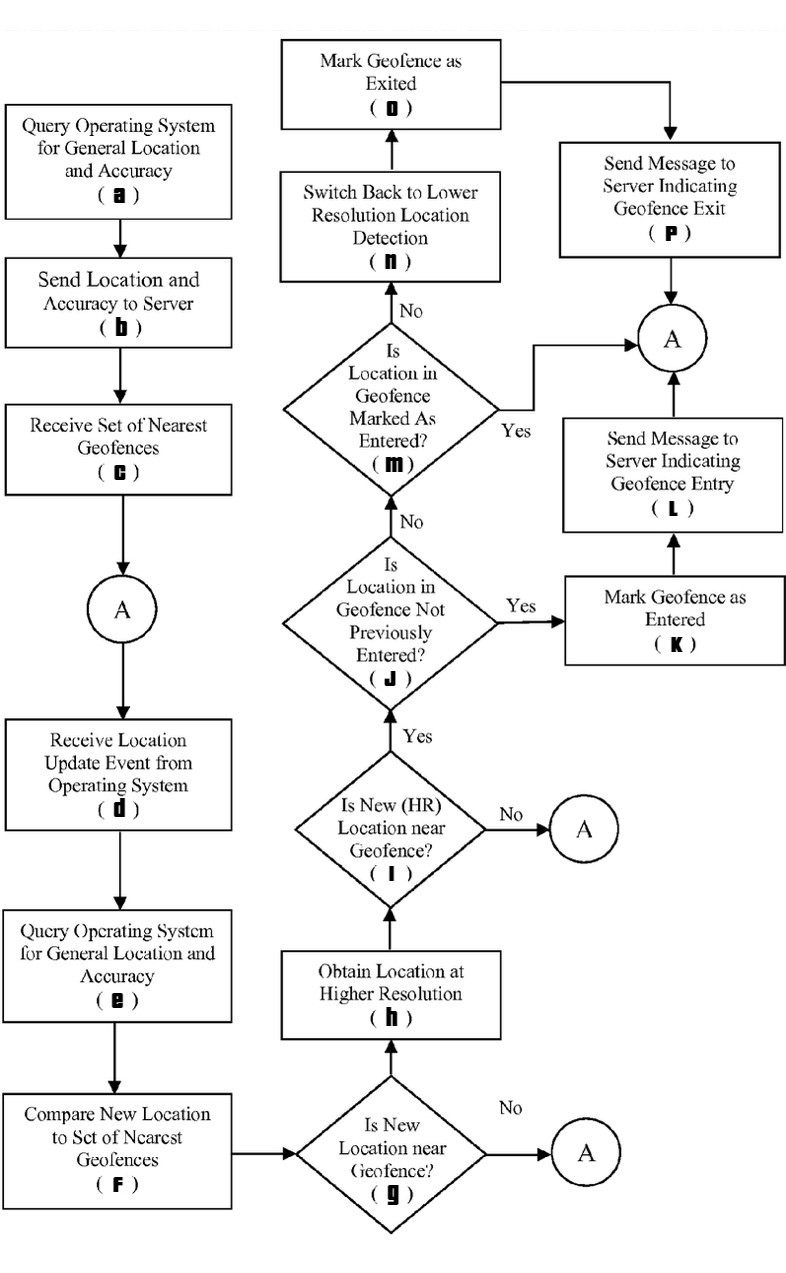 Figure 2: Block Diagram
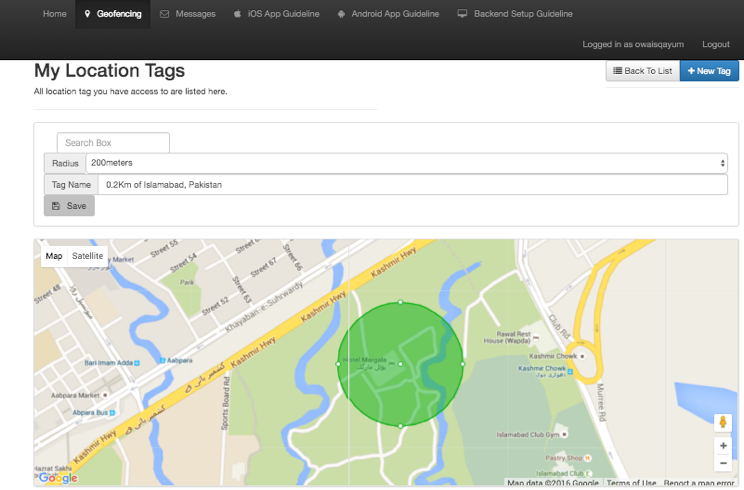 Figure 3: Adding Geo Tag
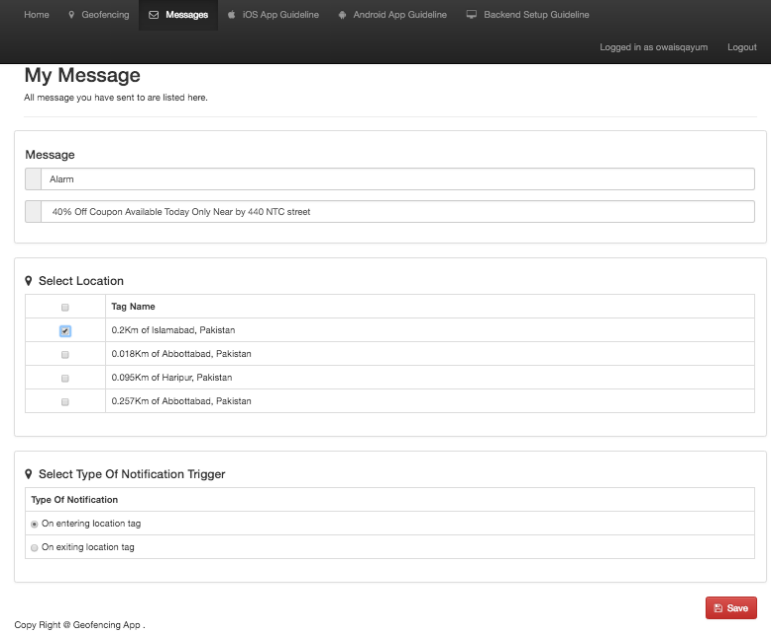 Figure 4: Advertisement for the created geofence
After following these simple steps, the ad will finally appear on the Android or IOS phone as the customer enters the geofence. Retailer can also turn the geofence status on and off any time She/he want’s.
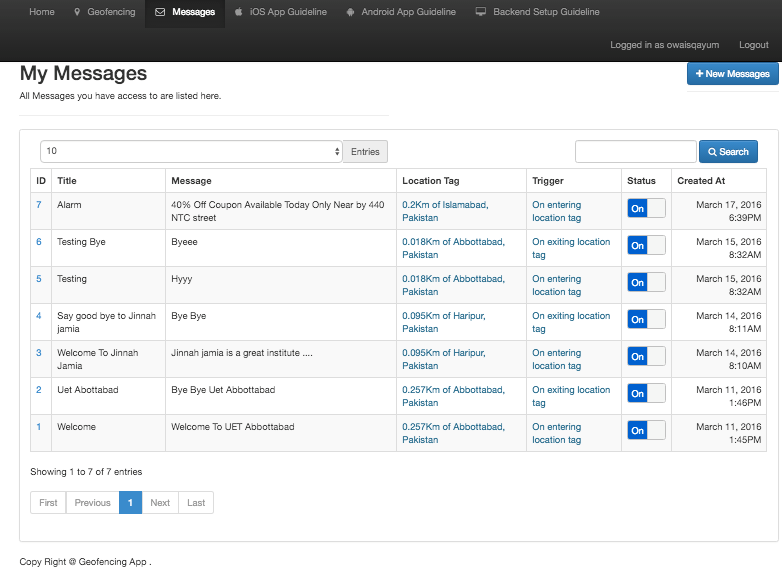 Figure 5: Setting the Geofence
Finally, when the customer enters the geofence, he will be notified and the ad will also display even when the customer is not using his phone.
So after discussing the complete methodology lets see what are the astonishing results achieved by testing the application locally.
3. Results and Discussion
The paper explains the result obtained in a really comprehensive way. The facts elaborate the future worth of Geofencing. After analyzing the application for a specific period of time its been concluded that the advertisements through geofencing were 35% more beneficial than the random methods of advertising. This means that if this application is implemented on a very large scale, it can turn around the world of advertisements and can change the complete shape of advertisements system.
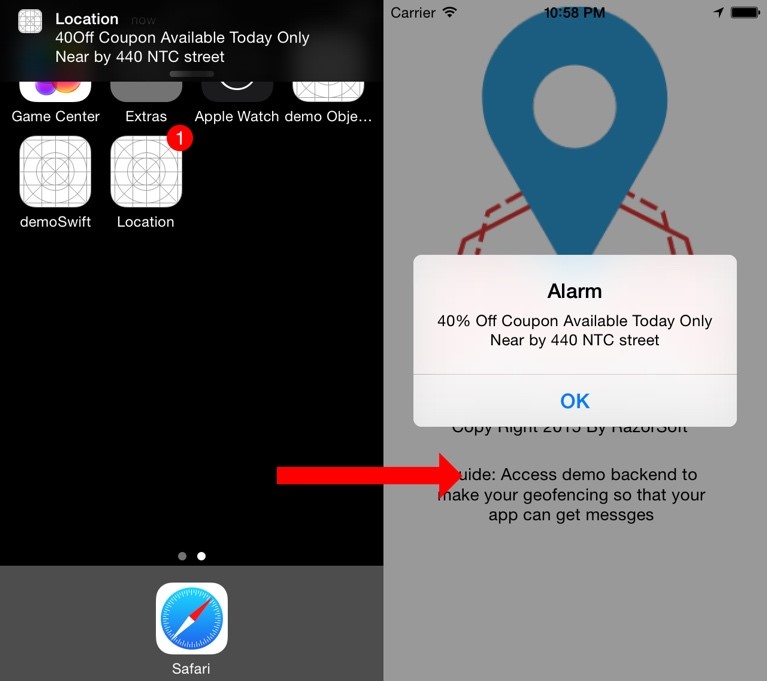 Figure 6: Live View of the App
Table 1: Analysis of Local Stores Advertisements flow
| App | Shop A | Shop B | Shop C | Total |
| Max No of adds sent | 23412 | 65873 | 841603 | 930888 |
| Geofences | # of adds to Shop A | # of adds to Shop B | # of adds to Shop C | Size of Geofence |
| Geofence 1 | 734 | 734 | 935 | 2403 |
| Geofence 2 | 734 | 745 | 916 | 2395 |
| Geofence 3 | 734 | 760 | 953 | 2447 |
| Geofence 4 | 734 | 739 | 930 | 2403 |
| Geofence 5 | 12376 | 7001 | 987 | 20364 |
| Geofence 6 | 749 | 45639 | 9134 | 55522 |
| Geofence 7 | 745 | 799 | 12931 | 14475 |
| Geofence 8 | 768 | 981 | 31835 | 33584 |
| Geofence 9 | 784 | 713 | 73812 | 75309 |
| Geofence 10 | 734 | 734 | 83571 | 85039 |
| Geofence 11 | 36704 | 81274 | 53986 | 71964 |
| Geofence 12 | 790 | 3000 | 93752 | 97362 |
| Geofence 13 | 734 | 7435 | 32187 | 40356 |
| Geofence 14 | 1200 | 9371 | 91467 | 92038 |
| Geofence 15 | 734 | 96817 | 97630 | 99181 |
Graph 1: Growth in No of Advertisements Per week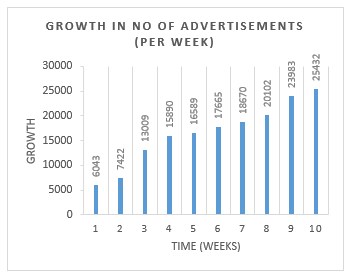
As the application is not live yet there is some troubleshooting to be done but after analyzing “Fencebook” for two and half months on a local platform, it is been analyzed that the use of internet is increased specially in Android phones[6],[7] and hence it is the main factor why people are switching towards LBS (Location based Services). These are the total no of advertisements with respect to the total weeks “Fencebook” was locally live. So this graphical overview is more expalined by table 2, table 3 and graph 3. As we can see in table 2 the comapirason is also made with the other methods just to comapre geofencing with other methods. Further comparison is with Billboards and Television advertisements. In conclusion of the comparison the following results were observed.
Table 2: Comparison with other methods
| No of orders | Through Billboards | Through Television | Through Geofencing |
| week 1 | 3012 | 3798 | 6043 |
| week 2 | 3112 | 3809 | 7422 |
| week 3 | 4312 | 4321 | 13009 |
| week 4 | 2342 | 4504 | 15890 |
| week 5 | 4312 | 4355 | 16589 |
As we can see from table 2 the weekly comparison of all the methods of advertisements, geofencing is found to be the best among all. After five weeks the customers of geofencing almost increased to triple means 300% better then that of billboards advertisements. The advertisements with other methods like bill boards is are not further effective because its not economical and its also not noticeable even by the person living in the next street. Also the increase was not just measured in the number of customers but also in the number of shops who adopted the advertisement technique of geofencing. This can be shown in table 3. During analyzing all this data, it is also analyzed that no of shops and stores exponentially started using the services and results were remarkable.
Table 3: Increase of shops/stores connectivity
| No of weeks | No of shops |
| week 1 | 20 shops were advertising |
| week 2 | 50 shops were advertising |
| week 3 | 120 shops were advertising |
| week 4 | 200 shops were advertising |
| week 5 | 270 shops were advertising |
| week 6 | 360 shops were advertising |
| week 7 | 426 shops were advertising |
| week 8 | 675 shops were advertising |
The above table can be easily elaborated with the help of a Graph. Graph 2 shows how the number of shops increased exponentially.
Graph 2: Increase of shops/stores connectivity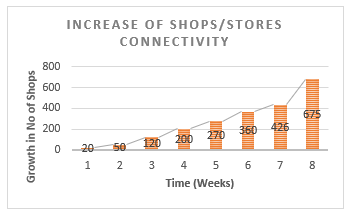
After week eight we stop permissions for other shops due to the lack of Server Space [8] and in the tenth week we finally shut the whole system down.
4. Previous work
Shilony in 1977 presented an idea about geofencing (LBS). Let Suppose a person name Adam shall consider two companies, A and B, the launch of a new product for consumers who can buy from a company only if they receive an advertising message. Advertising creates awareness (and also the price ratios). The set of potential buyers is composed of two different segments of the same size, half of consumers have a relative preference for product A, while the remaining consumers have a relative preference for the product B. The non-use of any buy the brand most preferred is exogenously given by g > 0, place in an interpretation, this means that consumers can buy without cost society in his neighborhood, but it involves a shipping cost if they go to the farthest society. This structure of demand (the Shilony 1977) [9] suggests that, although companies may have an advantage over its competitors, all informed (consumers) may, ultimately, be induced to change. With targeted advertising [10] and price discrimination, each company’s strategy is to choose an intensity of advertising and difference to meet the strong and weak segments of the market price. Investing in advertising, companies so endogenous market segment captive customers (i.e. partially shown), selective (i.e. fully informed), and uninformed.
To motivate our model, consider the following example from advertising based on the location through geofencing / geoconquesting, which has become a major player in the world of advertising and marketing theme. Suppose two companies, McDonalds (Mc) and Burger King (BK), is running an awareness of mobile advertising campaign of a new menu item. Both about the position of consumers are fully informed (for example, if a consumer is close to allowing them to send ads Mc or BK shop or store) and have access to advertising based on location Location based ads (LBA) [11] instruments with different offers (pricing) for customers in different locations. For example, consider a potential customer standing in front of the door of BK. BK can send the customer an offer advertising in question. The consumer can also be traced from the Mc in the district, which can, in turn, will send an advertisement with a special offer (discounts or other rewards). If the latest announcement is quite convincing, Mc able to attract the consumer to travel to more remote sales (incurring the cost). The practice of reaching consumers about competitor has recently been marked geoconquesting strategy. Today, geoconquesting ads are often used in markets where there is a small window of thought before buying (e.g. retail, restaurants, hotels, travel), as well as companies that sell goods (e.g. cars).
The model described in this document fits well with advertising policies and prices that are currently possible using mobile devices, such as LBA and mobile coupons. This type of advertising strategies / prices has already been used by brands such as Starbucks, Burger King, Taco Bell, Tasti-D-Lite, Macy’s, and Pepsi. For example, the CEO of PlaceIQ startup based in New York recently said PlaceIQ can be used to attract potential customers away from the position of a competitor. With this technology, Lexus could identify users of mobile phones in an Audi dealership and will serve as a mobile ad to direct them to the nearest Lexus dealer.
In the previous examples, consumers’ physical location is a key determinant of firms’ advertising strategies. However, our stylized model is also suitable for analyzing other forms of targeting advertising strategies in which the geographical element is not intrinsically present. For example, in the case of contextual advertising through search engines, firms may use conquesting ads by targeting them to consumers with an intrinsic preference for the rival firm. In this important work for understanding the decisions advertising companies for their segments strengths and weakness of market information is available. An important contribution is a clear description of market characteristics required for both advertising results, i.e. the most intense advertising on strong market of a company and its weak market balance when companies can make informative advertising revolt. And ‘it demonstrated that the relative attractiveness of market weakness and the level of advertising costs are key determinants of equilibrium. When the appeal of the weakest segment is down, advertising regardless of the costs, the standard result in literature prevails: It’s always best for each company to announce more about his poor man in his strongest segment segment. When the weak market is sufficiently attractive, the two equilibrium outcomes are possible: Every company prefers to promote more intensely on its weakest segment when advertising costs are low enough; the opposite occurs when advertising costs are high. This result allows us to provide a theoretical basis for the increasingly popular advertising geoconquesting strategic strategies: Advertising with less intensity in their strong market, every company invites his opponent to play less aggressive in that market.
It ‘also concerned that changes depending on the specific advertising decisions and balancing benefits when companies move from a world of a uniform price discrimination [12]. In particular, the result of an increase weakness of the advertising market arises only in equilibrium with price discrimination. With a uniform price, every company always prefer to promote more intensively on its strong market. Finally, our report also shows that price discrimination through targeted advertising can increase your business profits.
Our analysis is more closely related to Iyer et al. (2005). He Characterize a distinct market in a Varian (1980) [13] of type set-up: The market is segmented so exogenous between captive consumers and comparison shoppers. When companies decided to advertise a specific segment of informing the entire segment. The authors showed that all consumers remain poorly informed without advertising, advertising companies more and more for their preference to high segment shoppers. Thus, companies avoid the Bertrand strategic competition in this weak market (see Tirole 1988) [14]. Finally, Iyer et al. (2005), with respect to targeted advertising company decisions under uniform price against price discrimination. In their setting, price discrimination does not affect the advertising intensity targeted to each market segment; it also does not affect the firm’s profits. Therefore, our work is complementary Iyer et al. (2005), studying targeted advertising and pricing structure with a different question. Thus, new knowledge can be obtained about the advertising strategies of companies and the impact of price discrimination on strategies and advertising profits of the firm. An important difference between our work and Iyer et al. (2005) is in the behavior of loyal customers (those with a strong preference for a brand). While Iyer et al. (2005) assume that the faithful consumers are increasingly buying their favorite brand (regardless of brand competition on prices), it first assumes that consumers in a particular market segment prefer the sign corresponding to a certain amount but are willing to consider buying rival brand, provided that the price difference is favorable. This hypothesis is consistent with the empirical results show that consumers may switch brands for cost reasons (see, for example, Keaveney 1995 Bolton and Lemon 1999) [15]. namurthi Krishna and Raj (1991) [16] found that consumers are less sensitive faithful to the price that consumers in the choice non loyal decision, but still react to price changes Second, in our set-up, firms’ advertising decisions endogenously segment the market into captive (partially informed) consumers and selective (fully informed) consumers. In light of this, we find that in markets where consumers are uninformed without advertising, the equilibrium outcome may produce more advertising to weak markets. Our explanation is strategic, given the demand formulation à la Shilony (1977), the firms’ ability to engage in price discrimination, and the interplay between advertising costs and the attractiveness of the weak market segment.
Finally, this paper is related to the literature on competitive price discrimination with customer recognition (e.g., Chen 1997, Villas-Boas 1999, Fudenberg and Tirole 2000, and Esteves 2010). In these models the market generally exhibits best-response asymmetry (Corts 1998): The strong market segment of one firm is the weak market segment of the competitor. A common finding in such models (with symmetric firms and fully informed consumers) is that firms charge lower prices to customers in weak markets. Also, compared with uniform pricing, equilibrium profits fall with price discrimination.
5. Comparative Analysis
After comparing our work with previous researchers we concluded that out work is somehow relative to Iyer’s work. Yes, there are some differences. There is very basic and important differences between Iyer’s and ours work, that makes our research and development more sophisticated and better than Iyer’s one and that is cost, speed and amount of targeted customers. In Iyer’s research he divided the information to specific segments of area, as our covers the whole geofence who can not only acess in that geofence but after subscribing to that specific geofence can also comeback every single time they need that service. The table 1, table 3 and graph 1, graph 2 indicates the success rate quite loudly.
6. Conclusion
In this paper a new concept is proposed for the future marketplace in order to distribute GFSs according to a generic service format that will allow the users to easily find and subscribe to services. On the other hand, service providers can specify arbitrary GFSs without much effort or the need for own infrastructure. After analyzing the results, it is clear that geofencing is the future of advertisements and there is a huge potential in it.
The prototype implementation demonstrates the feasibility of a generic service format as proposed in this paper and that GFSs can easily be realized with current standard hardware and cellular network connections.
Using this feature the growth of customers is always rapid as shown in table 1, table 2, table 3 and graph 1, graph 2. So overall using geofencing technique using the algorithm we used in Facebook its possible for almost every business to attract customers in quite a large number.
Future Work: The future work will be concentrated on implementing Fencebook as an improved marketplace test bed for providing many prototype GFS to even more users to gain data on the usability, performance and scalability of our approach. Afterwards we will focus on developing and extending our generic service format. A graphical editor which allows to visually place geofences on a map for creating GFS descriptions can further increase the ease of service provisioning thus bringing up a lot of new services. We will be focusing on Customer and retailer’s communication and the feedback system, which will highly motivate the accuracy and efficiency of the application.
More over an online order system will be introduced so that the customers can easily order the items of there desires. There will also be an option for the customer for choosing the desired category for the notifications they want to receive and also the option of turning the notifications on and off.
Acknowledgment
We would like to thanks our BS (ELECTRONICS) faculty of University of Engineering and Technology (Abbottabad Campus) for their guidance & support with sincerity and dedication. We would like to extend our sincere thanks to our Teachers, family members and friends who’ve willingly supported us to their extent, by sacrificing at times and also prayed for our success throughout this research work.
- Bellavista, A. Küpper, S. Helal. “Location-based services: Back to the future.” IEEE Pervasive Computing 7(2): 85-89 (2008).
- Cupper, G. Treu, C. Linnhoff-Popien. “TraX: a device-centric middleware framework for location-based services.” IEEE Communications Magazine 44(9): 114-120 (2006).
- Küpper, G. Treu. “From Location to Position Management: User Tracking for Location-based Services.” In KiVS Kurzbeiträge und Workshop, 81-88 (2005).
- “Towards the observation of spatial events in distributed location-aware systems,” in Proc. 22nd International Conference on Distributed Computing Systems Workshops, 581–582.
- Küpper, G. Treu. “Efficient proximity and separation detection among mobile targets for supporting location-based community services.” ACM SIGMOBILE Mobile Computing and Communications Review 10(3): 1-12 (2006).
- “Android Took 36% Smartphone Share in Q1: Gartner,” Online Available: http://www.eweek.com/c/a/Mobile-and-Wireless/Android-Took-36-Smartphone-Share-in-Q1-Gartner-375805
- Apples App Store Marks Historic 50 Billionth Download. http://www.apple.com/pr/library/2013/05/16Apples-App-Store-Marks-Historic-50- Billionth-Download.html.
- S. Banik, S. Radhakrishnan, C.N. Sekharan. “Multicast routing with delay and delay variation constraints for collaborative applications on overlay networks.” IEEE Transactions on Parallel and Distributed Systems 18(3): 421-431 (2007).
- J. Mirman, I. Zilcha. “Characterizing optimal policies in a one-sector model of economic growth under uncertainty.” Journal of Economic Theory 14(2): 389-401 (1977).
- V. Lioudakis, E.A. Koutsoloukas, N.L. Dellas, N. Tselikas, S. Kapellaki, G.N. Prezerakos, D.I. Kaklamani, I.S. Venieris. “A middleware architecture for privacy protection.” Computer Networks 51(16): 4679-4696 (2007).
- Jain, A. Puri, R. Sengupta. “Geographical routing using partial information for wireless ad hoc networks.” IEEE Personal communications 8(1): 48-57 (2001).
- Küpper, G. Treu. “From Location to Position Management: User Tracking for Location-based Services.” In KiVS Kurzbeiträge und Workshop, 81-88 (2005).
- R. Varian, “Redistributive taxation as social insurance.” Journal of public Economics 14(1): 49-68 (1980).
- Laffont, J. Tirole. “The dynamics of incentive contracts.” Econometrica: Journal of the Econometric Society, 1153-1175 (1988).
- N. Bolton, K.N. Lemon. “A dynamic model of customers’ usage of services: Usage as an antecedent and consequence of satisfaction.” Journal of marketing research, 171-186 (1999).
- Diaz, I. Maria, F.J.R. Cataluña. “Antecedents of the importance of price in purchase decisions.” Revista de Administração de Empresas 51(4): 370-381 (2011).