Assessment of Wastewater in Duhok Valley, Kurdistan Region/Iraq
Assessment of Wastewater in Duhok Valley, Kurdistan Region/Iraq
Volume 1, Issue 3, Page No 7-13, 2016
Author’s Name: Najmaldin E. Hassana) , Musher R. Ahmed Al-barware
View Affiliations
Department of Environment Science, Faculty of science, Zakho University, Zakho Iraq
a)Author to whom correspondence should be addressed. E-mail: najmaldin.hassan@uoz.edu.krd
Adv. Sci. Technol. Eng. Syst. J. 1(3), 7-13 (2016); ![]() DOI: 10.25046/aj010302
DOI: 10.25046/aj010302
Keywords: Wastewater, Duhok valley, Self- purification

Export Citations
In order to characterize the waste water in Duhok valley in Duhok governorate, during 25km, seven sites were selected in Duhok valley, to represent their water quality. Monthly samples were collected from the Duhok valley for the period from, April to September, 2015. The qualitative study of Duhok valley water tested, as considered one of the main sources of water pollution for Musol Lake. The physical and chemical test for water samples are taken from different locations in Duhok valley. To know the degree of pollution, and the impact of self-purification processes to improve water quality before arriving to the Mosul Lake, and the indicated results of the study a lack of dissolved oxygen in the water (DO). And high organic load values, (BOD) and most of the bad qualities during water passage within the city of Duhok, while meat a significant improvement in the quality of water downstream before arriving at the dam Lake, is attributed to the effect of operations of self- purification ability of water. In spite of salinity problems and toxicity, the quality of water is suitable for irrigation crops on both sides of the valley .The all samples were tested for conductivity, TDS, pH, total hardness, chloride, alkalinity, sulfate, BOD, and phosphate, according to the standard methods.
Received: 08 August 2016, Accepted: 22 August 2016, Published Online: 25 August 2016
1. Introduction
Duhok valley considered as main stream for discharge of different liquid waste of Duhok city and its environs, which is transported by long Stream to Mosul Lake on the Tigris River north of the city of Mosul. After expanding population and evolving social, economic and population growth of the city of Dohuk lead to increase the amount of effluent civil, industrial and agricultural to the valley without making any treatment, as well as increasing environmental pollution and the emergence of problems odor problems, and therefore negative impact on water quality in the Mosul Lake.
Also considered as a source of irrigation of fruits and vegetable located around the valley, which lead to negative events for the plants and production and soil permeability, as well as be used for watering animals and livestock, especially after passing away from the city of Duhok, as being this valley for a distance more than about 25 km before arriving in Mosul Dam, as the spread of Typha and fragment growth on the sides of the valley, which may play an important role in addition to physical and chemical factors in the incidence of operations demineralization self-water contaminated and improve its quality before it reaches Mosul Dam. Waste disposal of civil, agricultural and industrial liquid, untreated directly into the valley is one of the breaches of environmental water resources and a threat to the lives of people for the possibility of the spread of epidemics and diseases such as cholera, typhoid and dysentery.
Water is the most vital element among the natural resources, and is critical for the survival of all living organisms including human, food production, and economic development. Today there are many cities worldwide facing an acute shortage of water and nearly 40 percent of the world’s food supply is grown under irrigation and a wide variety of industrial processes depends on water. The environment, economic growth, and developments are all highly influenced by water-its regional and seasonal availability, and the quality of surface and groundwater. The quality of water is affected by human activities and is declining due to the rise of urbanization, population growth, industrial production, climate change and other factors. The resulting water pollution is a serious threat to the well-being of both the Earth and its population.
Water Pollution and its Impact on the human health are sinks for wastes. Wastes are most often discharged into the receiving water bodies with little or no regard to their assimilative capacities. The discharge of raw sewage, garbage, as well as oil spills are threats to the diluting capabilities of the lagoons and rivers in the major cities. The natural purification of polluted waters in itself is never fast, while heavily polluted water may traverse long distance in days before a significant degree of purification is achieved In addition, valley and canals are becoming increasingly polluted from industrial wastewater dumped by factories. The water pollution threatens food production and is raising both environmental and human health concerns.
Because of the lack of the water resources management plan and policies, both the quality and quantity of water in this valley have reached a very critical situation that does not allow its instant use.
Pollution of the water in these valley also include various industrial discharge, domestic waste; indiscriminate throwing of pathological and commercial wastes.
However, the specific objectives of the study were as follows: To show the variations in different water quality parameters along a strip of the Duhok valley due to the disposal of untreated industrial waste and season change (dry and wet); and To analyze the health problems created by the pollution.
2. Material and Methods
The studied area include seven sites were selected according to the types of waste disposal in Duhok valley water with in Duhok governorate, in Kurdistan region (Figure 1) Monthly sample were collected from the Duhok valley during the period April to September, 2015. All water samples were kept in polyethylene bottles [1].
Water samples were tested the electrical conductivity, total dissolved solids, pH, DO, BOD. Total hardness, the tests were measured according to the following methods: Electrical conductivity (EC), conductivity was estimated by electrical conductivity meter [2]. Lonlab EC, TDS level HANNA instrument, (w t w) the prop was calibrated monthly by buffer solution, on the reading the conductivity values were converted to specific conductivity at 25°C and the results were expressed by as µs/cm.
Total Dissolved solid (TDS) the amount of the total dissolved solids in water was estimated by TDS meter lonlab EC, TDS, level HANNA instrument WTW. Hydrogen ion concentration (pH) the pH was measured directly by using portable pH meter lonlab pH level 2, HANNA instrument, WTW pH meter was calibrated with three buffer solution of pH 4, 7 and 9.
Dissolved oxygen (DO) Determination of oxygen was carried out according to the Winklers methods (Azide modification) as describing by [2], the results were expressed in mg/l. Biochemical oxygen Demand (BOD) the water sample saved in incubator 2 during 5 days under 20°C after that determine dissolved oxygen by Winklers method (Azide modification), as describing by [2].
Total hardness, Estimated of total hardness was made by titrating water sample against EDTA disodium salt with Eriochrome black T, indicator at pH 10. (Using ammonium buffer), the results were expressed in mg/l [2].
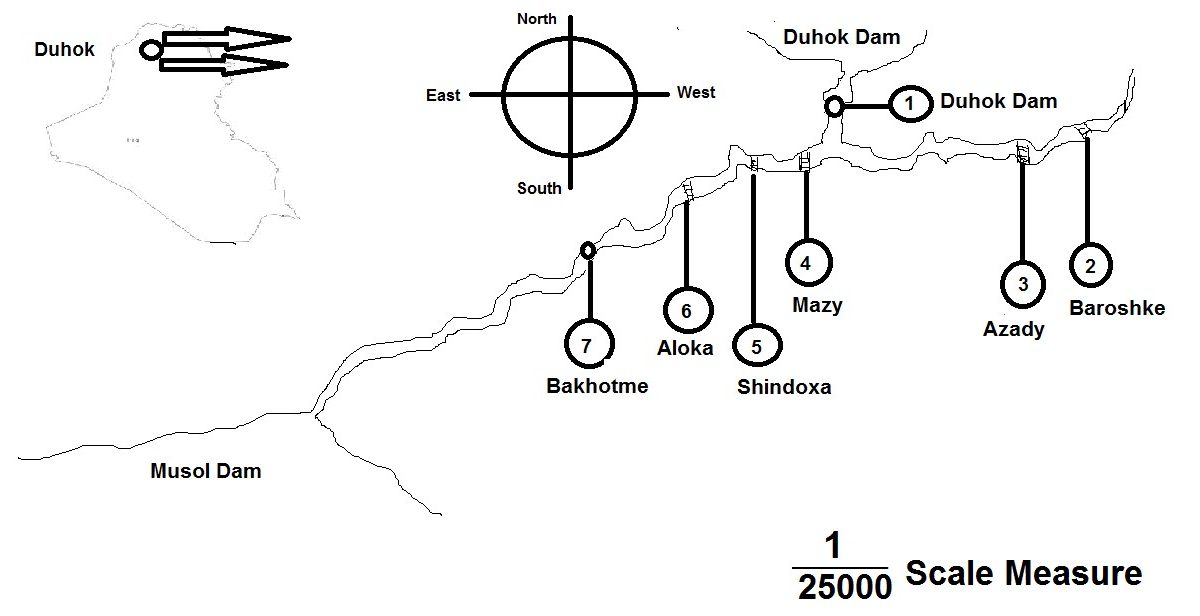
Figure 1: Site location of the studied waste water in Duhok Valley
3. Results and Discussions
Surface water temperature depends largely upon categorize geographic location and climate. results indicate shown in table 1, that the degree of water temperature decrease in temperature especially during the winter and works reduce activity of microbs or microorganisms this increase occurred as a result to the domestic waste discharge to the Duhok valley, this can be solved by rainfalls which will wash the waste from streets and the city’s neighborhoods [3].
The temperature of valley water from the table 1, show the lowest value (16.1°C’ in site Duhok Dam in March. While the highest value of (32-5°C’) in site Baroshke bridge in July.
Table 1: Variation in Temperature of Duhok valley water among the studied period
|
Months Sites |
Mar. | Apr. | May | Jun. | Jul. | Aug. | Sep. | |
| 1 | Duhok dam | 16.1 | 18.2 | 18.8 | 20.1 | 23.2 | 24.6 | 24.8 |
| 2 | Baroshk bridge | 19.3 | 23.4 | 25.1 | 31.6 | 32.5 | 30.7 | 28.2 |
| 3 | Azady bridge | 15.2 | 22.8 | 24.3 | 29.2 | 30.3 | 31.6 | 29.6 |
| 4 | Mazy bridge | 18.8 | 18.6 | 20.6 | 27.5 | 29.2 | 29.6 | 29.2 |
| 5 | Shindoxa | 17.1 | 20.1 | 21.1 | 25.6 | 27.1 | 26.9 | 27.0 |
| 6 | Aloka bridge | 19.6 | 18.8 | 22.4 | 24.1 | 26.6 | 25.7 | 26.8 |
| 7 | Bakhotmy | 18.8 | 19.3 | 21.6 | 23.2 | 22.1 | 21.9 | 21.1 |
There is a strong relationship between electrical conductivity and total dissolved solids they reflect the salinity in the water, as noted in Figure 1 that the electrical conductivity rises in the waters of the valley of Duhok during the runoff in the city of Dohuk, which may be due to the effect of waste water effluent as well as the interactions that occur between the acidic compounds, which formed from oxidation and biological decomposition with the basic compound present around the valley water, which increase the EC value. Table 2 shows variation in the electrical conductivity among the studied valley water. The minimum value was recorded in site Duhok dam was (748) µs/cm in September, but the maximum value (1326) microSiemens/cm was recorded in Baroshke bridge in March. This increasing occurred as a result to the domestic wastes discharge to the Duhok valley and the interaction between the acidic compound which form for oxidation decomposition processes with basic compounds that as found as suspended materials [4], [5].
Table 2: Variation in (EC) microSiemens/cm of Dohuk valley water among the studied period
|
Months Sites |
Mar. | Apr. | May | Jun. | Jul. | Aug. | Sep. | |
| 1 | Duhok dam | 831 | 768 | 842 | 761 | 752 | 801 | 748 |
| 2 | Baroshk bridge | 1326 | 1061 | 1125 | 986 | 869 | 938 | 873 |
| 3 | Azady bridge | 1184 | 1231 | 1026 | 1152 | 969 | 1026 | 963 |
| 4 | Mazy bridge | 438 | 1010 | 882 | 973 | 898 | 909 | 926 |
| 5 | Shindoxa | 858 | 922 | 868 | 963 | 872 | 843 | 857 |
| 6 | Aloka bridge | 892 | 939 | 946 | 871 | 982 | 886 | 892 |
| 7 | Bakhotmy | 984 | 846 | 905 | 973 | 1020 | 1089 | 1105 |
Total dissolved solid (TDS) is the best individual value representing the salinity of the water. Table 3 shows the minimum value of (478) mg/l was recorded in Duhok dam in September. While the maximum value of (787) mg/l was recorded in site Azady Bridge in April. This increases caused by the effects of liquid waste reach to the Duhok valley. All of the recorded value were above the minimum level of drinking water standard for drinking recommended by (WHO) and (EPA) 500 mg/l [6], [7].
Table 3: Variation in (TDS) (milligram per liter) of Duhok valley water among the studied period
|
Months Sites |
Mar. | Apr. | May | Jun. | Jul. | Aug. | Sep. | |
| 1 | Duhok dam | 531 | 491 | 538 | 487 | 481 | 512 | 478 |
| 2 | Baroshk bridge | 784 | 679 | 720 | 631 | 556 | 600 | 558 |
| 3 | Azady bridge | 757 | 787 | 656 | 737 | 620 | 656 | 616 |
| 4 | Mazy bridge | 600 | 646 | 564 | 622 | 574 | 581 | 592 |
| 5 | Shindoxa | 549 | 590 | 555 | 616 | 558 | 539 | 548 |
| 6 | Aloka bridge | 570 | 600 | 605 | 557 | 628 | 567 | 628 |
| 7 | Bakhotmy | 629 | 573 | 579 | 622 | 652 | 696 | 707 |
The results shown in the table 4 indicate that the pH drop in the values of the Duhok valley may return to the impact of domestic, industrial and agriculture waste discharged in Valley Duhok, and the occurrence of decomposition and oxidation processes, which lead to formation of many compounds of acidic, such as acetic acid and mineral acid.
Continuation of the relative decline of the rate of pH values during the runoff valley within the city, and rise after leaving them up to the average before coming to Lake Mosul Dam, and rise in values may be due to the consumption of dissolved CO2 gas.
In water, results from the decomposition and oxidation of the vital operations of the water by algae and aquatic plants, for processes of photosynthesis, which leads to raise the values may be due to bicarbonates ions, soluble consumption as a source of organic carbon for aquatic plants, for the manufacture of food [8].
Table 4 shows a variation pH values among the studied valley waste water. the minimum value of (5.7) was recorded in site Azady bridge in March, while the maximum value of (8.2) recorded in site Bakhotme in March , this increase of pH due to nature of pollutions which reach to the Duhok valley, such as fertilizers and detergents that has alkaline effect on the water [9-10].
Table 4: Variation in pH of Duhok valley water among the studied period
|
Months Sites |
Mar. | Apr. | May | Jun. | Jul. | Aug. | Sep. | |
| 1 | Duhok dam | 8.1 | 8.0 | 7.8 | 7.6 | 8.0 | 7.9 | 8.1 |
| 2 | Baroshk bridge | 6.6 | 6.4 | 6.3 | 5.9 | 7.2 | 7.1 | 6.8 |
| 3 | Azady bridge | 5.7 | 6.1 | 6.7 | 6.4 | 7.2 | 6.7 | 6.8 |
| 4 | Mazy bridge | 7.5 | 7.3 | 7.1 | 6.9 | 7.4 | 7.3 | 7.1 |
| 5 | Shindoxa | 7.3 | 6.9 | 7.4 | 7.1 | 7.3 | 7.3 | 7.4 |
| 6 | Aloka bridge | 7.4 | 7.4 | 7.6 | 7.5 | 7.6 | 7.4 | 7.6 |
| 7 | Bakhotmy | 8.2 | 8.0 | 8.1 | 7.8 | 7.7 | 7.6 | 7.8 |
Dissolved oxygen is an important parameter for water quality as well as the importance of living of aquaculture operation, and self- purification ability of water and prevents the formation and emission of unfavorable odors and harmful compounds for the environment. Low concentration of dissolved oxygen in the water in sites within the City, that due to the large amount of organic materials resulting from the discharge of effluents into the valley, leading to the increase in the number and activity of microorganisms, in the decomposition and oxidation of organic processes thus reducing the dissolved oxygen in the water. And thus is the quality of the waters of the valley. It is considered exceeding the permissible limits of water pollution surface running by Iraqi determinants. And therefore, it’s not suitable for aquatic living. Rises dissolved oxygen concentration in the water after the departure of the valley from the city of Duhok, this increase in concentration, may be due to the processes of self-purification occurring in the water and processes of photosynthesis.
The dissolved oxygen value of Duhok valley waste water represented in table 5, the high dissolved oxygen concentration were recorded is site Duhok dam in March was (8.4) mg/l while the lowest value was recorded in site Baroshke bridge and mazy bridge was (0.0) mg/l , this decreasing occurred as a result to the oxidation and decomposition processes for organic materials by bacteria, the increase of domestic and agricultural waste in to the environment helps the growth of bacteria by oxidation processes [11], [8].
Table 5: Variation in DO (mg/l) of Duhok valley water among the studied period
|
Months Sites |
Mar. | Apr. | May | Jun. | Jul. | Aug. | Sep. | |
| 1 | Duhok dam | 8.4 | 8.2 | 8.0 | 7.8 | 7.7 | 7.6 | 7.5 |
| 2 | Baroshk bridge | 2.1 | 2.8 | 1.5 | 0.0 | 0.0 | 0.0 | 0.0 |
| 3 | Azady bridge | 3.0 | 2.5 | 3.1 | 2.2 | 1.8 | 0.8 | 0.8 |
| 4 | Mazy bridge | 1.9 | 2.0 | 1.6 | 0.0 | 0.0 | 0.0 | 0.0 |
| 5 | Shindoxa | 2.6 | 1.8 | 2.5 | 1.3 | 1.8 | 1.6 | 1.9 |
| 6 | Aloka bridge | 6.1 | 5.8 | 6.9 | 6.4 | 7.1 | 6.8 | 6.4 |
| 7 | Bakhotmy | 7.3 | 7.6 | 7.9 | 8.1 | 7.8 | 7.5 | 7.8 |
The values of organic load, the impact reflected on the odor, taste and smell, and notes in field in sampling it is essential to assess water quality. And results indicate shown in the table 6 to the high organic load values as the water flow into the city to reach the highest concentration to which dates back to the waste put Civil and liquid waste restaurants and hotels to water valley. In addition to rise the organic waste from the city during rainstorms and transported to valley. Water Valley is considered very bad to the values of organic load, (BOD) as classified whence, as well as exceeding the limits of the Iraqi permitted the contamination of water sources ,as unpleasant odors, spreading negative effects, to include aquatic life and the negative impact on the smooth running in this environment,
We observed that there is a significant improvement on the quality of water obtained after valley passes from the city of Duhok, because of its self-purification and of the physical, chemical and biological processes. For Biochemical Oxygen Demand (BOD), in the table 6 shows the highest concentration recorded in site Azady bridge was (147) mg/l in July, while the lowest value was recorded in site Duhok dam outflow stream was (1.8) in August, the increase result in Duhok valley may be due to domestic, industrial and Agriculture waste discharge to the Duhok valley which contain organic matter contain different types pollutants [12].
Table 6: Variation in BOD5(mg/l) of Duhok valley water among the studied period
|
Months Sites |
Mar. | Apr. | May | Jun. | Jul. | Aug. | Sep. | |
| 1 | Duhok dam | 3.1 | 2.8 | 3.1 | 1.9 | 2.1 | 1.8 | 2.7 |
| 2 | Baroshk bridge | 111 | 46 | 103 | 124 | 116 | 88 | 121 |
| 3 | Azady bridge | 137 | 125 | 93 | 118 | 147 | 48 | 122 |
| 4 | Mazy bridge | 105 | 41 | 86 | 47 | 114 | 83 | 75 |
| 5 | Shindoxa | 83 | 71 | 86 | 68 | 63 | 72 | 64 |
| 6 | Aloka bridge | 45 | 52 | 48 | 56 | 47 | 36 | 42 |
| 7 | Bakhotmy | 37 | 29 | 32 | 24 | 19 | 20 | 16 |
The Calcium and magnesium ions often causing total hardening are often common in water. And also notes the relatively high concentrations of total hardness in valley water since entered the city of Duhok, which may be due to the influence of geological factors on spring water nutrients to this valley. As the low concentration notes during the rainy seasons due to the dilution, and higher concentrations during the dry season due to the operations of the Evaporation of water. It observed the low concentration after the water passes the Duhok city, which may be due to sedimentation and uptake of ions and the absorption of these ions by aquatic plants.
In table 7 shows the total hardness in the Duhok valley waste water, the minimum value of total hardness was recorded in the Azady bridge was (428) mg/l in August, while the maximum value was recorded in Bakhotme site was (722) mg/l, in March. This increase occurred as a result to the Agriculture and domestic wastes discharge to Duhok valley and wastes from soil during the rain seasons [5]. The variation of hardness is probably related to the geological formation of the area [13].
Calcium hardness is part of the total hardness. The results in table (8) shows the lowest value was recorded in site (Mazy bridge) was (401) mg/l in August, While the highest value was recorded in site Bakhotme was (632 mg/l) in May. These results reflects the characteristics of the geological formation rich with calcium and magnesium in contact with water [14].
Table 7: Variation in total hardness of Duhok valley among the studied period.
|
Months Sites |
Mar. | Apr. | May | Jun. | Jul. | Aug. | Sep. | |
| 1 | Duhok dam | 593 | 611 | 579 | 541 | 561 | 580 | 571 |
| 2 | Baroshk bridge | 702 | 683 | 663 | 713 | 651 | 505 | 482 |
| 3 | Azady bridge | 611 | 572 | 589 | 477 | 436 | 428 | 459 |
| 4 | Mazy bridge | 643 | 634 | 564 | 621 | 548 | 482 | 438 |
| 5 | Shindoxa | 634 | 582 | 608 | 487 | 453 | 539 | 411 |
| 6 | Aloka bridge | 603 | 576 | 531 | 486 | 469 | 502 | 527 |
| 7 | Bakhotmy | 722 | 685 | 706 | 612 | 588 | 562 | 559 |
Table 8: Variation in calcium hardness of Duhok valley water among the studied period
|
Months Sites |
Mar. | Apr. | May | Jun. | Jul. | Aug. | Sep. | |
| 1 | Duhok dam | 496 | 563 | 493 | 448 | 493 | 498 | 482 |
| 2 | Baroshk bridge | 593 | 591 | 586 | 623 | 584 | 436 | 389 |
| 3 | Azady bridge | 538 | 499 | 493 | 386 | 376 | 346 | 385 |
| 4 | Mazy bridge | 547 | 561 | 483 | 448 | 471 | 401 | 368 |
| 5 | Shindoxa | 552 | 485 | 477 | 406 | 396 | 448 | 372 |
| 6 | Aloka bridge | 473 | 489 | 462 | 359 | 387 | 388 | 426 |
| 7 | Bakhotmy | 566 | 601 | 632 | 561 | 502 | 483 | 497 |
For magnesium (Table 9) the lowest concentration were recorded in Shindoxa site was (39) mg/l in September, while the highest value was recorded in site Bakhotme as (136) mg/l in March. These results may be due to waste disposal of civil, Agriculture and Industrial liquid to Duhok valley.
Table 9: Variation in Magnesium hardness of Duhok valley water among the studied period
|
Months Sites |
Mar. | Apr. | May | Jun. | Jul. | Aug. | Sep. | |
| 1 | Duhok dam | 97 | 48 | 86 | 93 | 68 | 82 | 89 |
| 2 | Baroshk bridge | 109 | 92 | 77 | 108 | 67 | 69 | 93 |
| 3 | Azady bridge | 73 | 73 | 96 | 91 | 60 | 82 | 74 |
| 4 | Mazy bridge | 96 | 78 | 81 | 73 | 77 | 81 | 70 |
| 5 | shindoxa | 82 | 97 | 131 | 81 | 57 | 91 | 39 |
| 6 | Aloka bridge | 130 | 87 | 69 | 127 | 82 | 114 | 101 |
| 7 | Bakhotmy | 136 | 84 | 74 | 51 | 86 | 79 | 62 |
The high concentration of chloride ions with runoff water in the valley within the city of Duhok, result to put the large amount of sewage residential units, restaurants, and hotels, as studies refer the amount of chloride which discharge by one human every day is (6) grams, which leads to high concentration of chloride ions in the waters of the Valley.
As noted in the table 9 a decline of improvement in the quality of the valley after leaving the city of Duhok over the long stream. more than twenty-five kilometers before arriving the Mosul Dam, which may be due to absorbed by aquatic plants, especially sugar cane plant. The chloride of water clarifies from the table 10, that the maximum value of (185.2) mg/l was recorded in site Baroshke bridge in May while the lowest value was recorded in site Duhok dam in July was (31.1) mg/l, All the value are within the recommended levels of 250 mg/l chloride concentration can be used as an indication of sewage agriculture and industrial pollution [15-16].
Table 10: Variation in chloride of Duhok valley water among the studied period.
| Months Sites | Mar. | Apr. | May | Jun. | Jul. | Aug. | Sep. | |
| 1 | Duhok dam | 46.6 | 38.3 | 43.8 | 32.6 | 31.1 | 40.2 | 38.6 |
| 2 | Baroshk bridge | 171.1 | 168.1 | 185.2 | 160.3 | 138.5 | 122.6 | 135.6 |
| 3 | Azady bridge | 80.8 | 96.1 | 111 | 93.5 | 109.1 | 107.2 | 93.8 |
| 4 | Mazy bridge | 77.3 | 80.5 | 71.6 | 60.8 | 68.5 | 70.2 | 60.3 |
| 5 | Shindoxa | 63.2 | 54.1 | 60.8 | 55.7 | 63.2 | 71.2 | 65.9 |
| 6 | Aloka bridge | 51.9 | 34.6 | 40.0 | 36.7 | 49.1 | 44.3 | 51.7 |
| 7 | Bakhotmy | 37.2 | 28.6 | 46.1 | 55.6 | 62.6 | 67.8 | 64.2 |
Cause baseline water for the presence of ions bicarbonates and carbonate and hydroxide, Since water valley values did not reach 8.3 pH, this means that base in the cause of bicarbonates ions, and notes from the table 11 that the high concentrations may be due to formation of acidic compounds from the decomposition of organic materials, such as carbonic acid which acts solubility of calcium carbonate sediment and benthic.
And suspended solids and converted into bicarbonate calcium. As can be seen from the table 11 lower total basal concentrations of ions bicarbonates the waters of the valley out of the city, and could be due to the dioxide carbon consumption and ions bicarbonates as a source of organic carbon processes of photosynthesis of plants percent and algae, which leads to the low concentration of ions bicarbonates and basal due to sedimentation. Table 11 shows significant differences in alkalinity of Duhok valley water among the studied period. The highest values were recorded in site Baroshke bridge was (388) mg/l in August, while the lowest value were recorded in site Duhok dam was (31.1) mg/l in July. As Alkalinity is naturally occurring in water, it is variation can be related to geological formation of the sites as well as the discharge of pollutants to Duhok valley [17].
Table 11: Variation in total Alkalinity of Duhok valley water among the studied period
|
Months Sites |
Mar. | Apr. | May | Jun. | Jul. | Aug. | Sep. | |
| 1 | Duhok dam | 153 | 137 | 123 | 141 | 136 | 127 | 117 |
| 2 | Baroshk bridge | 382 | 368 | 371 | 373 | 365 | 388 | 372 |
| 3 | Azady bridge | 284 | 315 | 326 | 281 | 311 | 326 | 288 |
| 4 | Mazy bridge | 329 | 369 | 361 | 416 | 374 | 355 | 323 |
| 5 | Shindoxa | 281 | 305 | 286 | 281 | 315 | 299 | 266 |
| 6 | Aloka bridge | 217 | 223 | 237 | 211 | 197 | 200 | 244 |
| 7 | Bakhotmy | 264 | 253 | 269 | 256 | 246 | 239 | 228 |
Table 12 shows sulfate concentration in the studied Duhok valley along the Study period. It’s range between (67-237) mg/l. With significant difference among the Duhok valley within Duhok city. The highest concentration was recorded in site Shindoxa was (237) mg/l in May, while the lowest concentration was recorded in Aloka bridge was (67) mg/l, in August, this increasing occurred as result to Agriculture and runoff transport sulfate from sewage and fertilizer to Duhok valley [3].
Table 12: Variation in sulfate of Duhok valley water among the studied period.
|
Months Sites |
Mar. | Apr. | May | Jun. | Jul. | Aug. | Sep. | |
| 1 | Duhok dam | 83 | 104 | 96 | 100 | 125 | 188 | 113 |
| 2 | Baroshk bridge | 154 | 149 | 166 | 203 | 182 | 175 | 162 |
| 3 | Azady bridge | 134 | 158 | 119 | 94 | 133 | 115 | 137 |
| 4 | Mazy bridge | 171 | 188 | 143 | 105 | 141 | 138 | 127 |
| 5 | Shindoxa | 206 | 195 | 237 | 204 | 173 | 165 | 177 |
| 6 | Aloka bridge | 93 | 88 | 101 | 76 | 89 | 67 | 78 |
| 7 | Bakhotmy | 121 | 113 | 93 | 127 | 108 | 126 | 105 |
Table 13 shows a significant variation in phosphate value among the studied Duhok valley water included in the study with a range from (4.9 to 23.2) mg/l, the highest concentration was recorded in mazy bridge was (23.2) mg/l, This increasing occurred as a result of domestic and Agriculture wastes [18]. While the lowest concentration was recorded in site Duhok dam was (4.9) mg/l, in September.
Table 13: Variation in phosphate of Duhok valley water among the studied period
|
Months Sites |
Mar. | Apr. | May | Jun. | Jul. | Aug. | Sep. | |
| 1 | Duhok dam | 8.1 | 6.5 | 7.2 | 9.3 | 8.6 | 5.7 | 4.9 |
| 2 | Baroshk bridge | 12.6 | 20.3 | 18.1 | 20.4 | 23.1 | 19.9 | 20.6 |
| 3 | Azady bridge | 15.3 | 17.1 | 10.2 | 11.6 | 21.9 | 17.6 | 19.3 |
| 4 | Mazy bridge | 17.3 | 15.2 | 20.6 | 18.4 | 23.2 | 18.8 | 21.4 |
| 5 | Shindoxa | 21.1 | 19.6 | 21.5 | 16.7 | 24.5 | 23.1 | 21.6 |
| 6 | Aloka bridge | 13.3 | 14.7 | 10.2 | 12.8 | 8.9 | 11.7 | 12.3 |
| 7 | Bakhotmy | 16.2 | 18.4 | 20.5 | 21.3 | 19.8 | 21.7 | 22.3 |
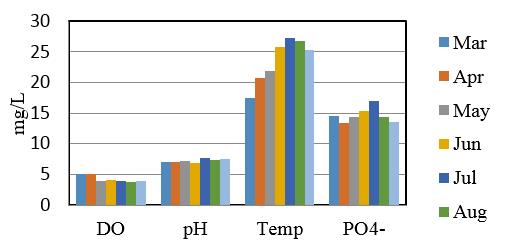
Figure 2: Comparison of some Physico-Chemical parameters variation in seven sampling stations (Mar, Apr, May, Jun, Jul, Aug and Sep) at Duhok valley. Units of DO and Po4- are (mg/L).
Table 14: Demonstrate the minimum, maximum and mean values of study sites.
|
Date of Sampling Physio- Chemical Parameters |
Mar | Apr | May | Jun | Jul | Aug | Sep | |
| Temperature | Min | 15.2 | 18.2 | 18.8 | 20.1 | 22.1 | 21.9 | 21.1 |
| Max | 19.6 | 23.4 | 25.1 | 31.6 | 32.5 | 31.6 | 29.6 | |
| Mean | 17.84 | 20.17 | 21.99 | 25.9 | 27.3 | 27.3 | 26.67 | |
| PH | Min | 5.7 | 6.1 | 6.3 | 5.9 | 7.2 | 6.7 | 6.8 |
| Max | 8.2 | 8.0 | 8.1 | 7.8 | 8.2 | 7.9 | 8.1 | |
| Mean | 7.26 | 7.16 | 7.29 | 7.03 | 7.49 | 7.33 | 7.37 | |
| DO | Min | 1.9 | 1.8 | 0.00 | 0.00 | 0.00 | 0.00 | 0.00 |
| Max | 8.4 | 8.2 | 8.00 | 8.1 | 7.8 | 7.6 | 7.8 | |
| Mean | 4.49 | 4.39 | 4.39 | 3.69 | 3.74 | 3.47 | 3.49 | |
| BOD5 | Min | 3.1 | 2.8 | 3.1 | 1.9 | 2.1 | 1.8 | 2.7 |
| Max | 137 | 125 | 103 | 124 | 147 | 88 | 122 | |
| Mean | 74.44 | 52.4 | 64.44 | 62.7 | 72.59 | 49.83 | 63.24 | |
| EC | Min | 438 | 768 | 842 | 761 | 752 | 801 | 748 |
| Max | 1326 | 1231 | 1125 | 1152 | 1020 | 1089 | 1105 | |
| Mean | 930.4 | 968.1 | 942 | 954.1 | 908.9 | 927.4 | 909.1 | |
| TDS | Min | 531 | 491 | 538 | 487 | 481 | 512 | 478 |
| Max | 784 | 787 | 720 | 737 | 652 | 696 | 707 | |
| Mean | 631.4 | 623.7 | 602.4 | 610.3 | 581.3 | 593 | 589.6 | |
| CL- | Min | 37.2 | 28.6 | 40.00 | 32.6 | 31.1 | 40.2 | 38.6 |
| Max | 171.1 | 168.1 | 185.2 | 160.3 | 138.5 | 122.6 | 135.6 | |
| Mean | 75.44 | 71.47 | 79.79 | 70.74 | 74.59 | 74.79 | 72.87 | |
| Total alkalinity | Min | 153 | 137 | 123 | 141 | 136 | 127 | 117 |
| Max | 382 | 369 | 371 | 416 | 374 | 388 | 372 | |
| Mean | 272.9 | 281.4 | 281.9 | 279.9 | 277.7 | 276.3 | 262.6 | |
| Total hardness | Min | 593 | 572 | 531 | 477 | 436 | 428 | 411 |
| Max | 722 | 685 | 706 | 713 | 651 | 580 | 582 | |
| Mean | 644 | 620.4 | 605.7 | 562.4 | 529.4 | 514 | 506.7 | |
| Ca+ hardness | Min | 473 | 485 | 462 | 359 | 376 | 346 | 368 |
| Max | 593 | 601 | 632 | 623 | 584 | 498 | 497 | |
| Mean | 537.9 | 527 | 518 | 461.6 | 458.4 | 428.6 | 417 | |
| Mg+ hardness | Min | 73 | 48 | 69 | 51 | 57 | 69 | 39 |
| Max | 136 | 97 | 131 | 127 | 86 | 114 | 101 | |
| Mean | 103.3 | 79.86 | 87.71 | 89.14 | 71 | 85.43 | 75.43 | |
| SO4- | Min | 83 | 88 | 93 | 76 | 89 | 67 | 78 |
| Max | 206 | 195 | 237 | 204 | 182 | 188 | 177 | |
| Mean | 137.4 | 142.1 | 136.4 | 129.9 | 135.9 | 139.1 | 128.4 | |
| PO4- | Min | 8.1 | 6.5 | 7.2 | 9.3 | 8.6 | 5.7 | 4.9 |
| Max | 21.1 | 20.3 | 21.5 | 21.3 | 24.5 | 23.1 | 22.3 | |
| Mean | 15.22 | 15.78 | 15.47 | 15.79 | 18.57 | 16.93 | 17.49 | |
Table 15: Summary of Basic Statistics
|
Physio-Chemical Parameters |
Range |
25% Percentile |
75% Percentile | Mean |
Standard deviation |
% Coefficient of Variation |
Standard Error |
| Temperature | 15.2 – 32.5 | 20.17 | 27.3 | 23.88 | 3.853 | 16.13% | 1.456 |
| PH | 5.7 – 8.2 | 7.16 | 7.37 | 7.28 | 0.148 | 2.4% | 0.056 |
| DO | 00.0 – 8.4 | 3.49 | 4.39 | 3.95 | 0.453 | 11.47% | 0.171 |
| BOD5 | 1.8 – 147 | 52.4 | 72.59 | 62.81 | 9.225 | 14.69% | 3.487 |
| EC | 438 – 1326 | 909.1 | 954.1 | 934.3 | 22.12 | 2.37% | 8.362 |
| TDS | 478 – 787 | 589.6 | 623.7 | 604.5 | 18.36 | 3.04% | 6.94 |
| CL- | 28.6 – 185.2 | 71.47 | 75.44 | 74.24 | 3.013 | 4.06% | 1.139 |
| Total alkalinity | 117 – 416 | 272.9 | 281.4 | 276.1 | 6.724 | 2.44% | 2.541 |
| Total hardness | 411 – 722 | 514 | 620.4 | 568.9 | 54.97 | 9.66% | 20.78 |
| Ca+ hardness | 346 – 632 | 428.6 | 527 | 478.4 | 48.99 | 10.24% | 18.52 |
| Mg+ hardness | 39 – 136 | 75.43 | 89.14 | 84.55 | 10.58 | 12.52% | 4 |
| SO4- | 67 – 237 | 129.9 | 139.1 | 135.6 | 4.879 | 3.60% | 1.844 |
| PO4- | 4.9 – 24.5 | 15.47 | 17.49 | 16.46 | 1.236 | 7.51% | 0.467 |
Demonstrate the minimum, maximum and mean values of study sites and summery are listed in table 14 and 15. Comparison of some Physico-Chemical parameters variation in seven sampling stations are shown in figure 2, 3 and 4.
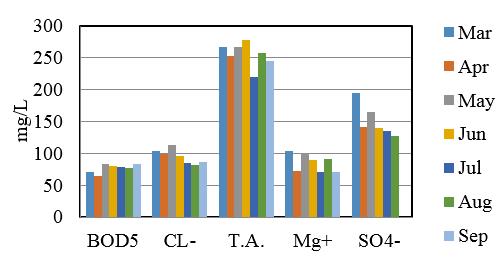
Figure 3: Comparison of some Physico-Chemical parameters variation in seven sampling stations (Mar, Apr,. May, Jun, Jul, Aug and Sep) at Duhok valley. Units of BOD5, CL-, T.A., Mg+ and SO4- are (mg/l).
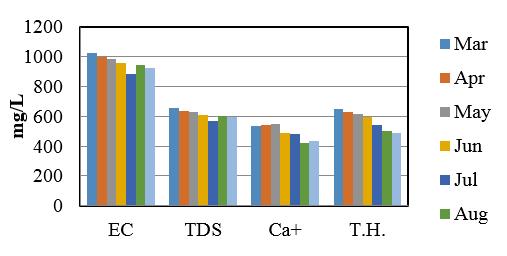
Figure 4: Comparison of other Physico-Chemical parameters variation in seven sampling stations (Mar, Apr, May, Jun, Jul, Aug and Sep) at Duhok valley. Units of EC µs/cm, TDS, Ca+ and T.H. are (mg/l).
4. Conclusion
After complete survey, the waste water of Duhok valley is founded as contains high value of electrical conductivity as a result of domestic waste discharge. Similarly, it is classified as hard water. The absence of dissolved oxygen in some sites was zero as a result of high load of organic material. Decrease of pH value in Duhok valley is found due to domestic pollutant.
- Stankovic , Cickaric D. and Markovic , J, “Determination of Pb and cd in water by potentiometric stripping and analysis (PAS)” Desalination 213: 282-287 (2007)
- APHA (American public Health Association), “Standard method for the examination of water and waste water” 20th ed 10-15 fifteen street, Washington DC, USA (2003).
- Al – Barwre M. R,”Self-purification of the discharge arrived to valley stream of Duhok” Ph. D. Thesis. College of science, university of Mosul (2013)
- Fatoki O.SA, Muyima N.Y., lujiza N., “Situation analysis of water quality in the umtata river catchment” Water SA. 27:467-473 (2011).
- AL-Saffawi A.A, AL-barwre M.R, Al-Jahssany N.K, “Physical, Chemical and biological characteristic of Dohuk valley water” Tikit Journal of pure science 14(2):54-60 (2009).
- WHO, (World Health Organization), Health Guideline for the use of waste water in agriculture and aquaculture Technical report sensor (NO. 778) WHO-GENEVA (1993).
- EPA (Environmental Protection Agency), “Edition of the drinking water standards and Health Advisories” U.S. (2006).
- Al-Barware M.R, “Evaluation of the quality of irrigation water sources of celery plant Apium graveolens in Mosul city and the resultant pollution”, M.sc Thesis, College of science, Mosul university (2004).
- Adefemi O.S, Asaola SS, Olaofe O, “Assessment of the physico-chemical status of water samples from major dams in Ekiti State, Nigeria” Pakistan J. Nutri., 6(6):657-659 (2007).
- Akoto O., Adiyiah J., “Chemical analysis of drinking water from some communities in the Brong Ahafa region” Int. J Envirron. Sci, Tech, 4(2):211- 214 (2007).
- Al-Jahssany. N.K, “Effect of domestic and industrial discharge water of Mosul city upon Tigirs water quality”, M.sc. Thesis. College of science, Mosul University (2003).
- Osibanjo O., Daso P., Cbadebo M., “The impact of industries on surface water quality of river ona and river alaro in oluyole industrial estate, Ibadan, Nigeria”, Afric. J. Biotech. 10(4):696-702 (2011).
- Al-Negashabandi I., “A phycolimnological study on Duhok impoundment and is main watershed”, Ph. D. thesis, Duhok university (2002).
- Habib H.R, Al-saigh N.H., Hassan Z.M, “Geochmistry of underground water in Erbil city”, 2nd scientific Conference of Mosul Dams and water Resources Research center, Mosul University, 718(1990).
- WHO (World Health Organization), “Guideline of drinking water quality”, 3rd ed. Vol. I, Recommendation, printed in China by sun Fung (2004).
- Al-Rawi S.A., Al-Azzo S.L, Abboawi S.A, “Hydro geochemical evalution of Ground water in some part to Mosul City and suitability dor irrigation”, 2nd Scientific conference of Mosul–dams and water Resources Research center, Mosul University (1990).
- Al- Layal, M. A., AlRawi S., M., Al-kawaz H.A, “Physico-chemical evaluation of groundwater around Mosul dam lake used for drinking and domestic purposes” 2nd scientific Conference of Mosul Dams and water Resources Research Center, Mosul University (1990).