An Efficient Approach of Load Shifting by Using SCADA
An Efficient Approach of Load Shifting by Using SCADA
Volume 1, Issue 3, Page No 1-6, 2016
Author’s Name: Usman Sohail1, Muhammad Muneer2, Faraz Khana),3
View Affiliations
1Graduate Engineer, Department of Electrical Engineering, The University of Faisalabad, 38000, Pakistan
2Principal Electrical Engineer, Electra Engineering Pty. Ltd.,Waterford QLD 4133. Australia.
3Field Engineer, Fujitsu Australia Ltd., Docklands, Melbourne, VIC, 3008, Australia
a)Author to whom correspondence should be addressed. E-mail: engr.farazkh@gmail.com
Adv. Sci. Technol. Eng. Syst. J. 1(3), 1-6 (2016); ![]() DOI: 10.25046/aj010301
DOI: 10.25046/aj010301
Keywords: SCADA, Smart Grid, WLAN, Master Terminal Unit, Remote Terminal Unit, Internet Service Provider

Export Citations
The consumption of electric power has increased significantly in the past few years, and its demand is still increasing every day. In this regard, its proper distribution is a significant challenge. This paper includes a method not only to improve the existing power distribution by using SCADA but also to reduce the human errors from the system by making the system automated. As a prototype for this paper, a geographical area was divided in to three regions named as A-Islamabad, B-Rawalpindi and C-Attock. These three regions were used as the Remote Terminal Units RTU’s and were further divided into four sectors based on different types of consumers. One main control unit was set to handle the whole power system which was referred to as the MTU (master terminal unit). MTU was designed in such a way that not only it was capable to show RTU’s readings on Graphical user interface-GUI but also to control them. By establishing such a design, distribution of electric power based on priority was achieved among these regions and thus the load requirements were managed by means of priorities among them. The entire load management task was supervised by an individual who was authorized to control the MTU’s GUI. SCADA system enabled the MTU to regulate the electric power in regions and their sectors. All the RTU’s were connected with the MTU by means of a wireless network based on an Internet Service Provider (ISP). If the system works accordingly, the MTU would be able to access the RTU’s from any part of the world. SCADA provides a platform to manage the overall system with the minimal manpower; hence, the human errors were reduced.
Received: 20 July 2016, Accepted: 11 August 2016, Published Online: 25 August 2016
1. Introduction
Smart Grid is a class of technology that is used by people to enhance the electric power distribution system in this century by implementing computerized control and mechanization. The possibility of proper outcome of this technique is based on the two way communication between the MTU and the RTUs [1]. The power distribution network is the last stage in the delivery of electricity. It transfers electric power to the consumers from the huge transmission lines. The distribution of the substations is connected with the transmission system and lowers the output voltage between 2KV and 35KV by using transformers. SCADA
system consists of one or more field data interface devices (RTU’s), a communication system such as telephone, cable, satellite, etc. A MTU provides a collection of standard and/or custom software Graphical User Interface-GUI, critical infrastructure systems which include critical physical processes. These processes are controlled by automation systems which combine humans, computers, communications, and procedures [2]. The utilization of advanced technologies in the smart grids have improved the energy efficiency by proper management of demand from the consumer side, so that it matches with the availability of electric power. The transmission media used for SCADA system includes copper cable, coaxial cable, fiber optic cable and electromagnetic propagation through the atmosphere [3]. The use of satellites, web based communications, and real-time communications with the improved technologies, are enabling utilities to point out problems and faults in the grid faster than before. A variety of median options can be considered for SCADA based new projects or to upgrade obsolete SCADA communication systems. The selection of any of these communication media depends on the technical requirements for the application, geographic considerations of remote facilities to be monitored, controlled, availability of established systems and economic requirements [4]. Implementation of SCADA system minimize the initial cost and provides a complete control over the system, which requires few individuals to control it [5]. The RTU and MTU are the core parts of this system. The RTU of each region, collects information and transfers it to the MTU. The MTU in response, provides a suitable command to the RTU in order to run the system properly. These systems are based on Wireless Local Area Network-WLAN via the Internet Service Provider-ISP for communication between Master Terminal Unit -MTU and the RTU’s [6]. The data demonstration is mostly in visual form, the operator can view it on the GUI screen of the RTU’s as well as on MTU.
2. Background
2.1. SCADA System
SCADA stands for Supervisory Control and Data Acquisition. This system becomes popular in the 1960’s in order to monitor and regulate the remote equipment. Mainframe technology was in use in the early times of SCADA systems but that technique requires human operators to make decisions and also to maintain the information system. In 1960, the SCADA system becomes most popular system for the management and distribution of electric power among different areas because it monitors and also controls the distribution [7]. Early SCADA systems were expensive and not efficient because of the increased human labour cost and the manual operations. The SCADA systems of our age are more effective and cost-efficient. SCADA system is the base for the distributed automation networks and systems. For the smooth monitoring and control of the overall power system, the use of SCADA in electrical utility firms started in early 60’s. The first SCADA based power system was implemented in the USA in 1962, which includes generation, transmission and distribution. [8]. Now days, almost all of the critical industrial infrastructures and processes are controlled remotely from a centralized location by the implementation of SCADA. The management of electricity, flow of oil and gas through pipes, distribution of water operation of chemical plants and signalling network for the railways are some applications of SCADA [9].
2.2. System Components of SCADA
The SCADA system mainly consists of the following subsystems:
- GUI or Graphical User Interface to present data to human operator to control the process.
- RTU or remote Terminal units which connects sensors and transform signals to digital data.
- Microcontrollers to control all the processes within a grid station and to process data.
- Terminal system, to interface controllers and RTU’s with centralized control system.
- Data acquisition server is an application service which processes industrial protocols to connect application services.
- Supervisory systems (computers), to collect data on processes and send commands to the SCADA system
- Communication set-up is used to connect the supervisory system to the RTU’s [9].
2.3. Smart Grid
Smart Grid is the result of the desires of worldwide power industry’s stakeholders to respond to the designing and building challenges of the power network “the grid” of the future. Different names such as intelligent grid, grid wise, EPRI’s Intelligrid, and others. The Smart Grid is integrating the electrical and information technologies in between any point of generation and any point of consumption”. EPRI website offers a laconic definition which states “A Smart Grid is one that incorporates information and communications technology in to every aspect of electricity generation, delivery and consumption in order to minimize environmental impact, enhance markets, improve reliability and service, and reduce costs and improve efficiency” [10]. Intelligent monitoring, control, communication and self-handling technologies are the outcomes of smart grid innovative products and services to allow distributors to play their role in optimizing the operation of the system and provide distributors with enhanced information and choice of supply.
The improved reliability, quality of power, reduction in peak demand, reduction in transmission congestion costs, potential for enhanced energy efficiency, benefits gained by increased asset utilization, upgraded security, accommodation ability for renewable energy, improved strength and ease of repair in response to nasty attacks, is the potential promise of the smart grid [10].
3. Design Methodology
In this paper, monitoring and control of three regions A,B & C (RTU’s) of the geographical area are analysed. Each of these areas are divided into four sectors named as Industrial Sector, Commercial Sector, Residential Sector and Social Sector. All of these sectors are connected to their RTU’s and these three RTU’s are further connected with MTU via WLAN over ISP. Often in SCADA systems, the RTU is located at a remote location. This distance can vary from tens of meters to thousands of kilometers. One of the most cost-effective ways of communicating with the RTU over long distances can be by simple internet connection [11]. After establishing an internet connection, a link is created between database and MTU which results in controlling of any RTU anywhere by sending and receiving real time data to the remote database and also the RTU’s can access that data and send acknowledgements to MTU.
These three RTU’s, are controlling three regions, and their selves are further controlled by a centralized location named as MTU. On the GUI of MTU, every detail about the power, voltages and currents can be viewed and hence the load requirements can be managed and supplied to the distribution zones according to the consumers of RTU’s. All this may result in the proper distribution of electric power and also in removal of human errors by making the system automated.
3.1. Distribution Zones/Geographical Regions
A region is divided into four sectors named as industrial, commercial, residential and social sector, as shown in Figure 1. All of these four sectors have different load requirements according to the type of consumers in them.
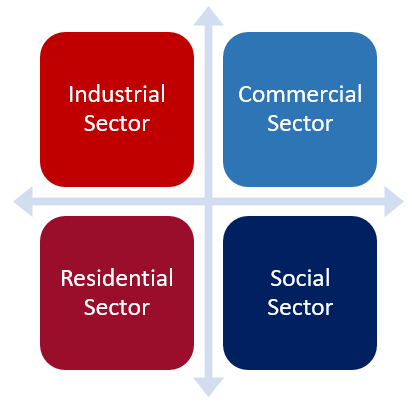
Figure 1: Four sectors of a geographical region
All of the four sectors are connected to the RTU of that region, which in turn provides the information regarding the load requirements among the distribution regions.
3.2. Block Diagram
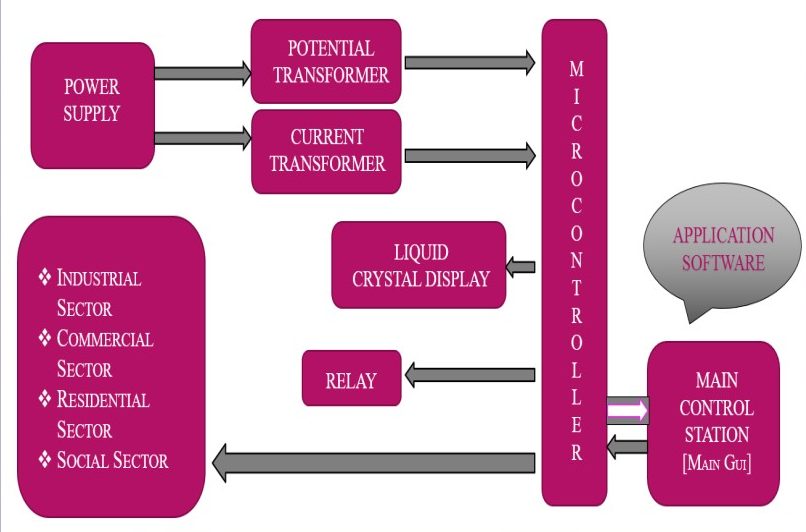
Figure 2: Block diagram
The block diagram of the smart grid system, which is based on SCADA is shown in Figure 2. The potential transformers-PT and current transformers-CT can be worked as the sensors to sense current and voltage ratings in the sectors of RTU. The microcontroller receives the information from the sensors and displays the data on LCD. After that, the relays can be turned ON/OFF according to the load situation. The switching of relays is the main task in the circuitry to supply or cut the load from any region or sector.
3.3. GUI and Communication between MTU and RTU’s
GUI’s of MTU and RTU’s are designed in Microsoft Visual Studio using windows form for the front end and C# for the server side. A remote database is created to store the real time data so that the communication between MTU and RTU’s can be done. For this purpose, logics were implemented using C# and their combined execution results in successful communication between MTU and RTU. Priorities have been set on the RTU’s and their sectors by implementing conditional statements in the program code. Which in results performs desired power switching, “ON” or “OFF” in the targeted sector of the targeted RTU. Also the MTU receives acknowledgements, on real time regarding changes in status of sectors from On to Off and vice versa.
3.4. Priorities for power distribution
By using SCADA in a smart grid system, the electric power can be distributed in the different regions and sectors according to the requirements. But what could be a solution, if the load increases? Or if the system cannot meets the demand side requirements? The solution could be the priority based power distribution. To avoid the total shutdown of the whole system, a specific shutdown in a certain region could be a better option. To achieve this, a priority based technique can play its role. In priority based power distribution, priorities can be set on the different regions and also on the sectors of the regions according to the importance of that area. In this paper, the priorities regarding regions and sectors are shown in the table 1:
Table 1: Priorities among regions and sectors
|
Region |
Name of Sector |
Priorities | |
| Region Based | Sector Based | ||
|
A-Islamabad |
Industrial |
1st |
1st |
| Commercial | 2nd | ||
| Residential | 3rd | ||
| Social | 4th | ||
|
B-Rawalpindi |
Industrial |
2nd |
1st |
| Commercial | 2nd | ||
| Residential | 3rd | ||
| Social | 4th | ||
|
C-Attock |
Industrial |
3rd |
1st |
| Commercial | 2nd | ||
| Residential | 3rd | ||
| Social | 4th | ||
In case of increase in the load requirements from the demand side, the least priority sector of the least priority region will be shut down. It means if the load increases than the social sector of third region, Region C, would be shut down. The sectors and regions of top priorities may not blackout. After setting these priorities, the system may run according to the requirements and also can meet the load shifting requirements.
3.5. Circuit diagrams
The controller section of the smart grid consists of a DC power supply, microcontrollers, LCD’s, RS 232 port and MAX 232 serial.
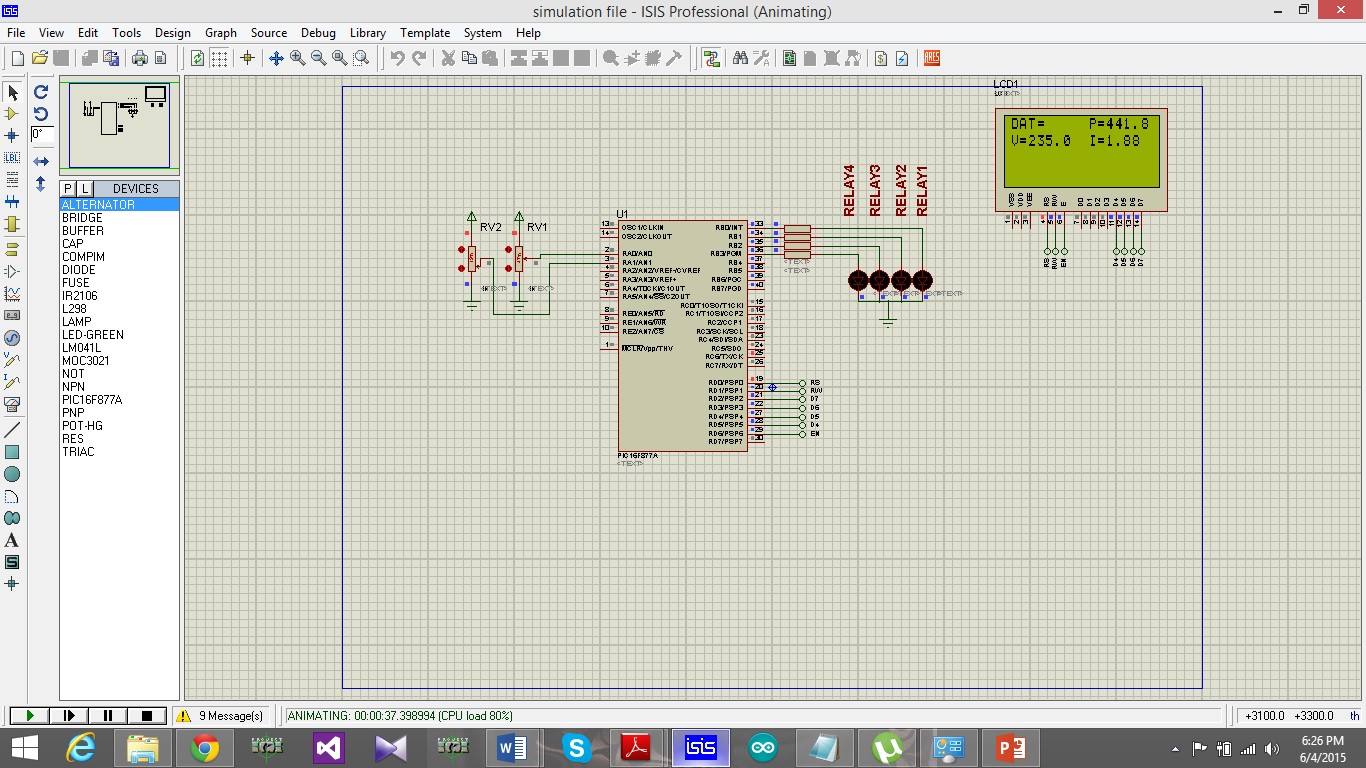
Figure 3: Controller section
communication IC’s. Firstly the DC power supply provides the circuit with a sharp 5v input to run the microcontroller. After that the controller reads the data received from the MAX 232 IC to checks the status of the grids, whether ON or OFF. The relays connected in the switching section are operated by the input from this section i.e. controller section, As shown in the figure 3.
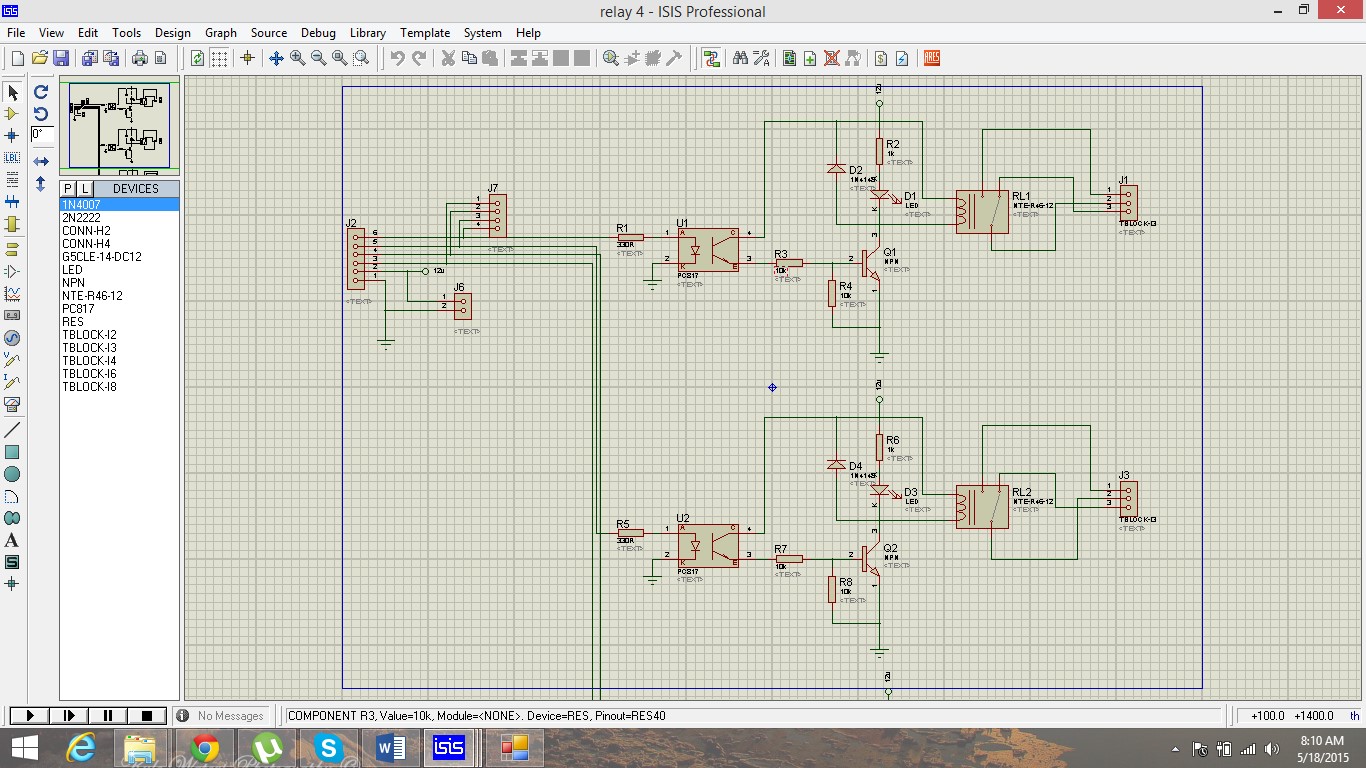
Figure 4: Switching section
Figure 4 shows the relays operation. This is the switching section of the smart grid. The relay operates after receiving the command from microcontroller i.e. ON or OFF. Microcontroller is programmed in such a way that the relays can operates manually by changing the state of the grid ON/OFF on the GUI screen or by the priority based automatic shutdown of the least priority sector of that grid-(RTU), when the load in the highest priority sector would increase.
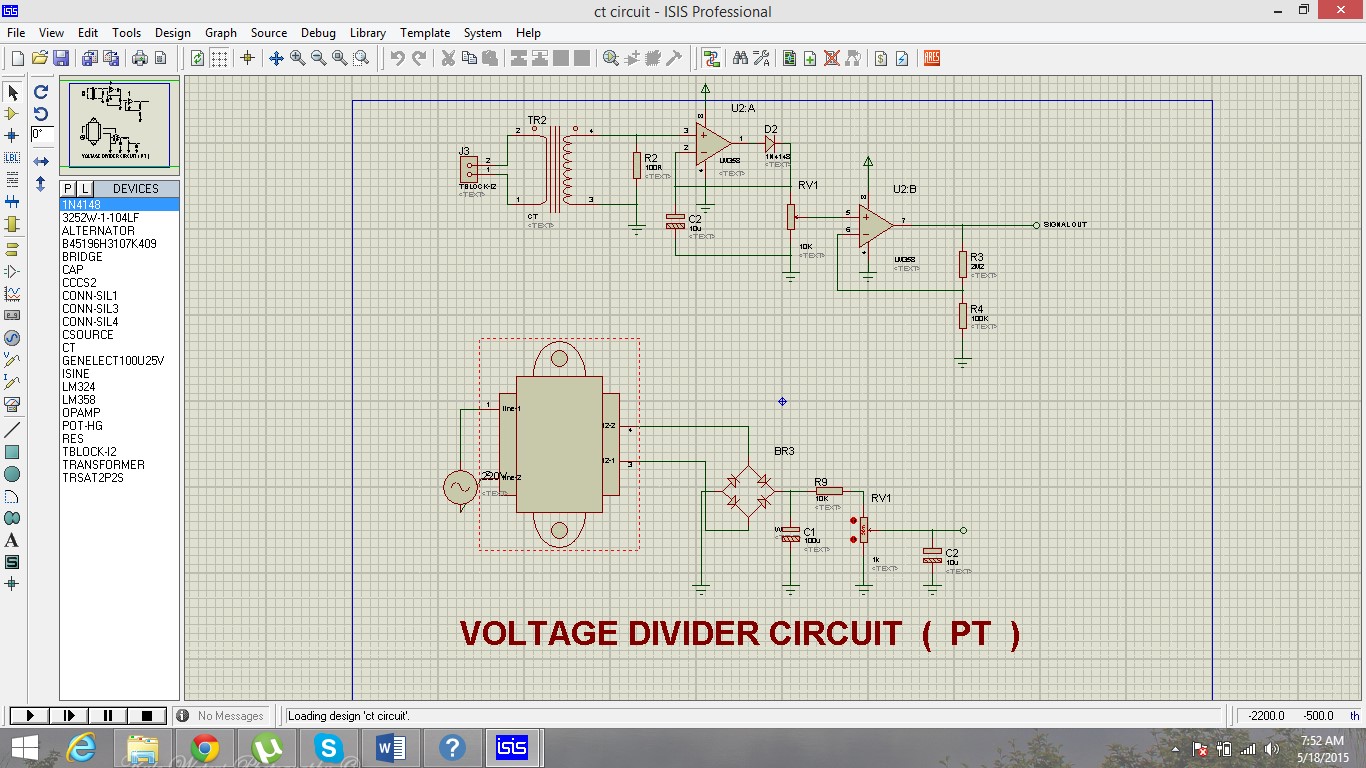
Figure 5: Sensing section
The third section in the smart grid is sensing section, which includes the current transformers and potential transformers, As shown in Figure 5. Both transformers work as sensors in this circuitry. They sense the voltages and currents which are being consumed by the system. After that, they transmit the data of the grid to the microcontroller, which in turn transmits it to the GUI of specific grid via serial communication. Finally, the RTU’s transfers this information to the MTU via WLAN over ISP.
In this paper, all the commands, to operate or to shut down the sectors, can only be send through the MTU, as the idea behind the design of this system is to reduce human error, labour and overall system cost. To operate such system, only few individuals would be required.
4. Graphical User Interface
To handle the system properly, there is a need of a graphical user interface (GUI) which can provides a variety of information about the RTU’s. For this purpose, a GUI was developed using the Microsoft Visual Studio as shown in Figure 6. The GUI of MTU is designed in such a way that it can display the real time information of all the regions and their sectors and control them wirelessly. After every manual operation from the MTU,RTU send the acknowledgements of the tasks, in both cases, done or not done. The GUI of RTU just shows the real time values of the power, currents and voltages.
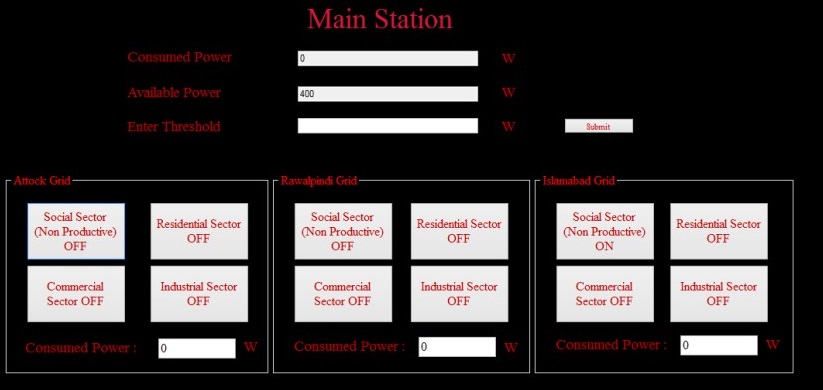
Figure 6: MTU’s GUI
The MTU’s GUI shows the three geographical regions (RTU’S) and four sub-sections of each section (sectors). All sectors of the three regions are organized by this MTU’s GUI. On the bottom of the main GUI screen, there are three blocks below each section which shows the consumed power in each city. On the top of the GUI screen, there are three sections which show the consumed power (across all regions),the available supply capacity, which a system can still holds and the threshold. Threshold is assumed as the maximum supply capacity of the grid e.g. any utility company, which delivers the power to the customers and they consume it according to their needs while having no idea about the maximum capacity of the supplier. In this regard, a threshold is introduced in the prototype of this paper . In the next section of this paper, three different threshold values would be assumed. It would be then analysed that how capable our priority based approach is to shift the load so that load shedding could be avoided.
Also, when different sectors of different regions would turn On or Off, the main GUI and the RTU’s GUI will receive the information against those happenings. This feature is the main entity which delivers the information about the status of power supply in the sectors.
The RTU’s GUI shows four sectors of a certain region (city). These sections just deliver the information of the status of sector On/Off, As shown in figure 7. On the top, there are three sections, they shows the consumed power, the average current and the average voltage ratings of a region.
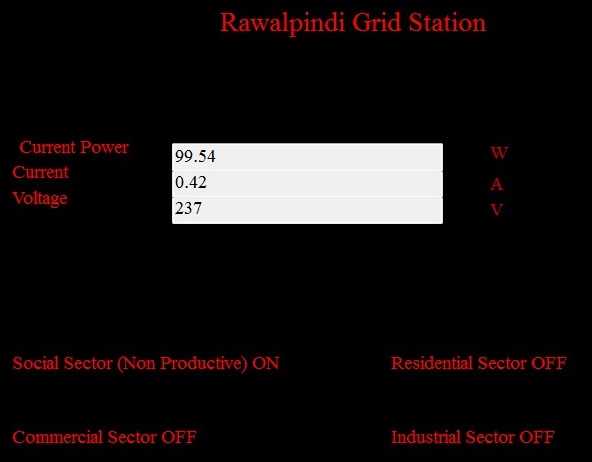
Figure 7: RTU’s GUI
5. Results and analysis
The priority based power distribution was successfully achieved and the load shifted according to the requirement.
Four types of loads are attached to the system which are controlled by the microcontroller and relays. The industrial sector was controlled by heavy duty relay, which could pass 20 amp of current. All other sectors were controlled by simple electromechanical relays which had passed 5 amp of currents As shown in Figure 8.
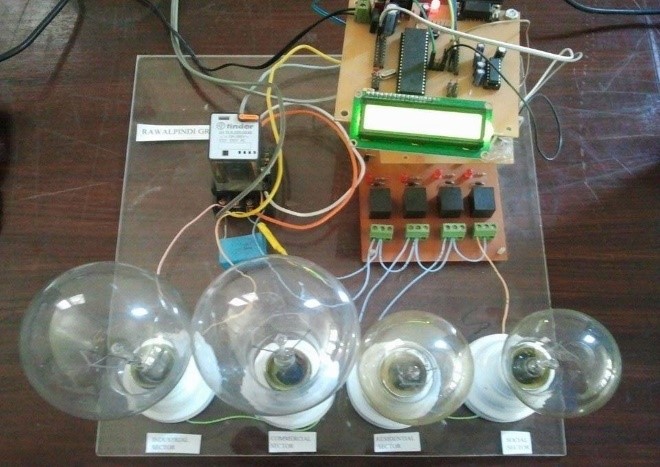
Figure 8: Hardware design of RTU
5.1. Scenario 1
In Scenario 1, the load demand was 10100 watts and the supply capacity (threshold) of the system was 8500 watts. According to the priorities, the sectors with the least priorities would shut down and the load would distribute among the high priority sectors. In this way the system may work according to the requirements. In the table 2, the scenario 1 is summarized in which the load demand exceeds the maximum supply capacity. As a result, the sectors with least priority were shutdown and the load is transferred to the high priority sectors.
Thus a total shutdown of the whole system was avoided.
Table 2: Scenario 1- priority based distribution
|
|
Name of Sector |
Scenario 1 | Result | ||
|
Thresh hold |
Required Power |
Over load |
ON/ OFF |
||
| 10100W | |||||
|
A |
Industrial |
8500w |
1500w |
1600 w |
ON |
| Commercial | 1300w | ON | |||
| Residential | 750w | ON | |||
| Social | 500w | OFF | |||
|
B |
Industrial | 1350w | ON | ||
| Commercial | 1100w | ON | |||
| Residential | 600w | ON | |||
| Social | 350w | OFF | |||
|
C |
Industrial | 1000w | ON | ||
| Commercial | 900w | ON | |||
| Residential | 500w | OFF | |||
| Social | 250w | OFF | |||
5.2. Scenario 2
In Scenario 2, the load requirement was 18300 watts and the threshold in the system was 15000 watts. The results were summarized in the table as shown in the table 3.
Table 3: Scenario 2- priority based distribution
|
|
Name of Sector |
Scenario 2 | Result | ||
| Threshold (W) | Required Power |
Over load |
ON/ OFF |
||
| 18300W | |||||
|
A |
Industrial |
15000 |
4000w |
3300 w |
ON |
| Commercial | 2000w | ON | |||
| Residential | 1000w | OFF | |||
| Social | 500w | OFF | |||
|
B |
Industrial | 3000w | ON | ||
| Commercial | 2000w | ON | |||
| Residential | 1000w | OFF | |||
| Social | 500w | OFF | |||
|
C |
Industrial | 2000w | ON | ||
| Commercial | 1500w | ON | |||
| Residential | 500w | ON | |||
| Social | 300w | OFF | |||
5.3. Scenario 3
In Scenario 3, the load requirement was 13900 watts and the threshold in the system was 5100 watts. The results were summarized in the table 4:
Table 4: Scenario 3- priority based distribution
|
|
Name of Sector |
Scenario 3 | Result | ||
| Threshhold | Required Power | Overlload |
ON/ OFF |
||
| 18900W | |||||
|
A |
Industrial |
5100w |
4900w |
13900w |
ON |
| Commercial | 2000w | OFF | |||
| Residential | 1000w | OFF | |||
| Social | 200w | ON | |||
|
B |
Industrial | 3000w | OFF | ||
| Commercial | 2000w | OFF | |||
| Residential | 1000w | OFF | |||
| Social | 500w | OFF | |||
|
C |
Industrial | 2000w | OFF | ||
| Commercial | 1500w | OFF | |||
| Residential | 500w | OFF | |||
| Social | 300w | OFF | |||
All of the above scenarios have proved that our approach of shifting load on a priority arrangement was successful in avoiding a situation where whole system shuts down, because demand exceeds the supply.
6. Conclusion and further work
After the successful assembly of components, several tests on the hardware, by varying the load conditions on each of the grids, the prototype of project was working according to the requirements and by using the Graphical User Interface-GUI, it became very easy to operate and control the whole system for the proper and efficient distribution of electric power among different sectors of different regions. The manual operation of power system requires significant manpower, which increases the overall system cost, it is necessary to implement SCADA to control and monitor the system [6]. To tackle the variation of load requirements along with the priority based distribution to avoid a total shutdown was the main achieved task of this project. Some of the advancements, which could be implemented in this system are; (a) Strong database to keep all the record of previous and real time data (b) Strong interactive GUI for the RTU’s so they can send requests to the MTU (c) A manual control button in the main GUI to shut down a whole city at once.
- Pahwa, A., Venkata, S. S., “Preparing the workforce for smart distribution systems,” IEEE PES Innovative Smart Grid Technologies Asia (ISGT), 1-3 (2011). https://doi.org/10.1109/ISGTAsia.2011.6167152
- Khin Thu Zar, Hla Myo Tun, International Journal of Electronics and Computer Science Engineering, “Design and Implementation of SCADA Syatem Based Power Distribution for Primary Substation”, Department of Electrica Engineering, Mandlay Technological University, Myanmar, IJECSE, 3(3): 254-261 (2014).
- Nordman, Mikal and Matti Lehtonen, “TETRA Radio In Monitoring and Control of Secondary Substations,” IEEE Developments in Power System Protection Conference, 283-286 (2001). https://doi.org/10.1049/cp:20010155
- Usta, O., M.A. Redfern, M. Bayark, “Data Communications for Power System Relying,” Electrotechnical Conference, 1998. MELECON 98, 964-968 (1998). https://doi.org/10.1109/MELCON.1998.699371
- Dan Ehrenreich and Shlomo Liberman, “Cost Benefits resulting from use of Integrated Communications for Distribution Automation DA/DSM”, Asia and Singapore, (1995).
- Rajib B. Roy, “Controlling of Electrical Power System Network by Using SCADA”, Int. J. Sci. Engg. Resh., 3(10): 1-6 (2012).
- Xu, Z., Xue, Y., and Wong, K. P., “Recent advancements on smart grids in China,” Elect. Power Component. Syst., 42(3-4): 251-261 (2014). https://doi.org/10.1080/15325008.2013.862327
- Hadi Saadat, “Power System Analysis”, Tada McGraw-Hill Publishing Company Limited, (1999).
- Farkhod Alsiherov, Taihoon Kim, “Research Trend on Secure SCADA Network Technology and Methods”, WSEAS Trans. Sys. Cont., 8(5): 635-645 (2010).
- David Baily & Edvin Wright, Practical SCADA for Industry, Newnes, (2003).
- W. T. Shaw, Cyber Security for SCADA Systems, McGraw-Hill Publishing Company Limited, USA, (2006).
Fulltext views All time
No metrics data to plot.
Total Download All time
No metrics data to plot.